HC2091 Finance: Reliance Worldwide Corp. Performance Analysis
VerifiedAdded on 2023/06/03
|22
|4027
|275
Report
AI Summary
This paper provides an in-depth financial analysis of Reliance Worldwide Corporation (RWC), utilizing financial ratio analysis, share valuation, and share price movement to assess the company's financial health and provide investment recommendations. The analysis reveals that RWC is profitable, as indicated by increased ROE, ROA, and net margin, and possesses sufficient liquidity to cover its short-term liabilities, supported by high current and quick ratios. Furthermore, the report observes a positive trend in RWC's share price over the past two years. Based on these findings, the report recommends that investors consider adding RWC shares to their portfolios.
Analysis of Reliance Worldwide 1
ANALYSIS OF RELIANCE WORLDWIDE
Author
Student’s Number
Court title
Course Number
Professor
City
Date
ANALYSIS OF RELIANCE WORLDWIDE
Author
Student’s Number
Court title
Course Number
Professor
City
Date
Paraphrase This Document
Need a fresh take? Get an instant paraphrase of this document with our AI Paraphraser
Analysis of Reliance Worldwide 2
Executive Summary
The paper aims to investigate and evaluate financial performance of Reliance Worldwide
Company based on financial ratio analysis, share valuation and share price movement. From
the ratio analysis, it was found out that RWC is profitable through increased ROE, ROA as
well as net margin. Further, it was found out that RWC is liquid enough in settling most of its
short-run or current liabilities through its current assets. This was based its relatively high
current and quick ratios which were above one. It was also found that RWC share price was
doing relatively good over the past two years with significant increase being observed over
the years. As such, it would be recommendable for the investor to add RWC share in her
portfolio.
Analysis of Reliance Worldwide 3
Table of Contents
Executive Summary...................................................................................................................2
Introduction................................................................................................................................4
Calculation and Analysis of Performance Ratio........................................................................4
Liquidity Ratios......................................................................................................................5
Current Ratio.......................................................................................................................5
Quick Ratio.........................................................................................................................6
Working Capital..................................................................................................................6
Financial Leverage Ratios......................................................................................................7
Debt/asset ratio...................................................................................................................8
Debt/equity..........................................................................................................................8
Asset Utilization Ratios..........................................................................................................9
Asset turnover.....................................................................................................................9
Inventory turnover............................................................................................................10
Receivable turnover..........................................................................................................11
Profitability Ratios................................................................................................................12
Net Margin........................................................................................................................12
ROE..................................................................................................................................13
ROA..................................................................................................................................14
Market Value Ratios.............................................................................................................15
EPS....................................................................................................................................15
Graphical Representation of Reliance Worldwide Corporation Share Price and Comparison of
Its Share Price Movements with All Ordinaries Index............................................................16
Share Valuation........................................................................................................................18
Conclusion................................................................................................................................19
⊘ This is a preview!⊘
Do you want full access?
Subscribe today to unlock all pages.
Trusted by 1+ million students worldwide

Analysis of Reliance Worldwide 4
Recommendation......................................................................................................................19
REFERENCES.........................................................................................................................20
Recommendation......................................................................................................................19
REFERENCES.........................................................................................................................20
Paraphrase This Document
Need a fresh take? Get an instant paraphrase of this document with our AI Paraphraser
Analysis of Reliance Worldwide 5
Introduction
Reliance Worldwide Corporation commonly known as RWC is the Australian-based firm that
manufactures, designs as well as suppliers water flow and provide solution and control
products for use in wall plumbing (Reliance Worldwide Corporation 2017). It manufactures
brass push-to-connects plumbing fittings. The company chief products comprises of
thermostatic products, control valves, pipe and fittings as well as other products the Fitting
and pipe comprises of the plumbing fittings, related products for repair and installation of the
water reticulation systems as well as piping (Financial Times 2018).
Calculation and Analysis of Performance Ratio
Financial ratios are usually conducted by comparing at least two items reported in financial
statements. In other words, ratios are considered as mathematical comparisons of the
financial statements (Innocent, Mary & Matthew 2013). This assists internal organization
management, investors and creditors among others comprehend how well the company is
doing and those areas that require some improvements. They are crucial in determining an
entity’s financial position since they are easy to comprehend and easy to calculate. Further,
ratios are used in comparing different firms across the sector and with their competitors
(Higgins 2012). They enable analysts to compare organizations across the sectors, to identify
their weaknesses and strengths. Ratio analysis can be classified as liquidity, profitability,
market value, solvency or leverage as well as efficiency ratios.
Liquidity Ratios
Such ratio are useful in analysing capacity of Reliance Worldwide Corporation Ltd in settling
off both its short-term debts once they are due and long-term debts once they are current
(Innocent, Mary & Matthew 2013). They show Reliance Worldwide Corporation Ltd cash
Analysis of Reliance Worldwide 6
level and it capacity in turning other total assets to cash in order to settle its current debts. To
be more specific, these ratios are measures of how easy Reliance Worldwide Corporation Ltd
able to raise sufficient cash. In this case, acid test, working capital and current ratios would
be used in evaluating the capacity of Reliance Worldwide Corporation Ltd to raise sufficient
cash.
Current Ratio
This ratio is useful in this case since it would help in examining the capacity of Reliance
Worldwide Corporation in resolving short-term arrears by use of its current assets (Innocent,
Mary & Matthew 2013). Basically, the ratio helps Reliance Worldwide Corporation creditors
and investors in understanding its liquidity level and how easily the firm would be in settling
its current debts. As such, Reliance Worldwide Corporation current ratio would be as
follows:
2016 2017
Current ratio 254,376/ 69,732 = 3.65 313,916/ 117,902 = 2.66
Table 1: Current ratio
As per Table 1 above, it is clear that RWC current ratio decreased over the last two years
though was far much above 1. This implies that for the last two years, RWC was able to settle
its short-term or current debts using its current assets.
Quick Ratio
Also referred to the acid test would be useful in measuring the capacity of Reliance
Worldwide Corporation Ltd in resolving its short-run debt commitments by use of most
liquid form of assets (Innocent, Mary & Matthew 2013). Basically, the ratio helps in
⊘ This is a preview!⊘
Do you want full access?
Subscribe today to unlock all pages.
Trusted by 1+ million students worldwide
Analysis of Reliance Worldwide 7
measuring Reliance Worldwide Corporation Ltd capacity in settling its current or short-term
debts with quick assets. The ratio is computed by dividing quick assets with company’s
current liabilities. As such, Reliance Worldwide Corporation quick ratio would be as follows:
2016 2017
Quick ratio (254,376 – 119,109)/ 69,732
= 1.94
(313,916 – 162,422)/
117,902 = 1.28
Table 2: Quick ratio
In the Table 2 above, it is clear that Reliance Worldwide Corporation quick ratio was
relatively high over the past two years. Despite the decrease within the year, the ratios were
above one meaning that RWC was able to settle some of its short-run debt commitments with
its quick assets.
Working Capital
This value would be useful in determining whether Reliance Worldwide Corporation Ltd is
able to meet most of its short-term or current obligations using its short-term assets (Penman
& Penman 2007). In other words, it would help in determining how much deficiency or
excess there is in Reliance Worldwide Corporation Ltd. As such, Reliance Worldwide
Corporation working capital in 2016 and 2017 would be as follows:
2016 2017
Working capital 254,376 - 69,732 = 184,644 313,916 - 117,902 = 196,014
Table 3: Working capital
Paraphrase This Document
Need a fresh take? Get an instant paraphrase of this document with our AI Paraphraser
Analysis of Reliance Worldwide 8
2016 2017
178,000
180,000
182,000
184,000
186,000
188,000
190,000
192,000
194,000
196,000
198,000
184,644
196,014
Working capital
Working capital
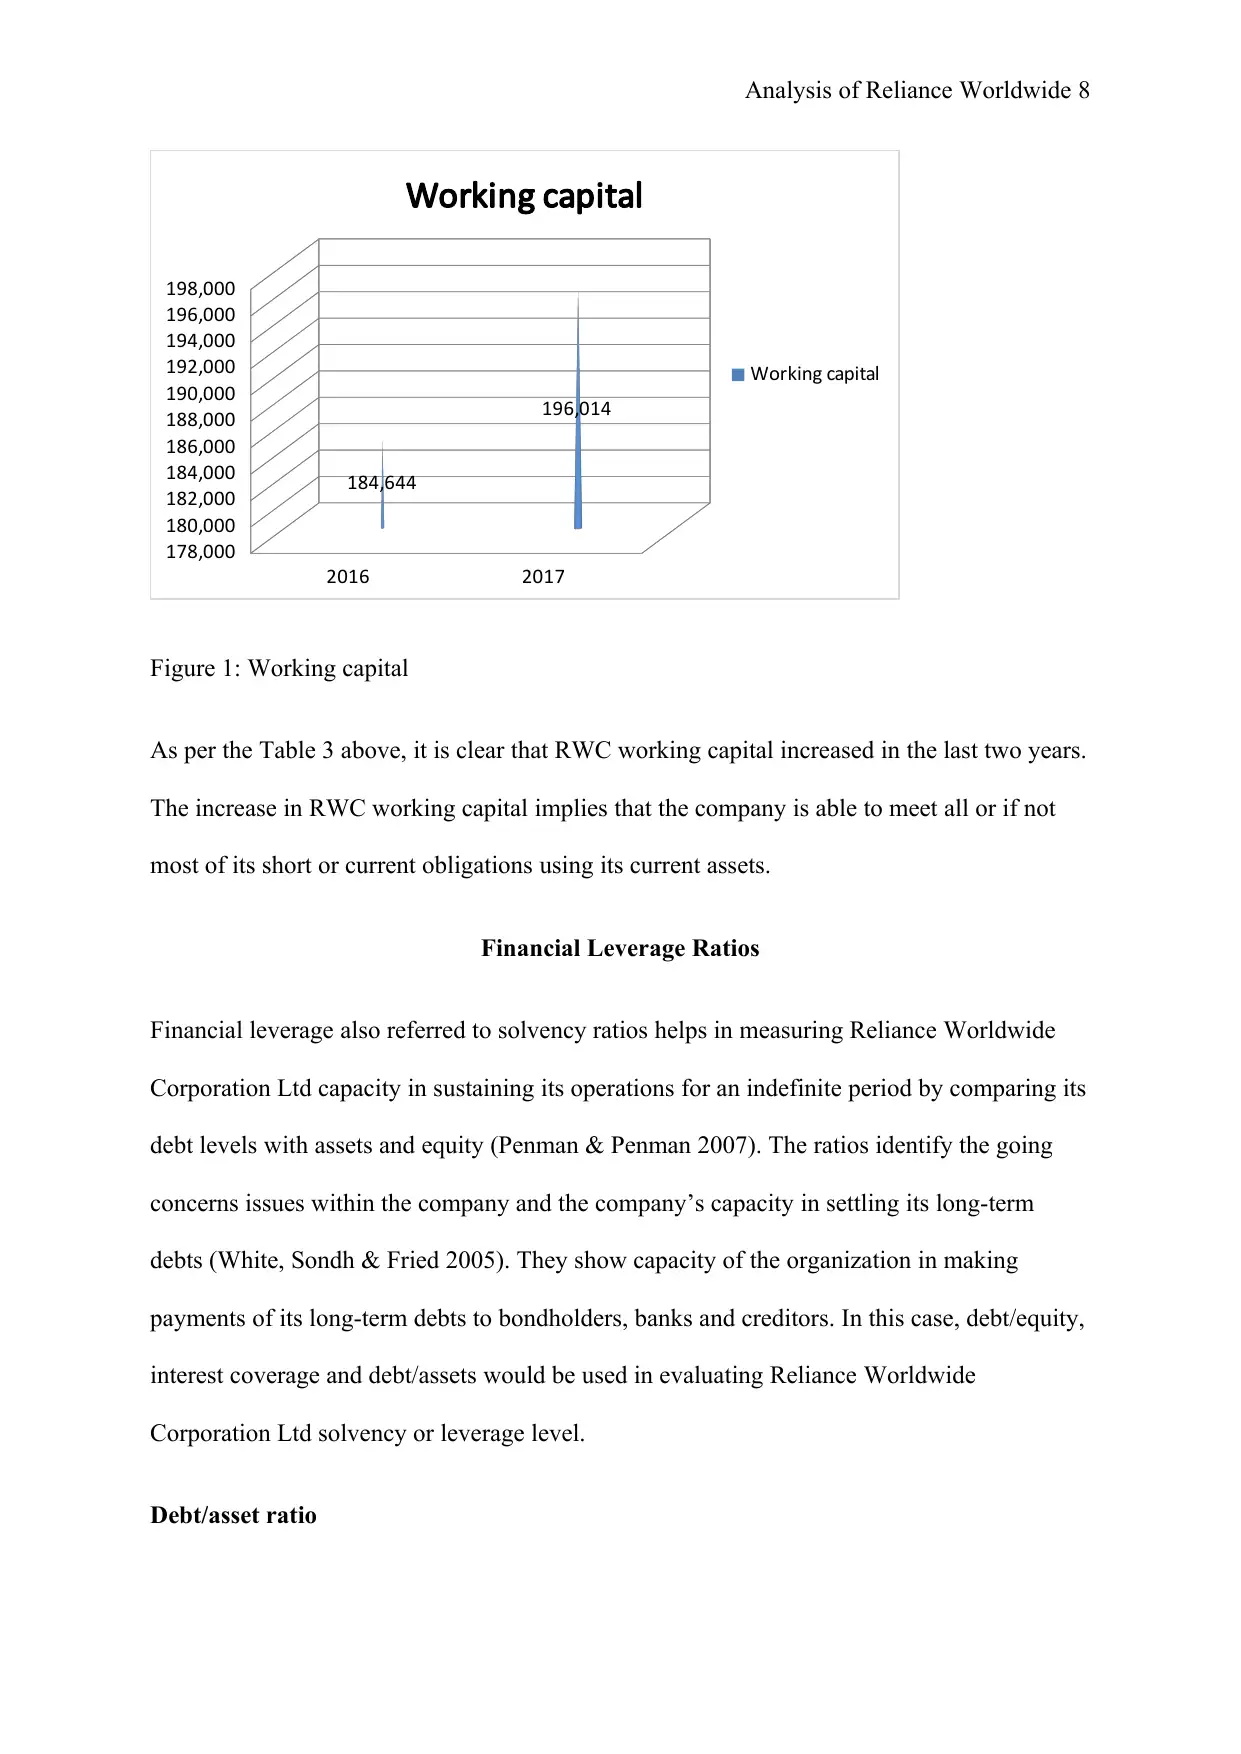
Figure 1: Working capital
As per the Table 3 above, it is clear that RWC working capital increased in the last two years.
The increase in RWC working capital implies that the company is able to meet all or if not
most of its short or current obligations using its current assets.
Financial Leverage Ratios
Financial leverage also referred to solvency ratios helps in measuring Reliance Worldwide
Corporation Ltd capacity in sustaining its operations for an indefinite period by comparing its
debt levels with assets and equity (Penman & Penman 2007). The ratios identify the going
concerns issues within the company and the company’s capacity in settling its long-term
debts (White, Sondh & Fried 2005). They show capacity of the organization in making
payments of its long-term debts to bondholders, banks and creditors. In this case, debt/equity,
interest coverage and debt/assets would be used in evaluating Reliance Worldwide
Corporation Ltd solvency or leverage level.
Debt/asset ratio
2016 2017
178,000
180,000
182,000
184,000
186,000
188,000
190,000
192,000
194,000
196,000
198,000
184,644
196,014
Working capital
Working capital
Figure 1: Working capital
As per the Table 3 above, it is clear that RWC working capital increased in the last two years.
The increase in RWC working capital implies that the company is able to meet all or if not
most of its short or current obligations using its current assets.
Financial Leverage Ratios
Financial leverage also referred to solvency ratios helps in measuring Reliance Worldwide
Corporation Ltd capacity in sustaining its operations for an indefinite period by comparing its
debt levels with assets and equity (Penman & Penman 2007). The ratios identify the going
concerns issues within the company and the company’s capacity in settling its long-term
debts (White, Sondh & Fried 2005). They show capacity of the organization in making
payments of its long-term debts to bondholders, banks and creditors. In this case, debt/equity,
interest coverage and debt/assets would be used in evaluating Reliance Worldwide
Corporation Ltd solvency or leverage level.
Debt/asset ratio
Analysis of Reliance Worldwide 9
The ratio is useful in measuring portion of Reliance Worldwide Corporation Ltd total assets
which is financed through debts (White, Sondh & Fried 2005). It can be gotten by dividing
total debts with the total assets. This ratio is useful in examining the entity’s total debts as the
fraction of its assets. The ratio, displays Reliance Worldwide Corporation Ltd capacity in
settling its liabilities using its assets. As such, Reliance Worldwide Corporation debt/assets
ratio in 2016 and 2017 would be as follows:
2016 2017
Debt/assets 256,088/423,075 = 0.61 395,041/599,787 = 0.66
Table 4: debt/assets
Based on Table 4 above, it is evident that Reliance Worldwide Corporation debt/assets ratio
was relatively low over the past two years. The figures show that for the past two years,
RWC was able to settle its liabilities using its assets.
Debt/equity
It is helpful in determining portion of Reliance Worldwide Corporation Ltd that is financed
by debts and the one financed by equity (Penman & Penman 2007). In other words, the ratio
helps in assessing capital structure of Reliance Worldwide Corporation Ltd over time (White,
Sondh & Fried 2005). In this case, debt/equity is gotten by dividing total liabilities or debts
with the total shareholders’ equity where a ratio more than one means that the organization is
leveraged while value less than one means that the company is conservative. As such,
Reliance Worldwide Corporation debt/equity ratio in 2016 and in 2017 would be as follows:
2016 2017
Debt/equity 256,088/166,987 = 1.53 395,041/204,746 = 1.93
⊘ This is a preview!⊘
Do you want full access?
Subscribe today to unlock all pages.
Trusted by 1+ million students worldwide
Analysis of Reliance Worldwide 10
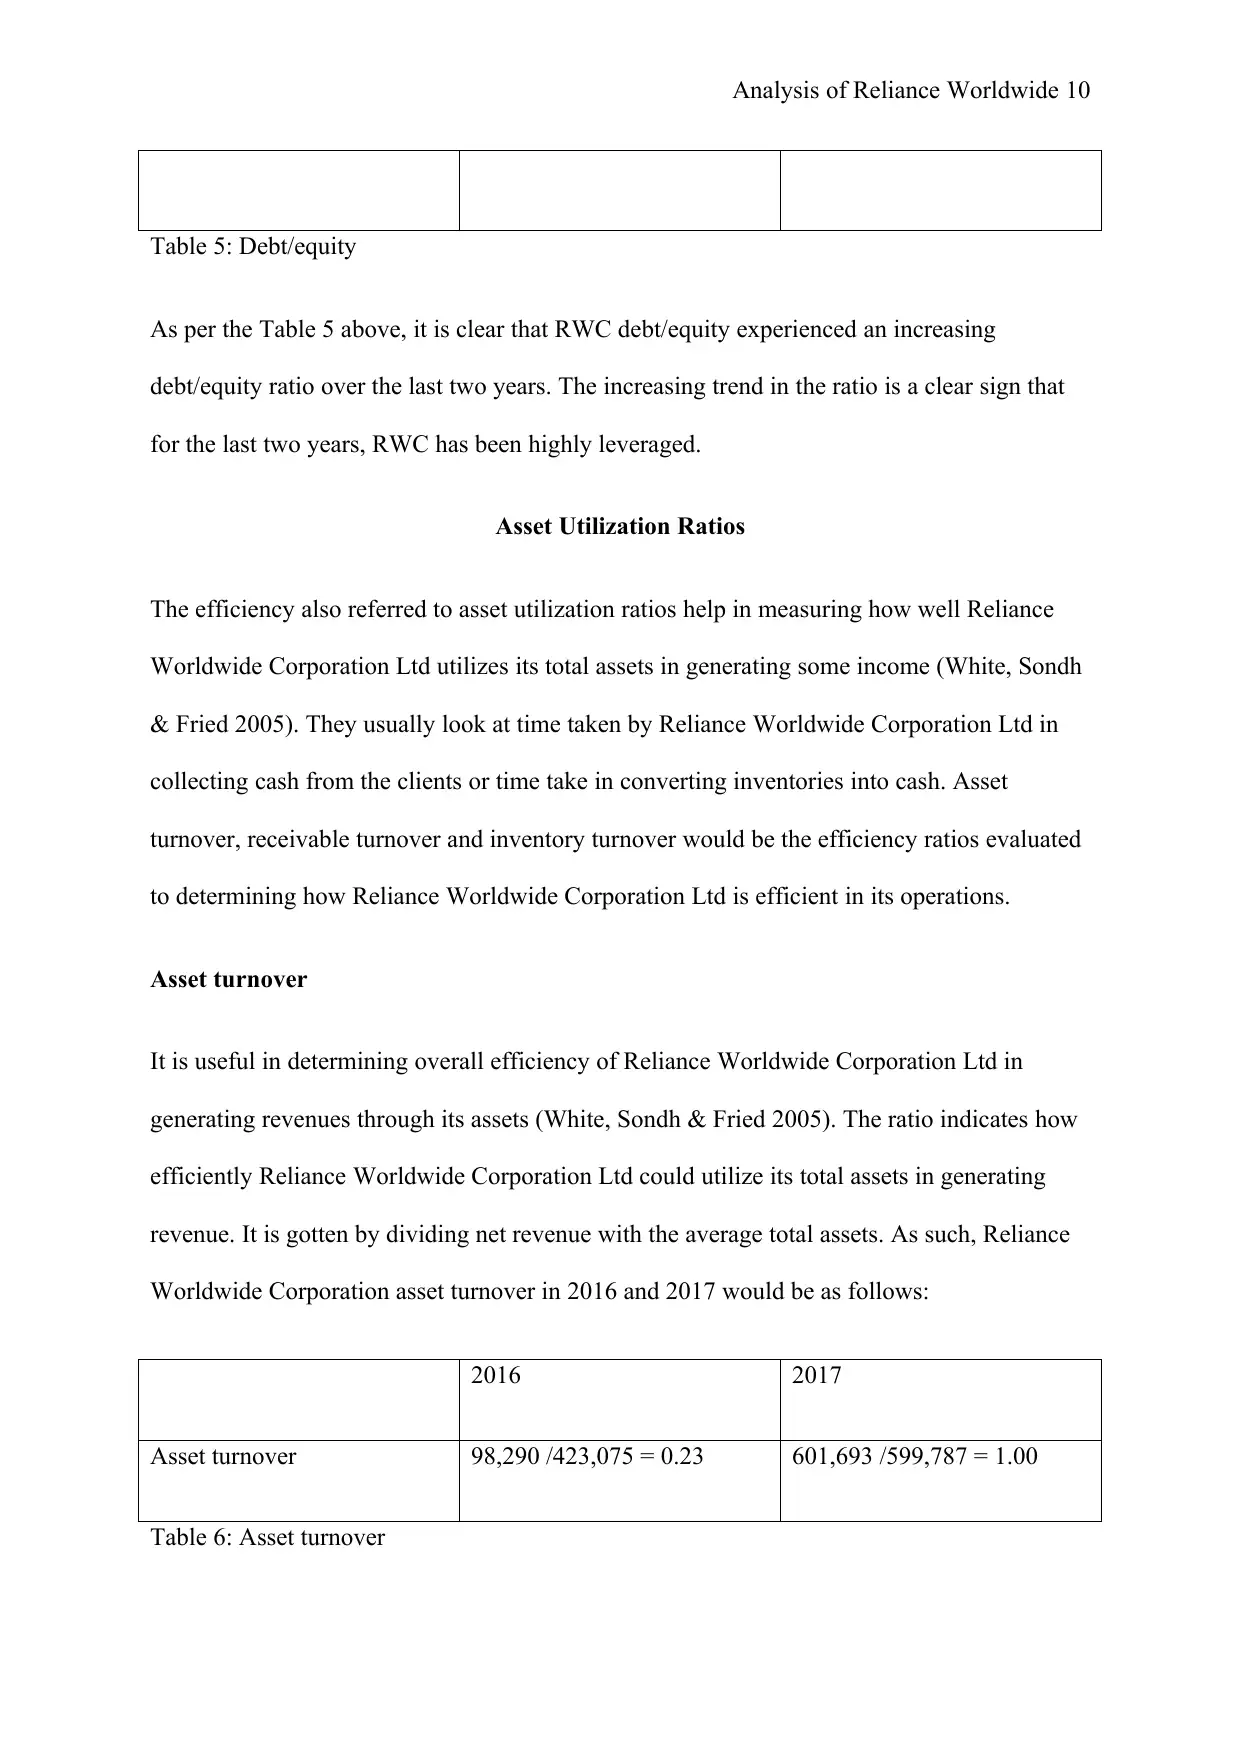
Table 5: Debt/equity
As per the Table 5 above, it is clear that RWC debt/equity experienced an increasing
debt/equity ratio over the last two years. The increasing trend in the ratio is a clear sign that
for the last two years, RWC has been highly leveraged.
Asset Utilization Ratios
The efficiency also referred to asset utilization ratios help in measuring how well Reliance
Worldwide Corporation Ltd utilizes its total assets in generating some income (White, Sondh
& Fried 2005). They usually look at time taken by Reliance Worldwide Corporation Ltd in
collecting cash from the clients or time take in converting inventories into cash. Asset
turnover, receivable turnover and inventory turnover would be the efficiency ratios evaluated
to determining how Reliance Worldwide Corporation Ltd is efficient in its operations.
Asset turnover
It is useful in determining overall efficiency of Reliance Worldwide Corporation Ltd in
generating revenues through its assets (White, Sondh & Fried 2005). The ratio indicates how
efficiently Reliance Worldwide Corporation Ltd could utilize its total assets in generating
revenue. It is gotten by dividing net revenue with the average total assets. As such, Reliance
Worldwide Corporation asset turnover in 2016 and 2017 would be as follows:
2016 2017
Asset turnover 98,290 /423,075 = 0.23 601,693 /599,787 = 1.00
Table 6: Asset turnover
Paraphrase This Document
Need a fresh take? Get an instant paraphrase of this document with our AI Paraphraser
Analysis of Reliance Worldwide 11
In the Table 7 below, it is evident that Reliance Worldwide Corporation asset turnover
increased from 0.23 to 1 in 2017. The increasing trend in the company asset turnover implies
that the company is becoming more efficient in managing its assets or in utilizing its assets to
generate revenue.
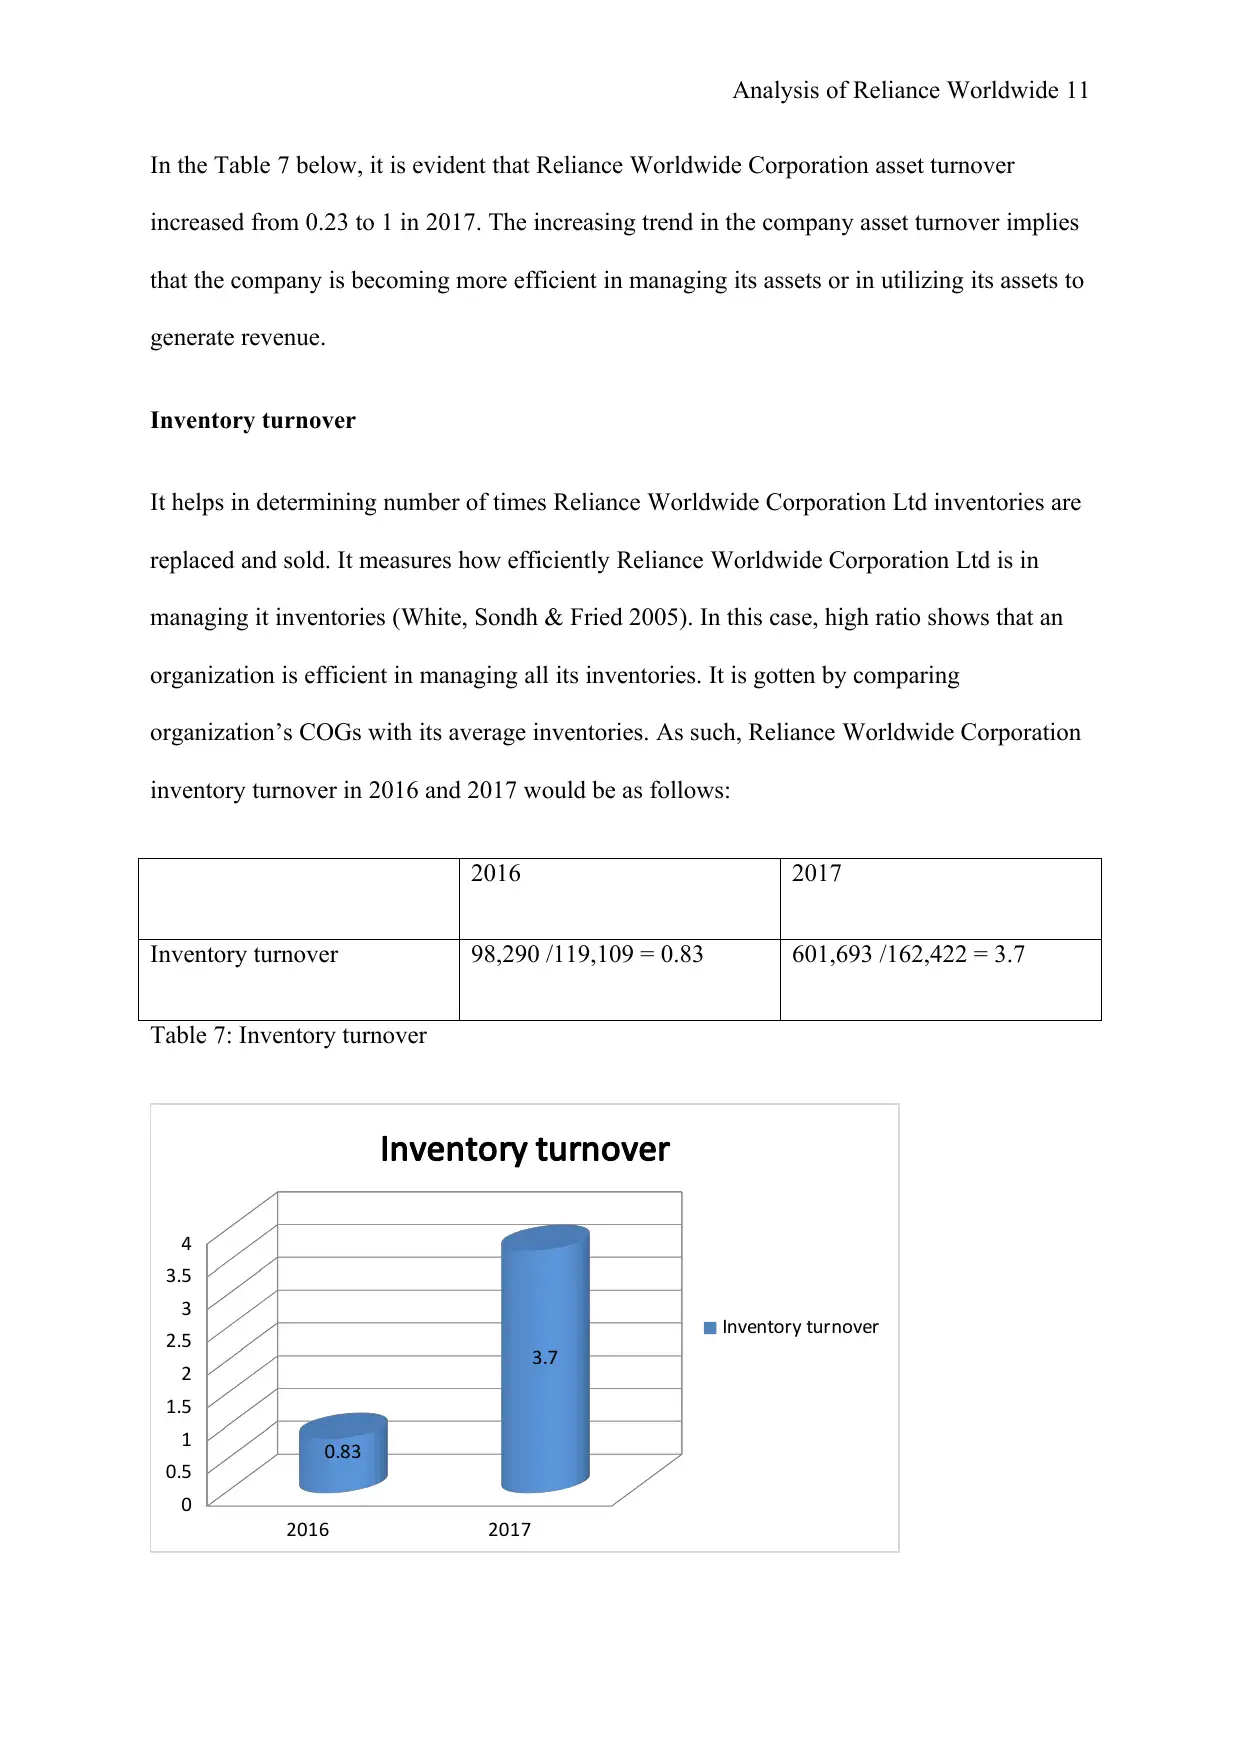
Inventory turnover
It helps in determining number of times Reliance Worldwide Corporation Ltd inventories are
replaced and sold. It measures how efficiently Reliance Worldwide Corporation Ltd is in
managing it inventories (White, Sondh & Fried 2005). In this case, high ratio shows that an
organization is efficient in managing all its inventories. It is gotten by comparing
organization’s COGs with its average inventories. As such, Reliance Worldwide Corporation
inventory turnover in 2016 and 2017 would be as follows:
2016 2017
Inventory turnover 98,290 /119,109 = 0.83 601,693 /162,422 = 3.7
Table 7: Inventory turnover
2016 2017
0
0.5
1
1.5
2
2.5
3
3.5
4
0.83
3.7
Inventory turnover
Inventory turnover
In the Table 7 below, it is evident that Reliance Worldwide Corporation asset turnover
increased from 0.23 to 1 in 2017. The increasing trend in the company asset turnover implies
that the company is becoming more efficient in managing its assets or in utilizing its assets to
generate revenue.
Inventory turnover
It helps in determining number of times Reliance Worldwide Corporation Ltd inventories are
replaced and sold. It measures how efficiently Reliance Worldwide Corporation Ltd is in
managing it inventories (White, Sondh & Fried 2005). In this case, high ratio shows that an
organization is efficient in managing all its inventories. It is gotten by comparing
organization’s COGs with its average inventories. As such, Reliance Worldwide Corporation
inventory turnover in 2016 and 2017 would be as follows:
2016 2017
Inventory turnover 98,290 /119,109 = 0.83 601,693 /162,422 = 3.7
Table 7: Inventory turnover
2016 2017
0
0.5
1
1.5
2
2.5
3
3.5
4
0.83
3.7
Inventory turnover
Inventory turnover
Analysis of Reliance Worldwide 12
Figure 2: Inventory turnover
From Table 8 above, it is clear that RWC inventory turnover increased over the past two
years. The increase implies that Reliance Worldwide Corporation is efficient in managing its
inventories.
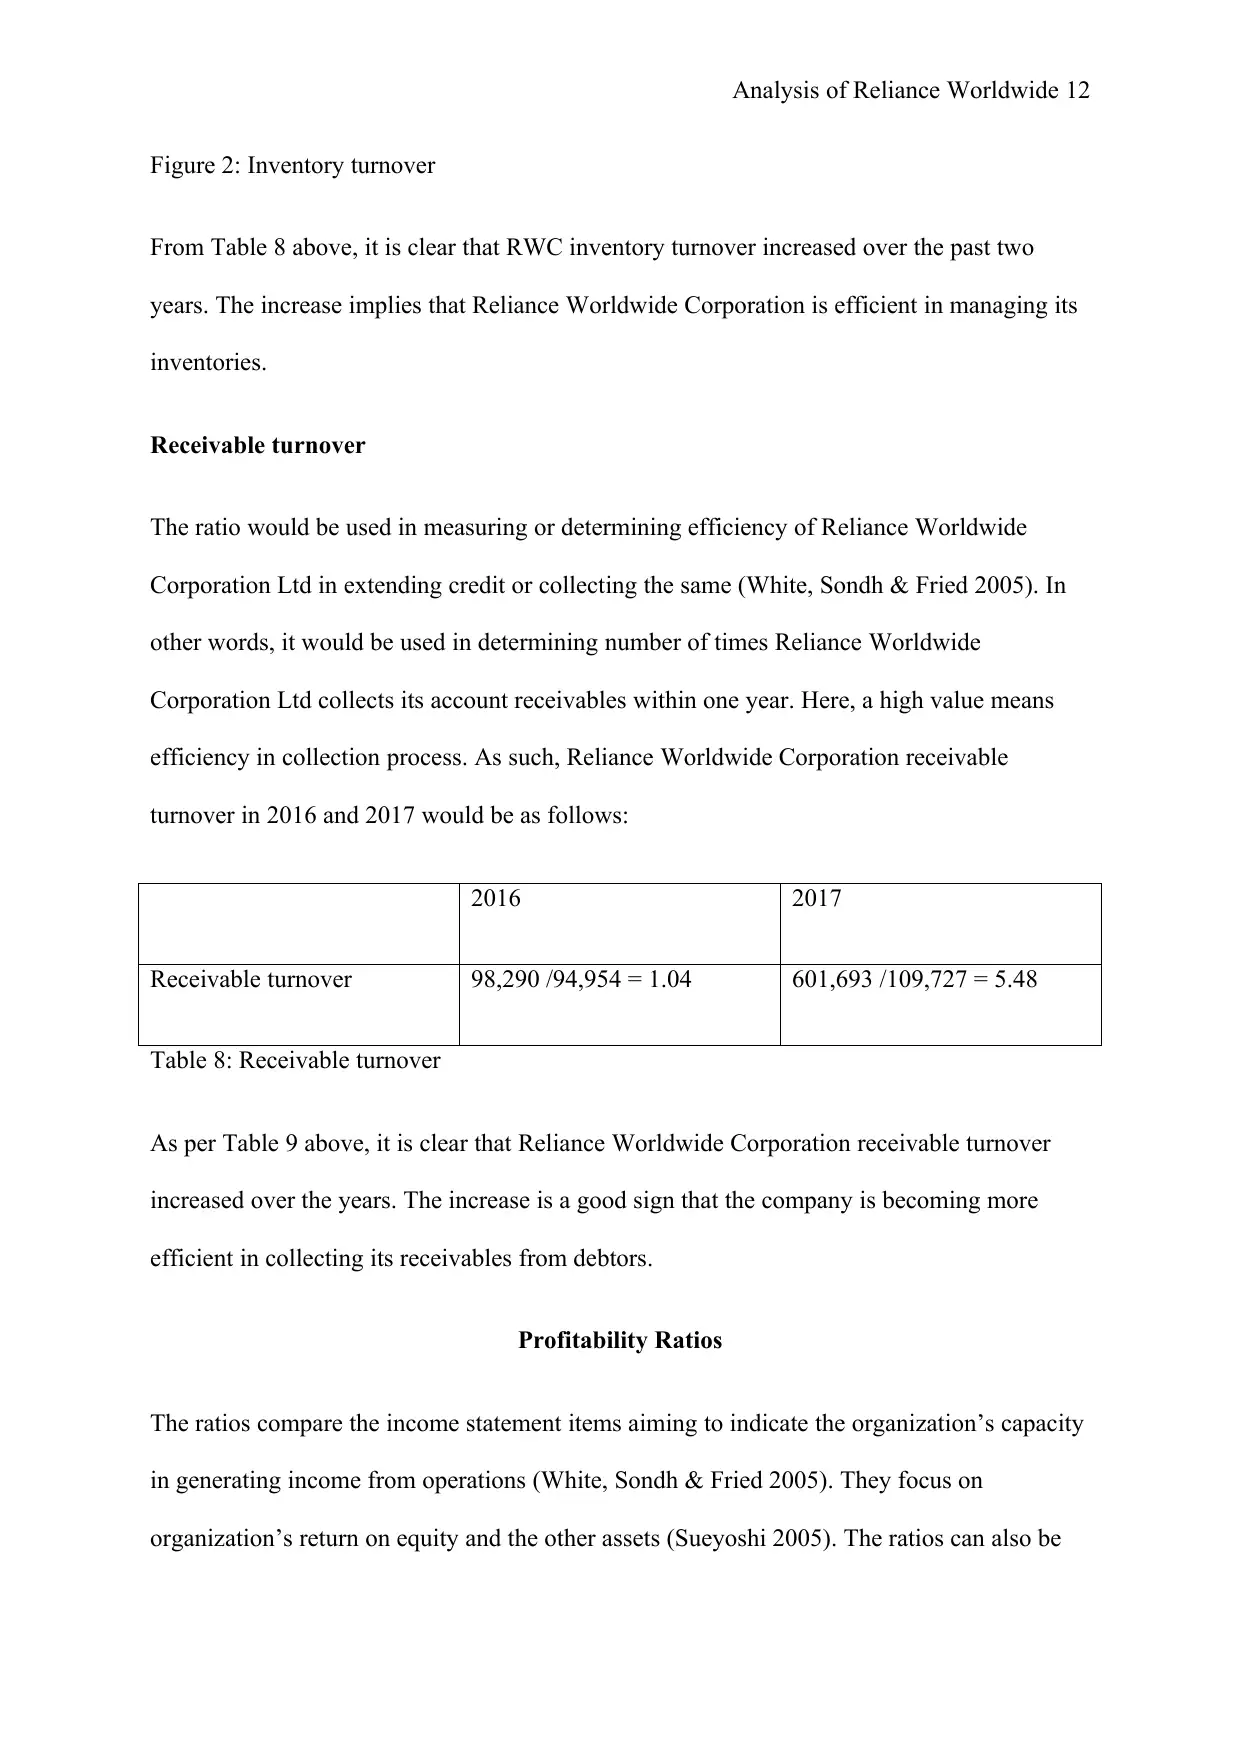
Receivable turnover
The ratio would be used in measuring or determining efficiency of Reliance Worldwide
Corporation Ltd in extending credit or collecting the same (White, Sondh & Fried 2005). In
other words, it would be used in determining number of times Reliance Worldwide
Corporation Ltd collects its account receivables within one year. Here, a high value means
efficiency in collection process. As such, Reliance Worldwide Corporation receivable
turnover in 2016 and 2017 would be as follows:
2016 2017
Receivable turnover 98,290 /94,954 = 1.04 601,693 /109,727 = 5.48
Table 8: Receivable turnover
As per Table 9 above, it is clear that Reliance Worldwide Corporation receivable turnover
increased over the years. The increase is a good sign that the company is becoming more
efficient in collecting its receivables from debtors.
Profitability Ratios
The ratios compare the income statement items aiming to indicate the organization’s capacity
in generating income from operations (White, Sondh & Fried 2005). They focus on
organization’s return on equity and the other assets (Sueyoshi 2005). The ratios can also be
Figure 2: Inventory turnover
From Table 8 above, it is clear that RWC inventory turnover increased over the past two
years. The increase implies that Reliance Worldwide Corporation is efficient in managing its
inventories.
Receivable turnover
The ratio would be used in measuring or determining efficiency of Reliance Worldwide
Corporation Ltd in extending credit or collecting the same (White, Sondh & Fried 2005). In
other words, it would be used in determining number of times Reliance Worldwide
Corporation Ltd collects its account receivables within one year. Here, a high value means
efficiency in collection process. As such, Reliance Worldwide Corporation receivable
turnover in 2016 and 2017 would be as follows:
2016 2017
Receivable turnover 98,290 /94,954 = 1.04 601,693 /109,727 = 5.48
Table 8: Receivable turnover
As per Table 9 above, it is clear that Reliance Worldwide Corporation receivable turnover
increased over the years. The increase is a good sign that the company is becoming more
efficient in collecting its receivables from debtors.
Profitability Ratios
The ratios compare the income statement items aiming to indicate the organization’s capacity
in generating income from operations (White, Sondh & Fried 2005). They focus on
organization’s return on equity and the other assets (Sueyoshi 2005). The ratios can also be
⊘ This is a preview!⊘
Do you want full access?
Subscribe today to unlock all pages.
Trusted by 1+ million students worldwide
1 out of 22
Related Documents


Your All-in-One AI-Powered Toolkit for Academic Success.
+13062052269
info@desklib.com
Available 24*7 on WhatsApp / Email
![[object Object]](/_next/static/media/star-bottom.7253800d.svg)
Unlock your academic potential
Copyright © 2020–2026 A2Z Services. All Rights Reserved. Developed and managed by ZUCOL.