Statistical Analysis of Renewable Energy and Environment Changes
VerifiedAdded on  2022/08/22
|20
|4170
|32
Report
AI Summary
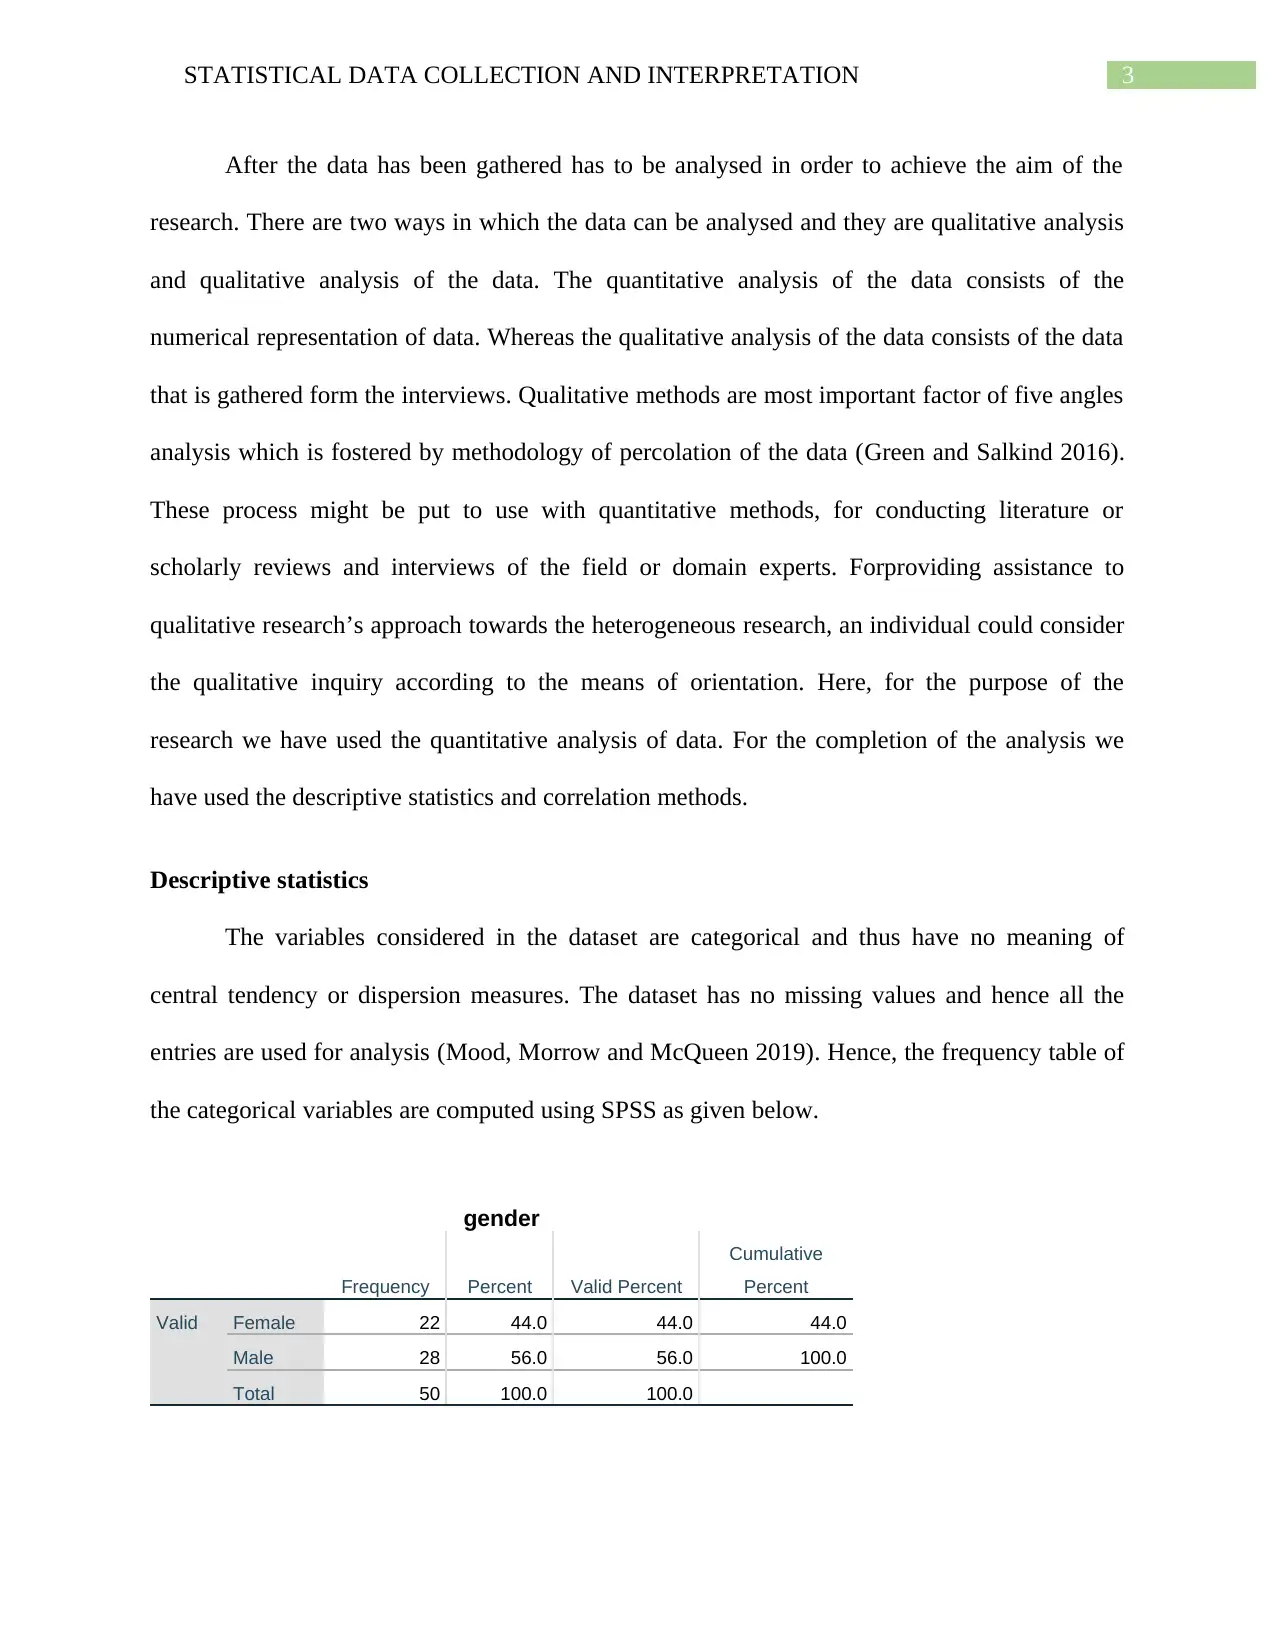
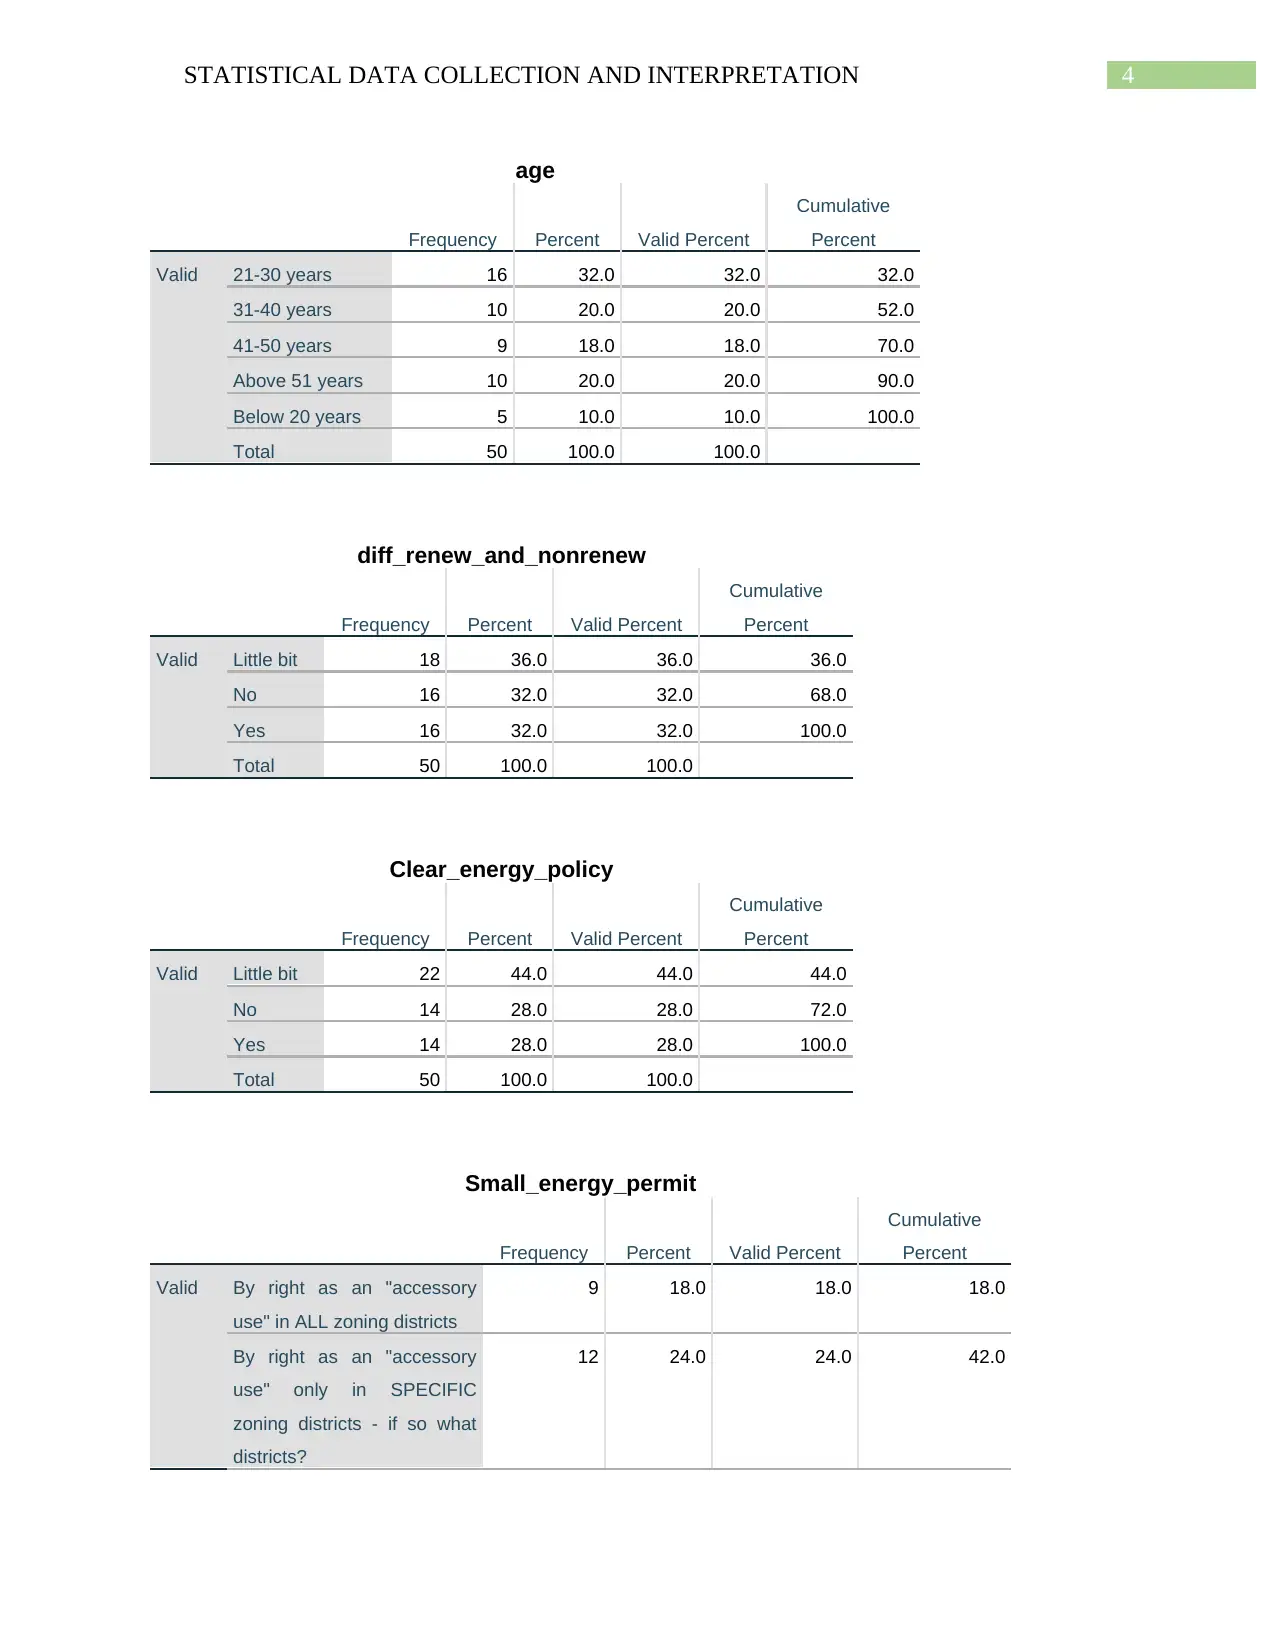
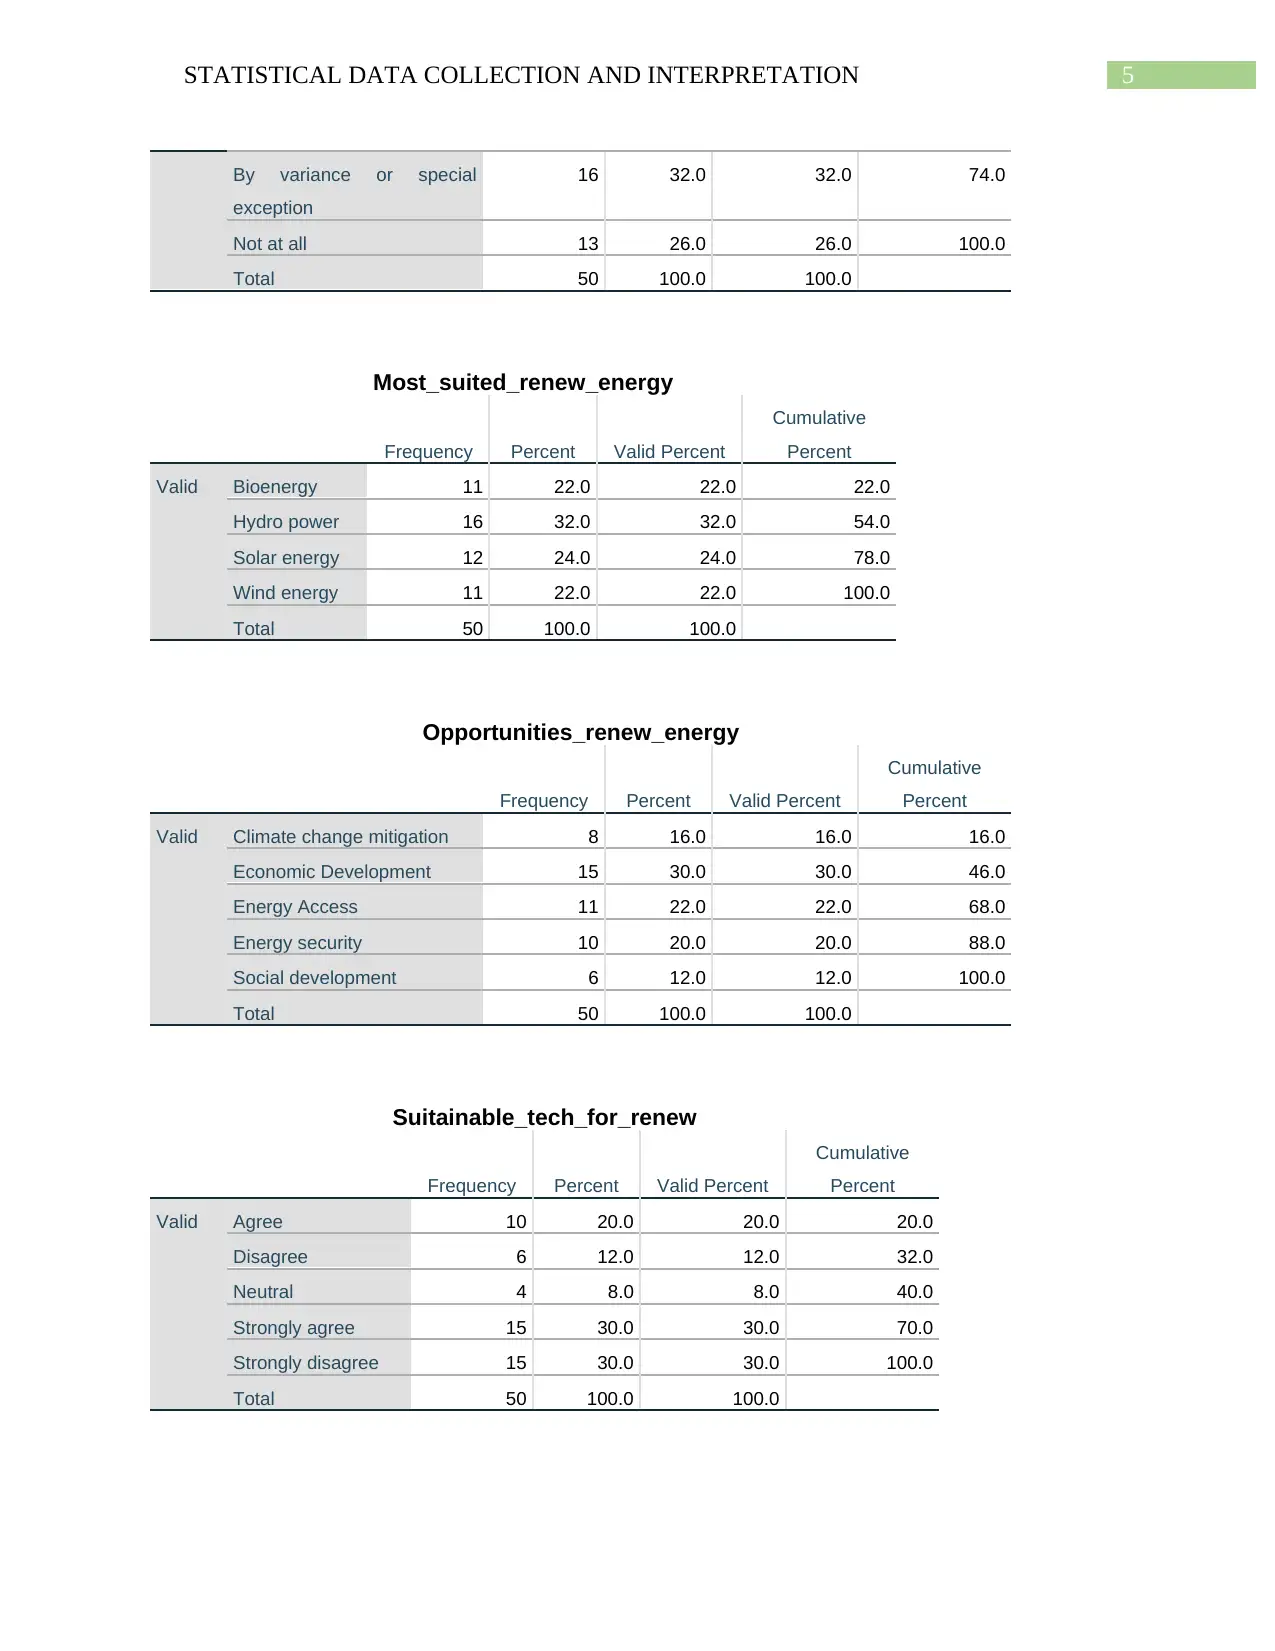
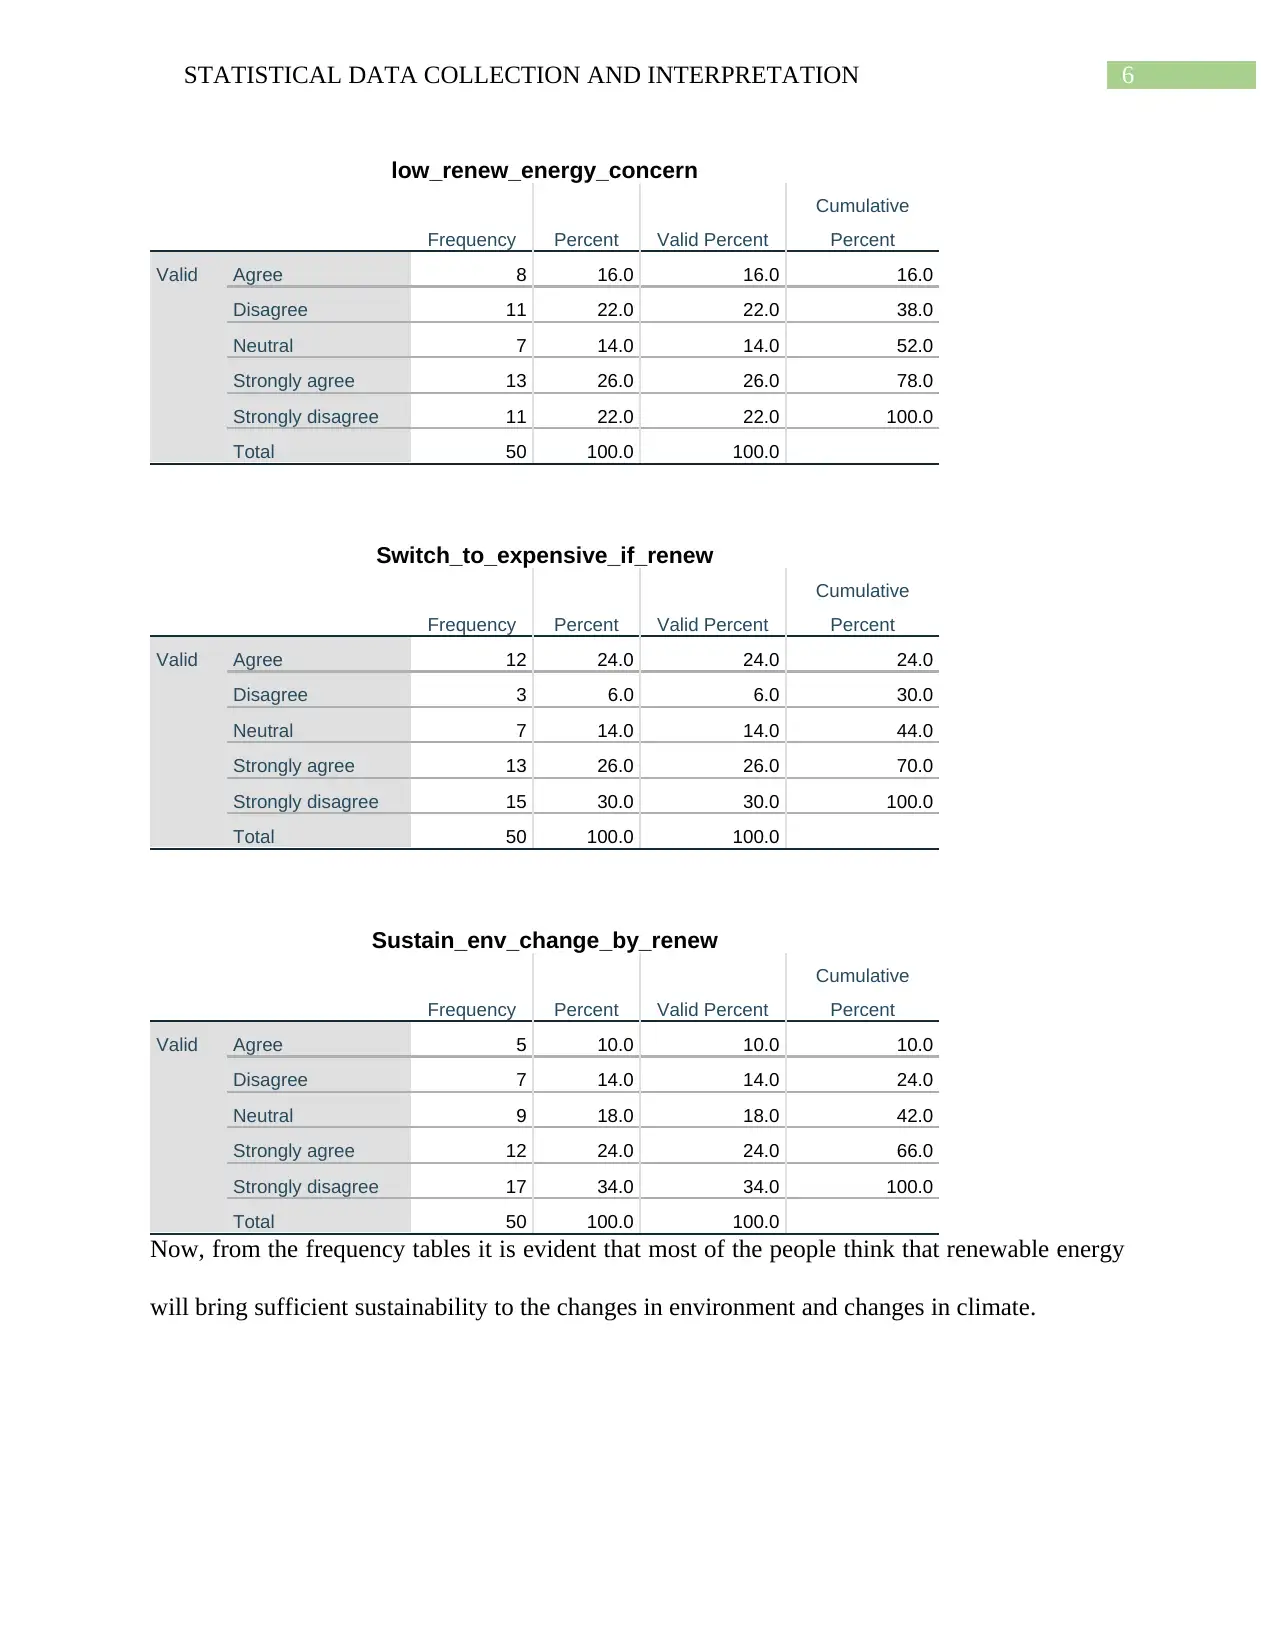
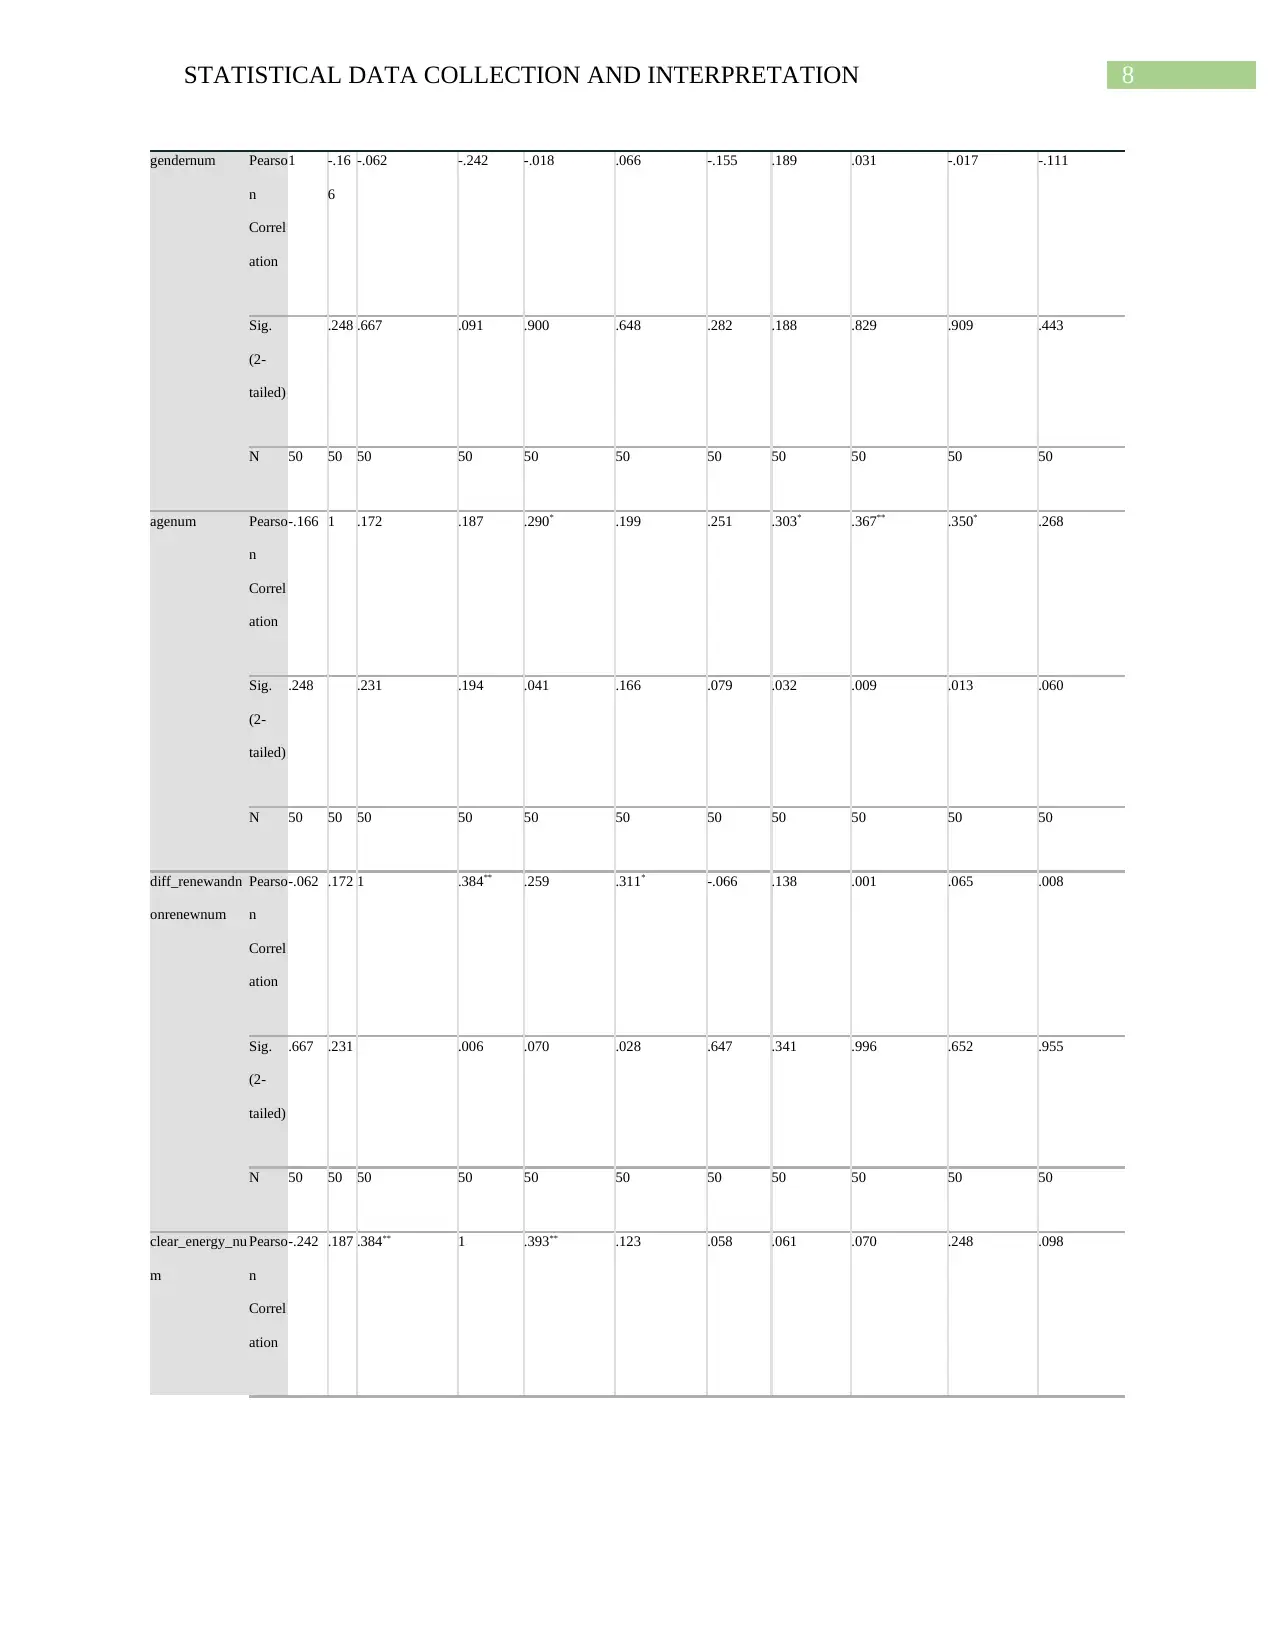
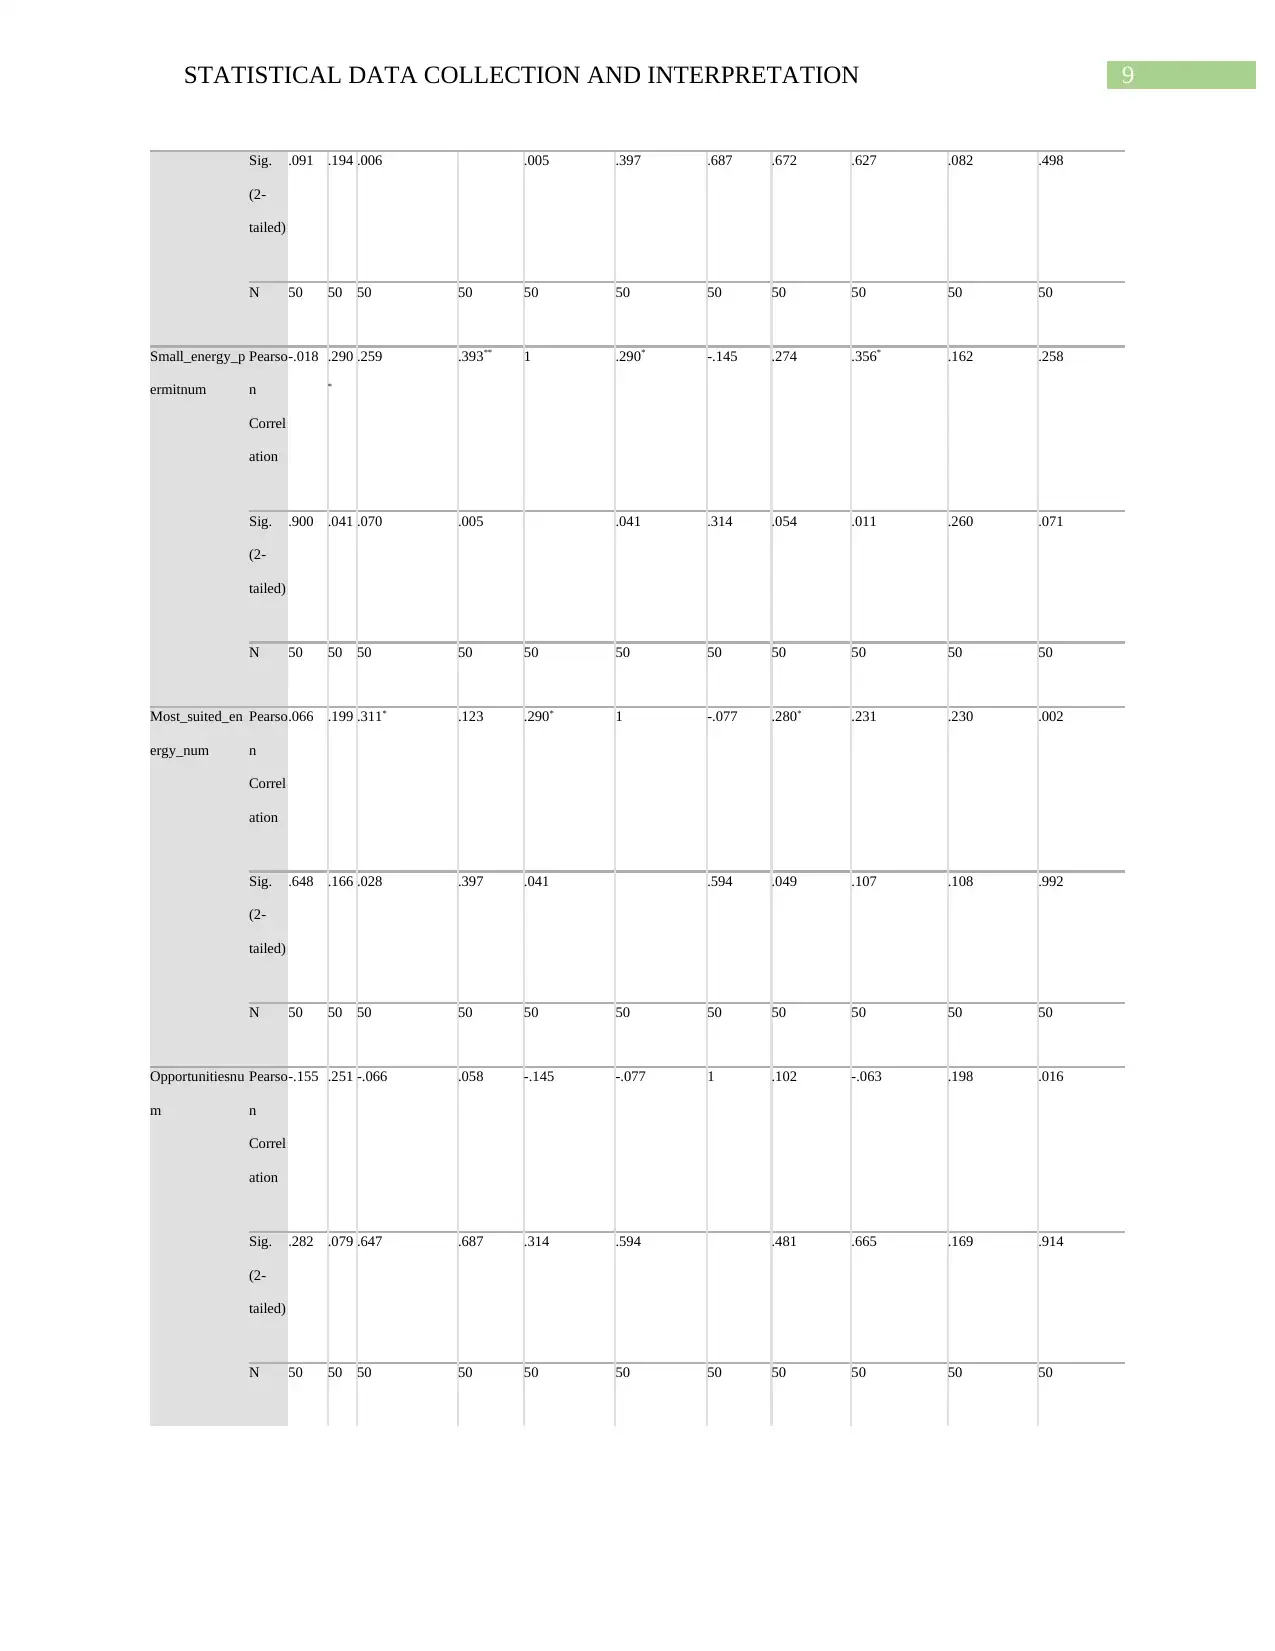
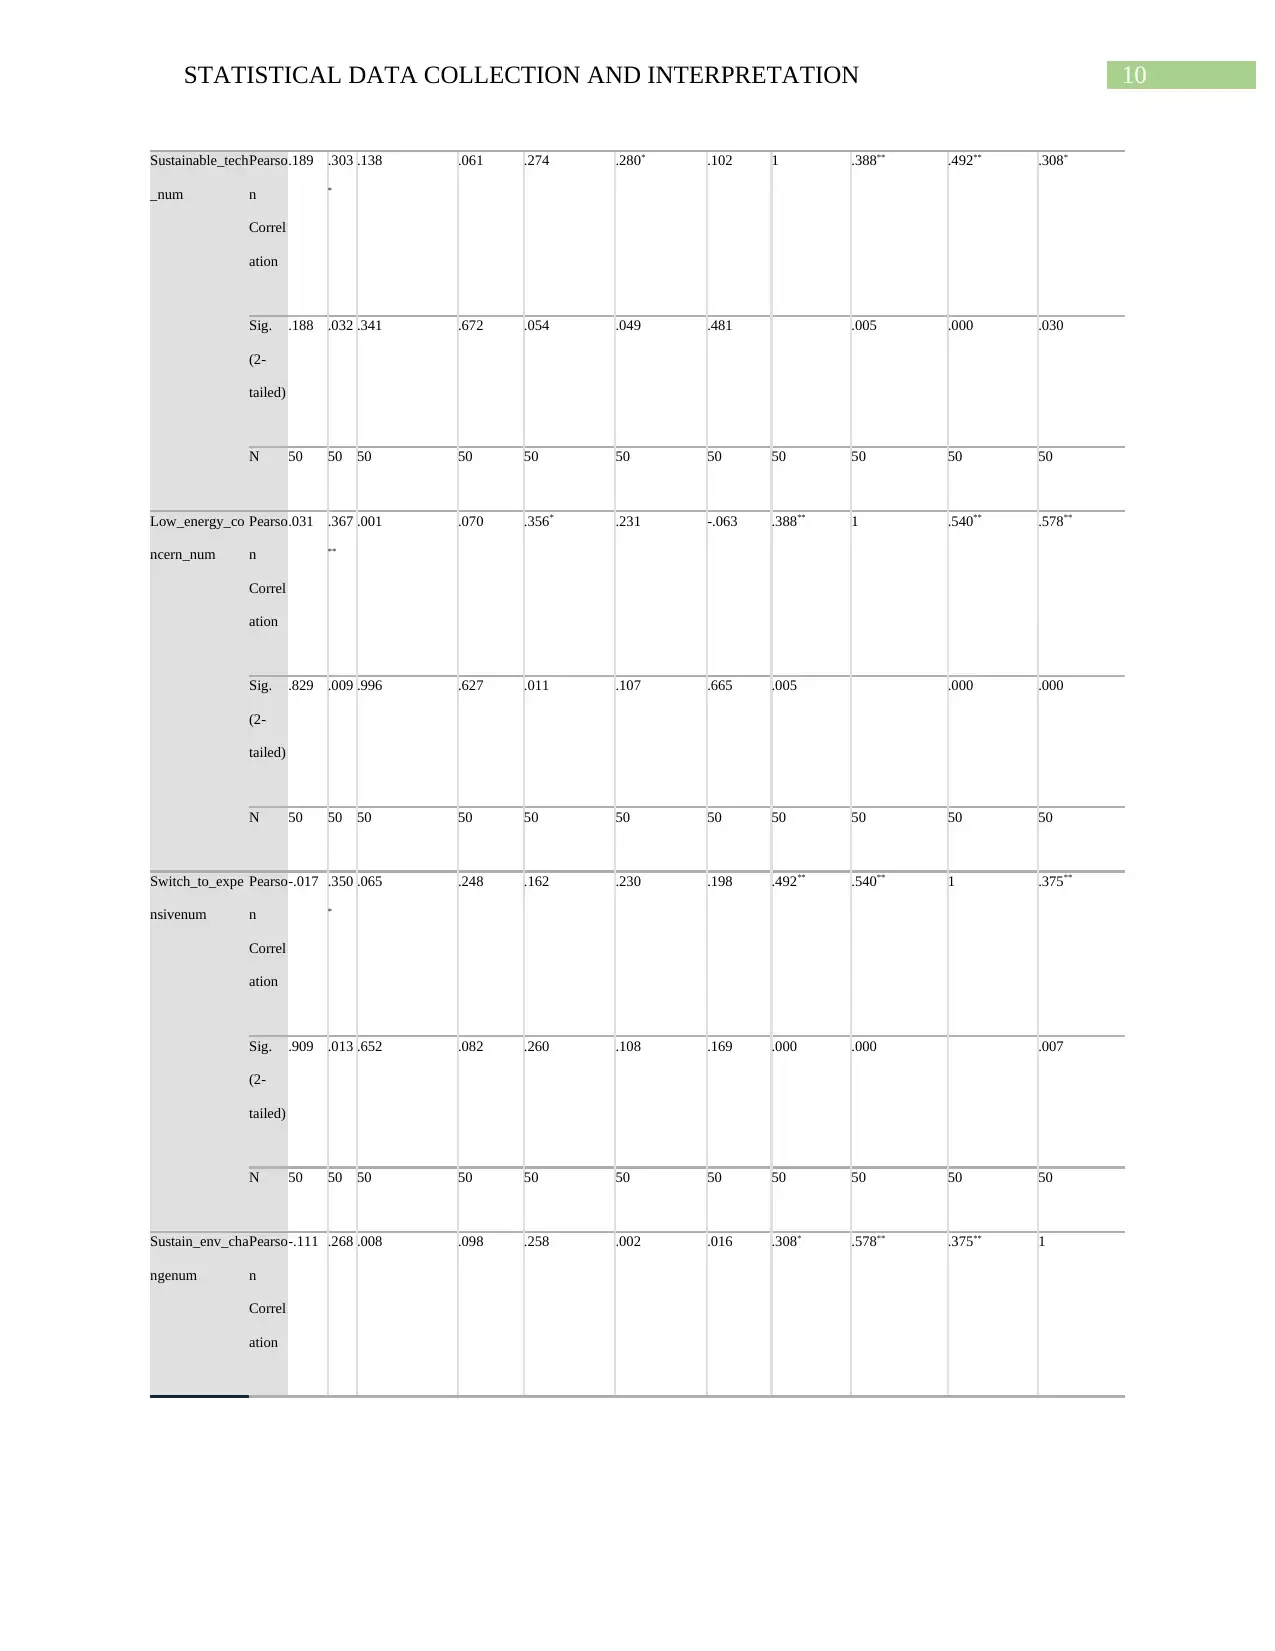
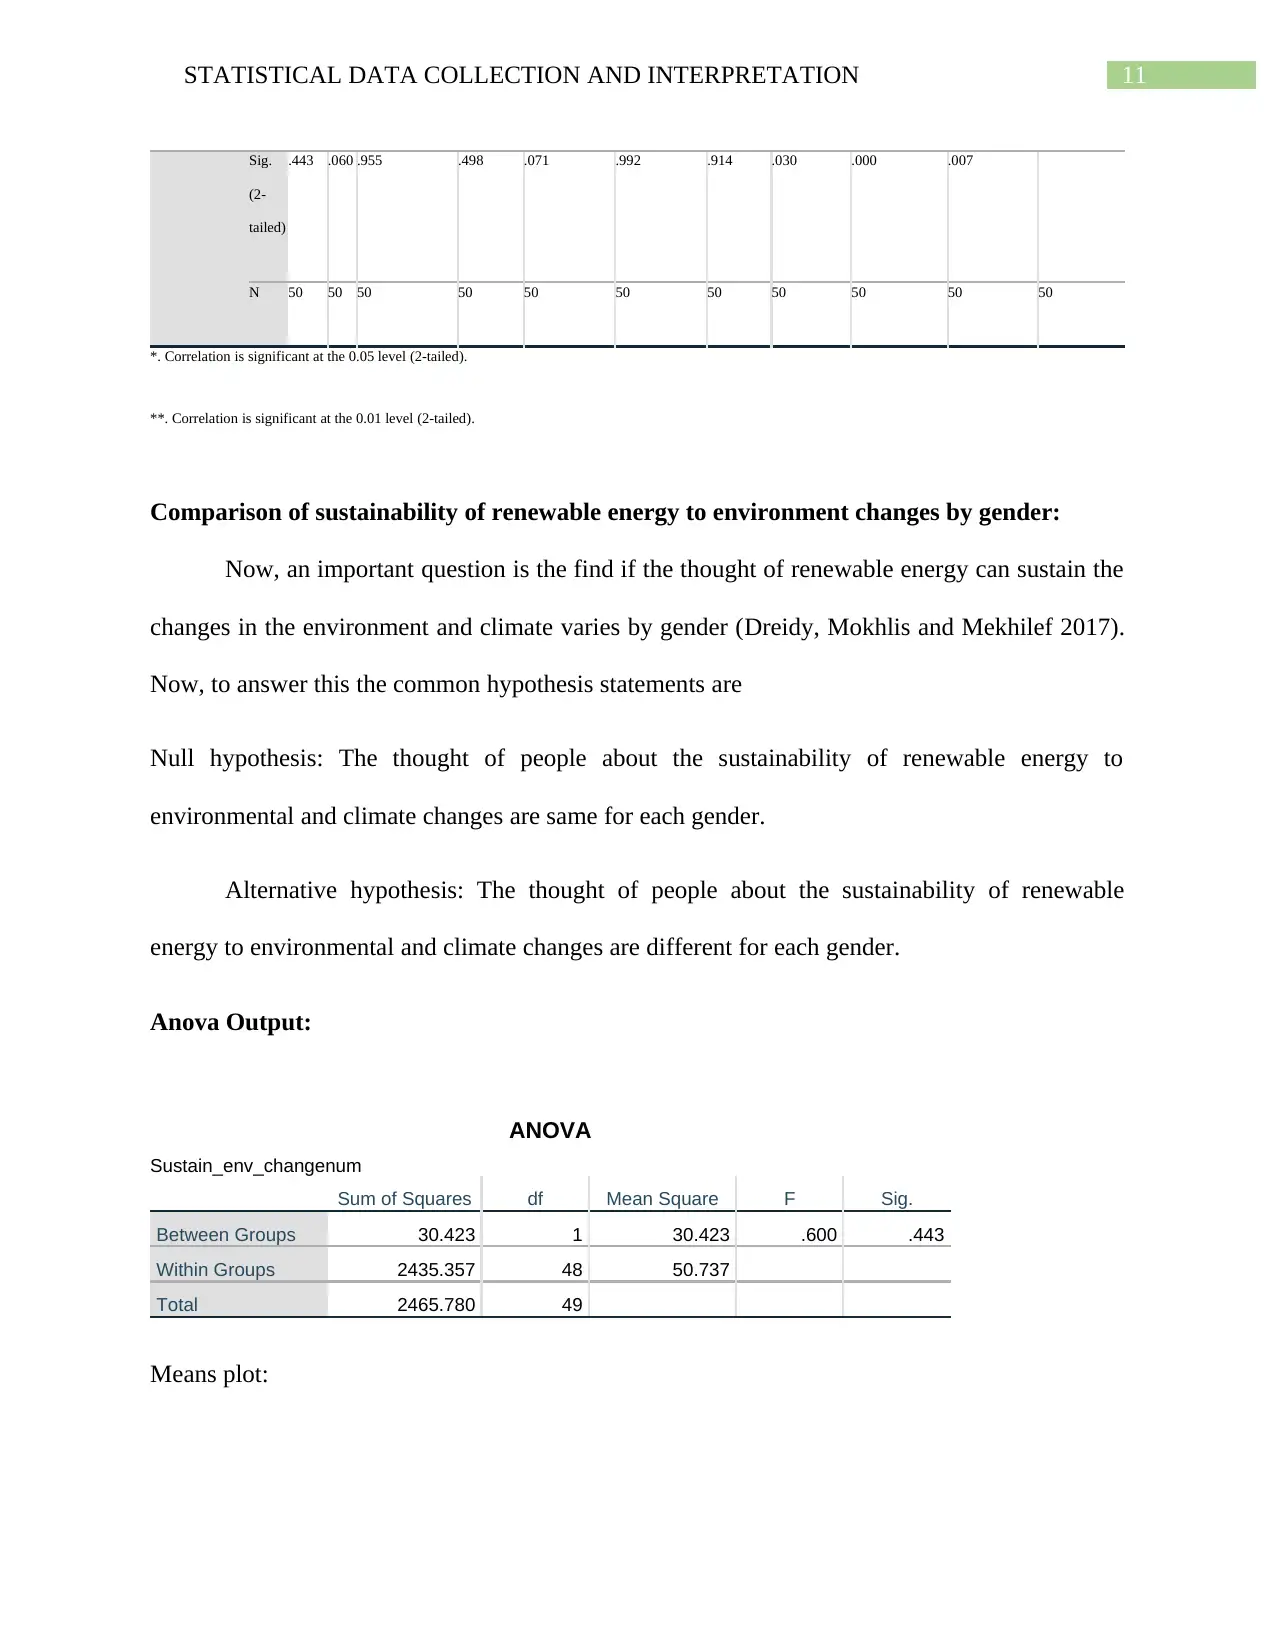
This report presents a statistical analysis of data related to renewable energy and its impact on environmental changes. The study begins with an introduction to sustainable engineering and the increasing need for renewable energy sources. It outlines the parameters and sample population used for data collection, which involved a survey of 50 participants using simple random and non-probability techniques. The report details the data collection methods, focusing on primary data gathered through surveys using Google Forms, and highlights the distinction between qualitative and quantitative data analysis. The core of the analysis involves descriptive statistics, including frequency tables for categorical variables such as gender, age, and opinions on renewable energy. Correlation analysis is performed using Pearson's correlation to identify relationships between variables, with significant correlations indicated. The report further investigates whether opinions on renewable energy sustainability vary by gender using ANOVA. The results indicate no significant difference in opinions between genders. The discussion section emphasizes the importance of bioenergy within sustainable engineering and the environmental benefits of renewable energy over non-renewable sources. The report concludes with a summary of findings and references supporting the analysis.

Running head: STATISTICAL DATA COLLECTION AND INTERPRETATION
STATISTICAL DATA COLLECTION AND INTERPRETATION
Name of the student:
Name of the University:
Author note
STATISTICAL DATA COLLECTION AND INTERPRETATION
Name of the student:
Name of the University:
Author note
Paraphrase This Document
Need a fresh take? Get an instant paraphrase of this document with our AI Paraphraser

1STATISTICAL DATA COLLECTION AND INTERPRETATION
Table of Contents
Introduction:....................................................................................................................................2
Parameters and the sample population:...........................................................................................2
Collected data:.................................................................................................................................2
Descriptive statistics........................................................................................................................3
Correlation.......................................................................................................................................7
Comparison of sustainability of renewable energy to environment changes by gender:..............10
Results discussion:.........................................................................................................................12
Conclusion:....................................................................................................................................14
References......................................................................................................................................16

2STATISTICAL DATA COLLECTION AND INTERPRETATION
Introduction:
With the development of the industry, the need and the consumption of the energy has
increased as well. This has led to the over usage of the natural resources. Thus the sustainable
engineering is the solution to this problem. With the development of the sustainable engineering
the problems related to the depletion of the natural resources is prevented. According to the
analysis, with the appropriate usage of the technology a huge amount of energy can be drawn
from the renewable sources of energy. In this part of the assignment, we will discuss about the
analysis of the data that has been gathered. Different methods have been undertaken for the
purpose of the data analysis and has been discussed in the sections below.
Parameters and the sample population:
For the purpose of the analysis of the data, the population was 200 participant for better
results in the analysis we have used simple,random, and non-probability techniques have been
applied. Therefore the sample size for the research has been taken to be fifty.
Collected data:
There are two ways in which the data can be collected, one is the primary way of
collecting data and the other is the secondary data collection method. For the collection of the
primary data, surveys are undertaken. The primary data are generally collected form the people
who have expertise in the same field and is accurate most of the time (George and Mallery
2016). The secondary data are however collected form the sources like books, articles and
internet whose validity cannot be ensured. For this research we have taken the primary data
under consideration. The primary data that has been gathered for the purpose of this researches
and is done with the help of survey. Google form has been used for the purpose of the survey.
⊘ This is a preview!⊘
Do you want full access?
Subscribe today to unlock all pages.

Trusted by 1+ million students worldwide

3STATISTICAL DATA COLLECTION AND INTERPRETATION
After the data has been gathered has to be analysed in order to achieve the aim of the
research. There are two ways in which the data can be analysed and they are qualitative analysis
and qualitative analysis of the data. The quantitative analysis of the data consists of the
numerical representation of data. Whereas the qualitative analysis of the data consists of the data
that is gathered form the interviews. Qualitative methods are most important factor of five angles
analysis which is fostered by methodology of percolation of the data (Green and Salkind 2016).
These process might be put to use with quantitative methods, for conducting literature or
scholarly reviews and interviews of the field or domain experts. Forproviding assistance to
qualitative research’s approach towards the heterogeneous research, an individual could consider
the qualitative inquiry according to the means of orientation. Here, for the purpose of the
research we have used the quantitative analysis of data. For the completion of the analysis we
have used the descriptive statistics and correlation methods.
Descriptive statistics
The variables considered in the dataset are categorical and thus have no meaning of
central tendency or dispersion measures. The dataset has no missing values and hence all the
entries are used for analysis (Mood, Morrow and McQueen 2019). Hence, the frequency table of
the categorical variables are computed using SPSS as given below.
gender
Frequency Percent Valid Percent
Cumulative
Percent
Valid Female 22 44.0 44.0 44.0
Male 28 56.0 56.0 100.0
Total 50 100.0 100.0
Paraphrase This Document
Need a fresh take? Get an instant paraphrase of this document with our AI Paraphraser

4STATISTICAL DATA COLLECTION AND INTERPRETATION
age
Frequency Percent Valid Percent
Cumulative
Percent
Valid 21-30 years 16 32.0 32.0 32.0
31-40 years 10 20.0 20.0 52.0
41-50 years 9 18.0 18.0 70.0
Above 51 years 10 20.0 20.0 90.0
Below 20 years 5 10.0 10.0 100.0
Total 50 100.0 100.0
diff_renew_and_nonrenew
Frequency Percent Valid Percent
Cumulative
Percent
Valid Little bit 18 36.0 36.0 36.0
No 16 32.0 32.0 68.0
Yes 16 32.0 32.0 100.0
Total 50 100.0 100.0
Clear_energy_policy
Frequency Percent Valid Percent
Cumulative
Percent
Valid Little bit 22 44.0 44.0 44.0
No 14 28.0 28.0 72.0
Yes 14 28.0 28.0 100.0
Total 50 100.0 100.0
Small_energy_permit
Frequency Percent Valid Percent
Cumulative
Percent
Valid By right as an "accessory
use" in ALL zoning districts
9 18.0 18.0 18.0
By right as an "accessory
use" only in SPECIFIC
zoning districts - if so what
districts?
12 24.0 24.0 42.0

5STATISTICAL DATA COLLECTION AND INTERPRETATION
By variance or special
exception
16 32.0 32.0 74.0
Not at all 13 26.0 26.0 100.0
Total 50 100.0 100.0
Most_suited_renew_energy
Frequency Percent Valid Percent
Cumulative
Percent
Valid Bioenergy 11 22.0 22.0 22.0
Hydro power 16 32.0 32.0 54.0
Solar energy 12 24.0 24.0 78.0
Wind energy 11 22.0 22.0 100.0
Total 50 100.0 100.0
Opportunities_renew_energy
Frequency Percent Valid Percent
Cumulative
Percent
Valid Climate change mitigation 8 16.0 16.0 16.0
Economic Development 15 30.0 30.0 46.0
Energy Access 11 22.0 22.0 68.0
Energy security 10 20.0 20.0 88.0
Social development 6 12.0 12.0 100.0
Total 50 100.0 100.0
Suitainable_tech_for_renew
Frequency Percent Valid Percent
Cumulative
Percent
Valid Agree 10 20.0 20.0 20.0
Disagree 6 12.0 12.0 32.0
Neutral 4 8.0 8.0 40.0
Strongly agree 15 30.0 30.0 70.0
Strongly disagree 15 30.0 30.0 100.0
Total 50 100.0 100.0
⊘ This is a preview!⊘
Do you want full access?
Subscribe today to unlock all pages.

Trusted by 1+ million students worldwide

6STATISTICAL DATA COLLECTION AND INTERPRETATION
low_renew_energy_concern
Frequency Percent Valid Percent
Cumulative
Percent
Valid Agree 8 16.0 16.0 16.0
Disagree 11 22.0 22.0 38.0
Neutral 7 14.0 14.0 52.0
Strongly agree 13 26.0 26.0 78.0
Strongly disagree 11 22.0 22.0 100.0
Total 50 100.0 100.0
Switch_to_expensive_if_renew
Frequency Percent Valid Percent
Cumulative
Percent
Valid Agree 12 24.0 24.0 24.0
Disagree 3 6.0 6.0 30.0
Neutral 7 14.0 14.0 44.0
Strongly agree 13 26.0 26.0 70.0
Strongly disagree 15 30.0 30.0 100.0
Total 50 100.0 100.0
Sustain_env_change_by_renew
Frequency Percent Valid Percent
Cumulative
Percent
Valid Agree 5 10.0 10.0 10.0
Disagree 7 14.0 14.0 24.0
Neutral 9 18.0 18.0 42.0
Strongly agree 12 24.0 24.0 66.0
Strongly disagree 17 34.0 34.0 100.0
Total 50 100.0 100.0
Now, from the frequency tables it is evident that most of the people think that renewable energy
will bring sufficient sustainability to the changes in environment and changes in climate.
Paraphrase This Document
Need a fresh take? Get an instant paraphrase of this document with our AI Paraphraser

7STATISTICAL DATA COLLECTION AND INTERPRETATION
Correlation
Now, for calculating the correlation between the variables all the categorical variable are
converted to numeric by using the automatic recoding scheme in SPSS (Opie 2019). The
recoding of the variables are given under values property of the corresponding variable. Now, the
Pearson’s correlation between the variables are computed in SPSS and represented in Matrix
form. The Pearson’s correlation coefficient between two variables x and y is given by
R_xy = Cov(x,y)/(Sx*Sy)
Where, Cov(x,y) = covariance between x and y
Sx = standard deviation of x
Sy = standard deviation of y
The correlation coefficient always lies in the range [-1,1] and indicates the strength of
relationship between the variables. Hence, positive value of correlation coefficient indicates the
increase in one variable has an effect of increase in other variable (Sivam et al 2018). However,
the negative value of correlation coefficient indicates increase in one variable causes the
decrease in other.
The significant correlations are identified in ‘*’ and ‘**’ symbols for 5% significance and
1% significance respectively. The correlation matrix generated in SPSS shown below.
Correlations
gende
rnum
agen
um
diff_renewandno
nrenewnum
clear_ener
gy_num
Small_energy_
permitnum
Most_suited_e
nergy_num
Opportunit
iesnum
Sustainable_t
ech_num
Low_energy_co
ncern_num
Switch_to_exp
ensivenum
Sustain_env_c
hangenum

8STATISTICAL DATA COLLECTION AND INTERPRETATION
gendernum Pearso
n
Correl
ation
1 -.16
6
-.062 -.242 -.018 .066 -.155 .189 .031 -.017 -.111
Sig.
(2-
tailed)
.248 .667 .091 .900 .648 .282 .188 .829 .909 .443
N 50 50 50 50 50 50 50 50 50 50 50
agenum Pearso
n
Correl
ation
-.166 1 .172 .187 .290* .199 .251 .303* .367** .350* .268
Sig.
(2-
tailed)
.248 .231 .194 .041 .166 .079 .032 .009 .013 .060
N 50 50 50 50 50 50 50 50 50 50 50
diff_renewandn
onrenewnum
Pearso
n
Correl
ation
-.062 .172 1 .384** .259 .311* -.066 .138 .001 .065 .008
Sig.
(2-
tailed)
.667 .231 .006 .070 .028 .647 .341 .996 .652 .955
N 50 50 50 50 50 50 50 50 50 50 50
clear_energy_nu
m
Pearso
n
Correl
ation
-.242 .187 .384** 1 .393** .123 .058 .061 .070 .248 .098
⊘ This is a preview!⊘
Do you want full access?
Subscribe today to unlock all pages.

Trusted by 1+ million students worldwide

9STATISTICAL DATA COLLECTION AND INTERPRETATION
Sig.
(2-
tailed)
.091 .194 .006 .005 .397 .687 .672 .627 .082 .498
N 50 50 50 50 50 50 50 50 50 50 50
Small_energy_p
ermitnum
Pearso
n
Correl
ation
-.018 .290
*
.259 .393** 1 .290* -.145 .274 .356* .162 .258
Sig.
(2-
tailed)
.900 .041 .070 .005 .041 .314 .054 .011 .260 .071
N 50 50 50 50 50 50 50 50 50 50 50
Most_suited_en
ergy_num
Pearso
n
Correl
ation
.066 .199 .311* .123 .290* 1 -.077 .280* .231 .230 .002
Sig.
(2-
tailed)
.648 .166 .028 .397 .041 .594 .049 .107 .108 .992
N 50 50 50 50 50 50 50 50 50 50 50
Opportunitiesnu
m
Pearso
n
Correl
ation
-.155 .251 -.066 .058 -.145 -.077 1 .102 -.063 .198 .016
Sig.
(2-
tailed)
.282 .079 .647 .687 .314 .594 .481 .665 .169 .914
N 50 50 50 50 50 50 50 50 50 50 50
Sig.
(2-
tailed)
.091 .194 .006 .005 .397 .687 .672 .627 .082 .498
N 50 50 50 50 50 50 50 50 50 50 50
Small_energy_p
ermitnum
Pearso
n
Correl
ation
-.018 .290
*
.259 .393** 1 .290* -.145 .274 .356* .162 .258
Sig.
(2-
tailed)
.900 .041 .070 .005 .041 .314 .054 .011 .260 .071
N 50 50 50 50 50 50 50 50 50 50 50
Most_suited_en
ergy_num
Pearso
n
Correl
ation
.066 .199 .311* .123 .290* 1 -.077 .280* .231 .230 .002
Sig.
(2-
tailed)
.648 .166 .028 .397 .041 .594 .049 .107 .108 .992
N 50 50 50 50 50 50 50 50 50 50 50
Opportunitiesnu
m
Pearso
n
Correl
ation
-.155 .251 -.066 .058 -.145 -.077 1 .102 -.063 .198 .016
Sig.
(2-
tailed)
.282 .079 .647 .687 .314 .594 .481 .665 .169 .914
N 50 50 50 50 50 50 50 50 50 50 50
Paraphrase This Document
Need a fresh take? Get an instant paraphrase of this document with our AI Paraphraser

10STATISTICAL DATA COLLECTION AND INTERPRETATION
Sustainable_tech
_num
Pearso
n
Correl
ation
.189 .303
*
.138 .061 .274 .280* .102 1 .388** .492** .308*
Sig.
(2-
tailed)
.188 .032 .341 .672 .054 .049 .481 .005 .000 .030
N 50 50 50 50 50 50 50 50 50 50 50
Low_energy_co
ncern_num
Pearso
n
Correl
ation
.031 .367
**
.001 .070 .356* .231 -.063 .388** 1 .540** .578**
Sig.
(2-
tailed)
.829 .009 .996 .627 .011 .107 .665 .005 .000 .000
N 50 50 50 50 50 50 50 50 50 50 50
Switch_to_expe
nsivenum
Pearso
n
Correl
ation
-.017 .350
*
.065 .248 .162 .230 .198 .492** .540** 1 .375**
Sig.
(2-
tailed)
.909 .013 .652 .082 .260 .108 .169 .000 .000 .007
N 50 50 50 50 50 50 50 50 50 50 50
Sustain_env_cha
ngenum
Pearso
n
Correl
ation
-.111 .268 .008 .098 .258 .002 .016 .308* .578** .375** 1

11STATISTICAL DATA COLLECTION AND INTERPRETATION
Sig.
(2-
tailed)
.443 .060 .955 .498 .071 .992 .914 .030 .000 .007
N 50 50 50 50 50 50 50 50 50 50 50
*. Correlation is significant at the 0.05 level (2-tailed).
**. Correlation is significant at the 0.01 level (2-tailed).
Comparison of sustainability of renewable energy to environment changes by gender:
Now, an important question is the find if the thought of renewable energy can sustain the
changes in the environment and climate varies by gender (Dreidy, Mokhlis and Mekhilef 2017).
Now, to answer this the common hypothesis statements are
Null hypothesis: The thought of people about the sustainability of renewable energy to
environmental and climate changes are same for each gender.
Alternative hypothesis: The thought of people about the sustainability of renewable
energy to environmental and climate changes are different for each gender.
Anova Output:
ANOVA
Sustain_env_changenum
Sum of Squares df Mean Square F Sig.
Between Groups 30.423 1 30.423 .600 .443
Within Groups 2435.357 48 50.737
Total 2465.780 49
Means plot:
⊘ This is a preview!⊘
Do you want full access?
Subscribe today to unlock all pages.

Trusted by 1+ million students worldwide
1 out of 20
Related Documents
Your All-in-One AI-Powered Toolkit for Academic Success.
 +13062052269
info@desklib.com
Available 24*7 on WhatsApp / Email
Unlock your academic potential
Copyright © 2020–2025 A2Z Services. All Rights Reserved. Developed and managed by ZUCOL.


