Renewable Energy Systems 1: Assessment 1, Griffith University, 2019

Verified

Added on Ā 2023/01/05

|10
|1017
|78
Homework Assignment
AI Summary
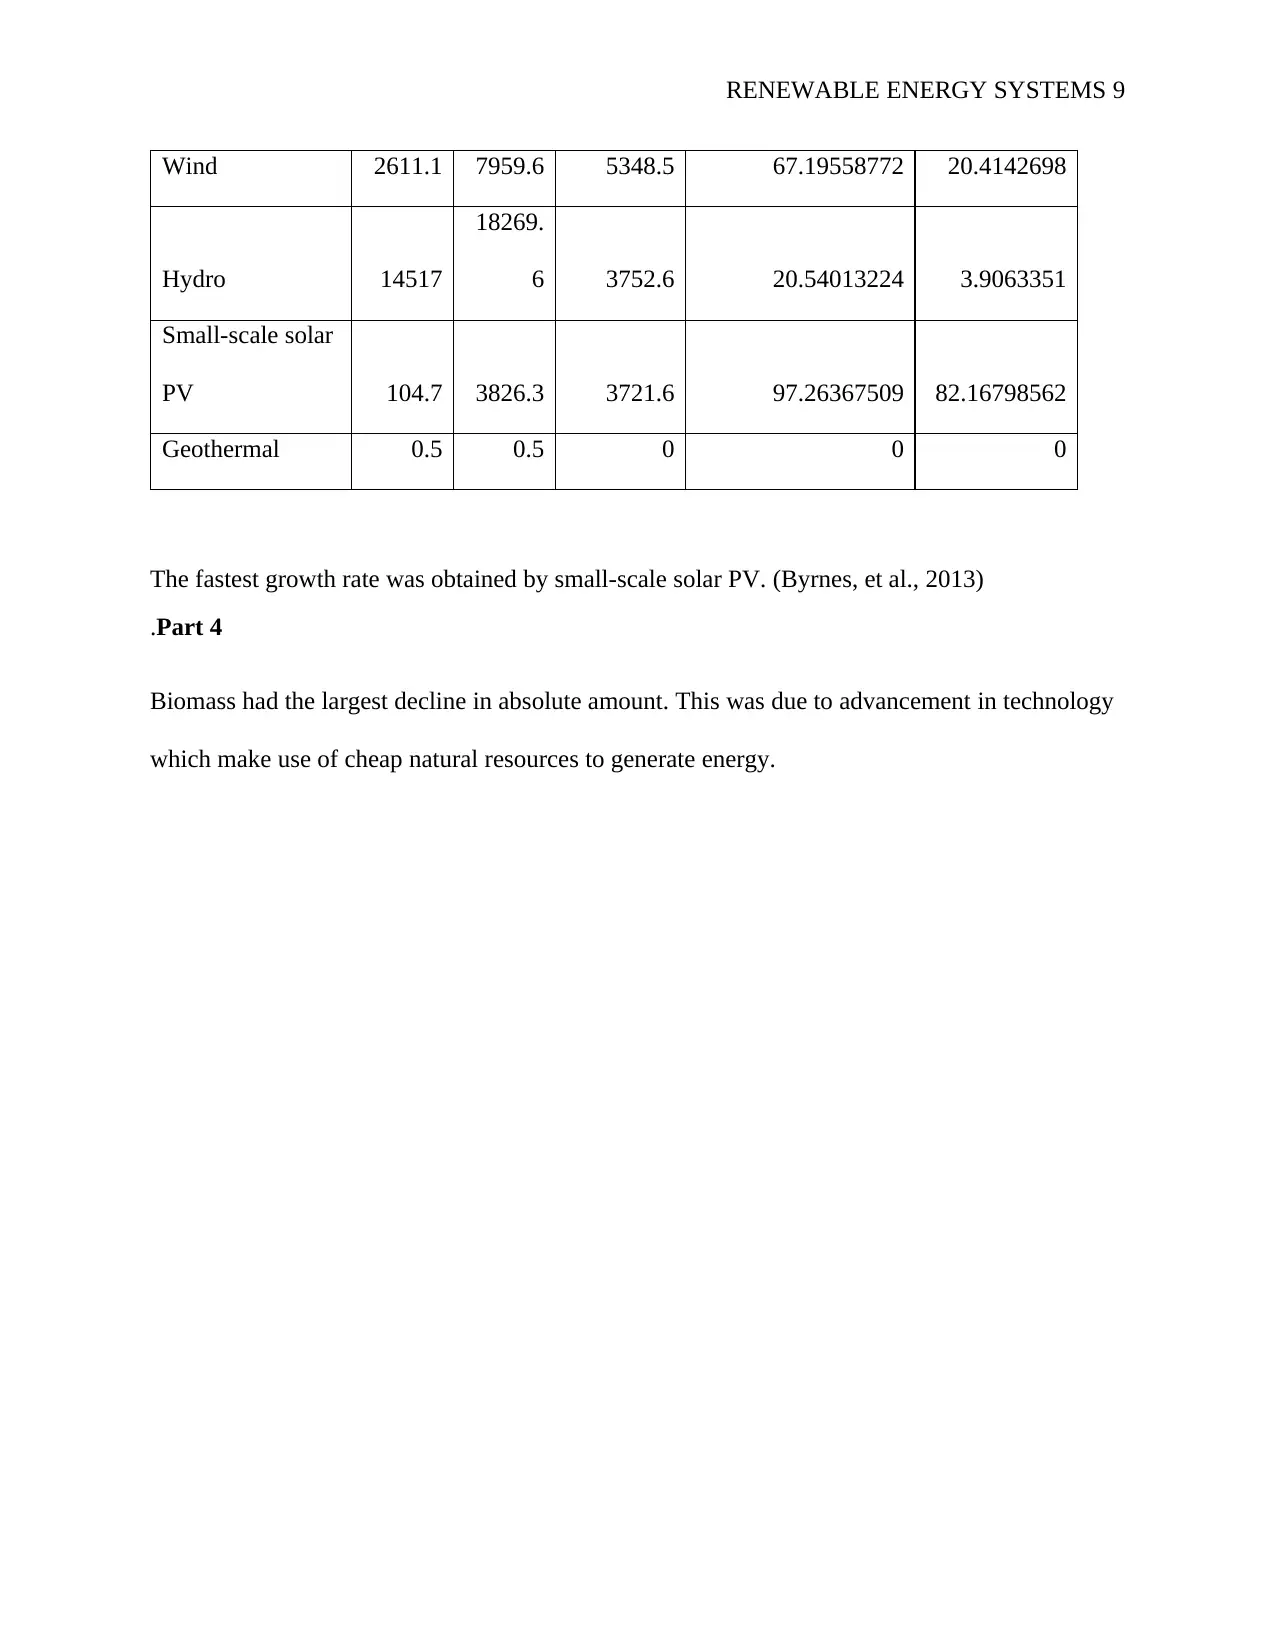
This document presents a comprehensive solution to a Renewable Energy Systems assignment, focusing on the analysis of electricity generation in Australia and solar energy applications. The assignment addresses four key problems: Firstly, it calculates the amount of electricity needed from renewable resources by 2020/21, considering growth rates and targets. Secondly, it proposes a mix of renewable energy resources to meet the demand, detailing the contribution of each source like hydro, wind, bioenergy, and solar PV. The third problem involves analyzing solar hot water systems, including graphing collector efficiency, determining heat transfer coefficients, and calculating useful energy gain and stagnation temperature. Finally, the assignment explores sun path diagrams, shading diagrams, and the hours of sunlight for different seasons, along with an analysis of energy resource trends and growth rates. The solution includes calculations, graphs, and discussions based on provided data and references.
Document Page
RENEWABLE ENERGY SYSTEMS 1
RENEWABLE ENERGY SYSTEMS1
By (Firstname Lastname)
Renewable Energy Systems1
Assessment 1
Professor
Griffith University
September 1, 2019
tabler-icon-diamond-filled.svg

Paraphrase This Document

Need a fresh take? Get an instant paraphrase of this document with our AI Paraphraser
Document Page
RENEWABLE ENERGY SYSTEMS 2
Problem 1: Renewable Energy and Australia’s Electricity Generation (Zahedi, 2010)
Total amount of electricity generated 2015/2016 Āæ 257.4 TWh
Percentage from renewable energy 2015/2016 Āæ 14.8 %
2020/2021 target Āæ 20 % from renewable energy resources.
Annual growth rate Āæ 2.5 %
Part 1
Total amount in 2015/2016 Āæ 257.4 TWh
Total amount produced by renewable energy resources in 2015/2016
Āæ 14.8 %āˆ—257.4=38.0952TWh
Growth rate Āæ 2.5 %
Total energy from renewable resources in 2020/2021 = Āæ 38.0952 (1+ 0.025 )5=43.101 TWh
Equating the projection to the target, we have;
If 14.8 %=43.101 TWh
20 %=?
Āæ 43.101āˆ—20 %
14.8 %
Āæ 58.245 TWh
Thus, the amount of electricity to be generated from renewable resources in 2020/2021 will be
58.245 TWh.
Document Page
RENEWABLE ENERGY SYSTEMS 3
Part 2
Assume that the rate of growth of energy production is equal for all energy resources.
From table 4.2, total amount of energy from renewables = 38146 GWh.
Mix and their percentage contribution will be;
i) Hydro
Contribution Āæ 15318
38146āˆ—100 %=40.156 %
ii) Wind
Contribution Āæ 12199
38146āˆ—100 %=31.980 %
iii) Bioenergy
Contribution Āæ 3790
38146āˆ—100 %=9.936 %
iv) Solar PV
Contribution Āæ 6838
38146āˆ—100 %=14.926 %
Part 3
i) Hydro
Capacity Āæ 40.156 %āˆ—58.245=23.389 TWh
ii) Wind
Capacity Āæ 31.980 %āˆ—58.245=18.627 TWh
iii) Bioenergy
Capacity Āæ 9.936 %āˆ—58.245=5.7872TWh
iv) Solar PV
Document Page
RENEWABLE ENERGY SYSTEMS 4
Capacity Āæ 14.926 %āˆ—58.245=8.694 TWh
Problem 2: Solar Hot Water
Part 1
We draw a graph as shown below.
0.22 0.275 0.312 0.4 0.415 0.455 0.512 0.58 0.615 0.679 0.71 0.72
0
0.01
0.02
0.03
0.04
0.05
0.06
0.07
0.08
0.09
(Ti-Ta)/G (Km^2/W)
Collector efficiency
tabler-icon-diamond-filled.svg

Paraphrase This Document

Need a fresh take? Get an instant paraphrase of this document with our AI Paraphraser
Document Page
RENEWABLE ENERGY SYSTEMS 5
The gradient of the graph is -6.667. The value of gradient is equal to āˆ’FR U L.
FR U L=6.667
Efficiency Ī·=FR τα āˆ’F R U L (T iāˆ’T a
G )
Taking values in the first row in table and substituting back; we get;
0.72=F R ( 0.97 ) ( 0.92 ) āˆ’( 6.667)(0.014)
FR =0.911
Part 2
Overall heat transfer coefficient U L=6.667
FR
Āæ 6.667
0.911 =7.318 W /m2 K
Part 3
Useful energy gain Qu=FR A [ GĻ„Ī±āˆ’U L ( T iāˆ’T a ) ]
Substituting the values;
Qu= ( 0.911 ) ( 3.96 ) [ ( 750 ) ( 0.97 ) ( 0.92 )āˆ’ ( 7.318 ) ( 28āˆ’15 ) ]
Āæ 2071.338 W
Document Page
RENEWABLE ENERGY SYSTEMS 6
Part 4
Stagnation temperature T p=T a + ( τα ) G
U L
Āæ 15+ 0.97āˆ—0.92āˆ—750
7.318 =106.4590 C
Problem 3
Part 1
Sun path diagram for a house located at a latitude 30o 18’ South and longitude 153o 8’ East
(Bahadori & Nwaoha, 2013)
Part 2
Constructing a shading diagram on your sun path diagram
Document Page
RENEWABLE ENERGY SYSTEMS 7
Part 3
Estimating the hours of sunlight and the times of the day when sunlight reaches the
collectors on equinoxes, winter and summer solstice
Equinoxes
Autumn Fall Equinox
Hours of sunlight = 12 hours 18 minutes
Times of the day: 05:36 to 17:44 solar times
Spring/vernal Equinox
Hours of sunlight = 12 hours 7 minutes
Times of the day: 05:52 to 17:59 solar times
Winter Solstice
Hours of sunlight = 10 hours 11 minutes
Times of the day: 06:40 to 16:51 solar times
Summer Solstice
Hours of sunlight = 14 hours 6 minutes
tabler-icon-diamond-filled.svg

Paraphrase This Document

Need a fresh take? Get an instant paraphrase of this document with our AI Paraphraser
Document Page
RENEWABLE ENERGY SYSTEMS 8
Times of the day: 04:46 to 18:52 solar times (Rosario, 2014)
Problem 4
Part 1
Hydro
Part 2
Energy Resource Period
2006/07 2012/13 Difference Percentage change (%)
Biomass 3953 3143.5 -809.5 -25.75155082
Wind 2611.1 7959.6 5348.5 67.19558772
Hydro 14517 18269.6 3752.6 20.54013224
Small-scale solar PV 104.7 3826.3 3721.6 97.26367509
Geothermal 0.5 0.5 0 0
Wind energy had the largest increase in production in terms of absolute values. In terms of
percentage, small-scale solar PV had the largest increase over the period. (Muschaweck &
Spirkl, 2013)
Part 3
Energy
Resource Period
2006/0
7
2012/1
3
Differenc
e
Percentage change
(%)
Growth rate
(%)
Biomass 3953 3143.5 -809.5 -25.75155082 -3.746962921
Document Page
RENEWABLE ENERGY SYSTEMS 9
Wind 2611.1 7959.6 5348.5 67.19558772 20.4142698
Hydro 14517
18269.
6 3752.6 20.54013224 3.9063351
Small-scale solar
PV 104.7 3826.3 3721.6 97.26367509 82.16798562
Geothermal 0.5 0.5 0 0 0
The fastest growth rate was obtained by small-scale solar PV. (Byrnes, et al., 2013)
.Part 4
Biomass had the largest decline in absolute amount. This was due to advancement in technology
which make use of cheap natural resources to generate energy.
Document Page
RENEWABLE ENERGY SYSTEMS 10
References
Bahadori, A. and Nwaoha, C., 2013. A review on solar energy utilisation in Australia.
Renewable and Sustainable Energy Reviews, 18, pp.1-5.
Byrnes, L., Brown, C., Foster, J. and Wagner, L.D., 2013. Australian renewable energy policy:
Barriers and challenges. Renewable Energy, 60, pp.711-721.
Muschaweck, J. and Spirkl, W., 2013. Dynamic solar collector performance testing. Solar
Energy Materials and solar cells, 30(2), pp.95-105.
Rosario, A., 2014. Calculating the Solar Energy of a Flat Plate Collector. Undergraduate
Journal of Mathematical Modeling: One+ Two, 6(1), p.1.
Zahedi, A., 2010. Australian renewable energy progress. Renewable and Sustainable Energy
Reviews, 14(8), pp.2208-2213.
chevron_up_icon
1 out of 10
circle_padding
hide_on_mobile
zoom_out_icon
[object Object]