MSc Renewable Energy Engineering: System Design and Analysis Report

Verified

Added on  2022/10/11

|12
|1988
|6
Report
AI Summary
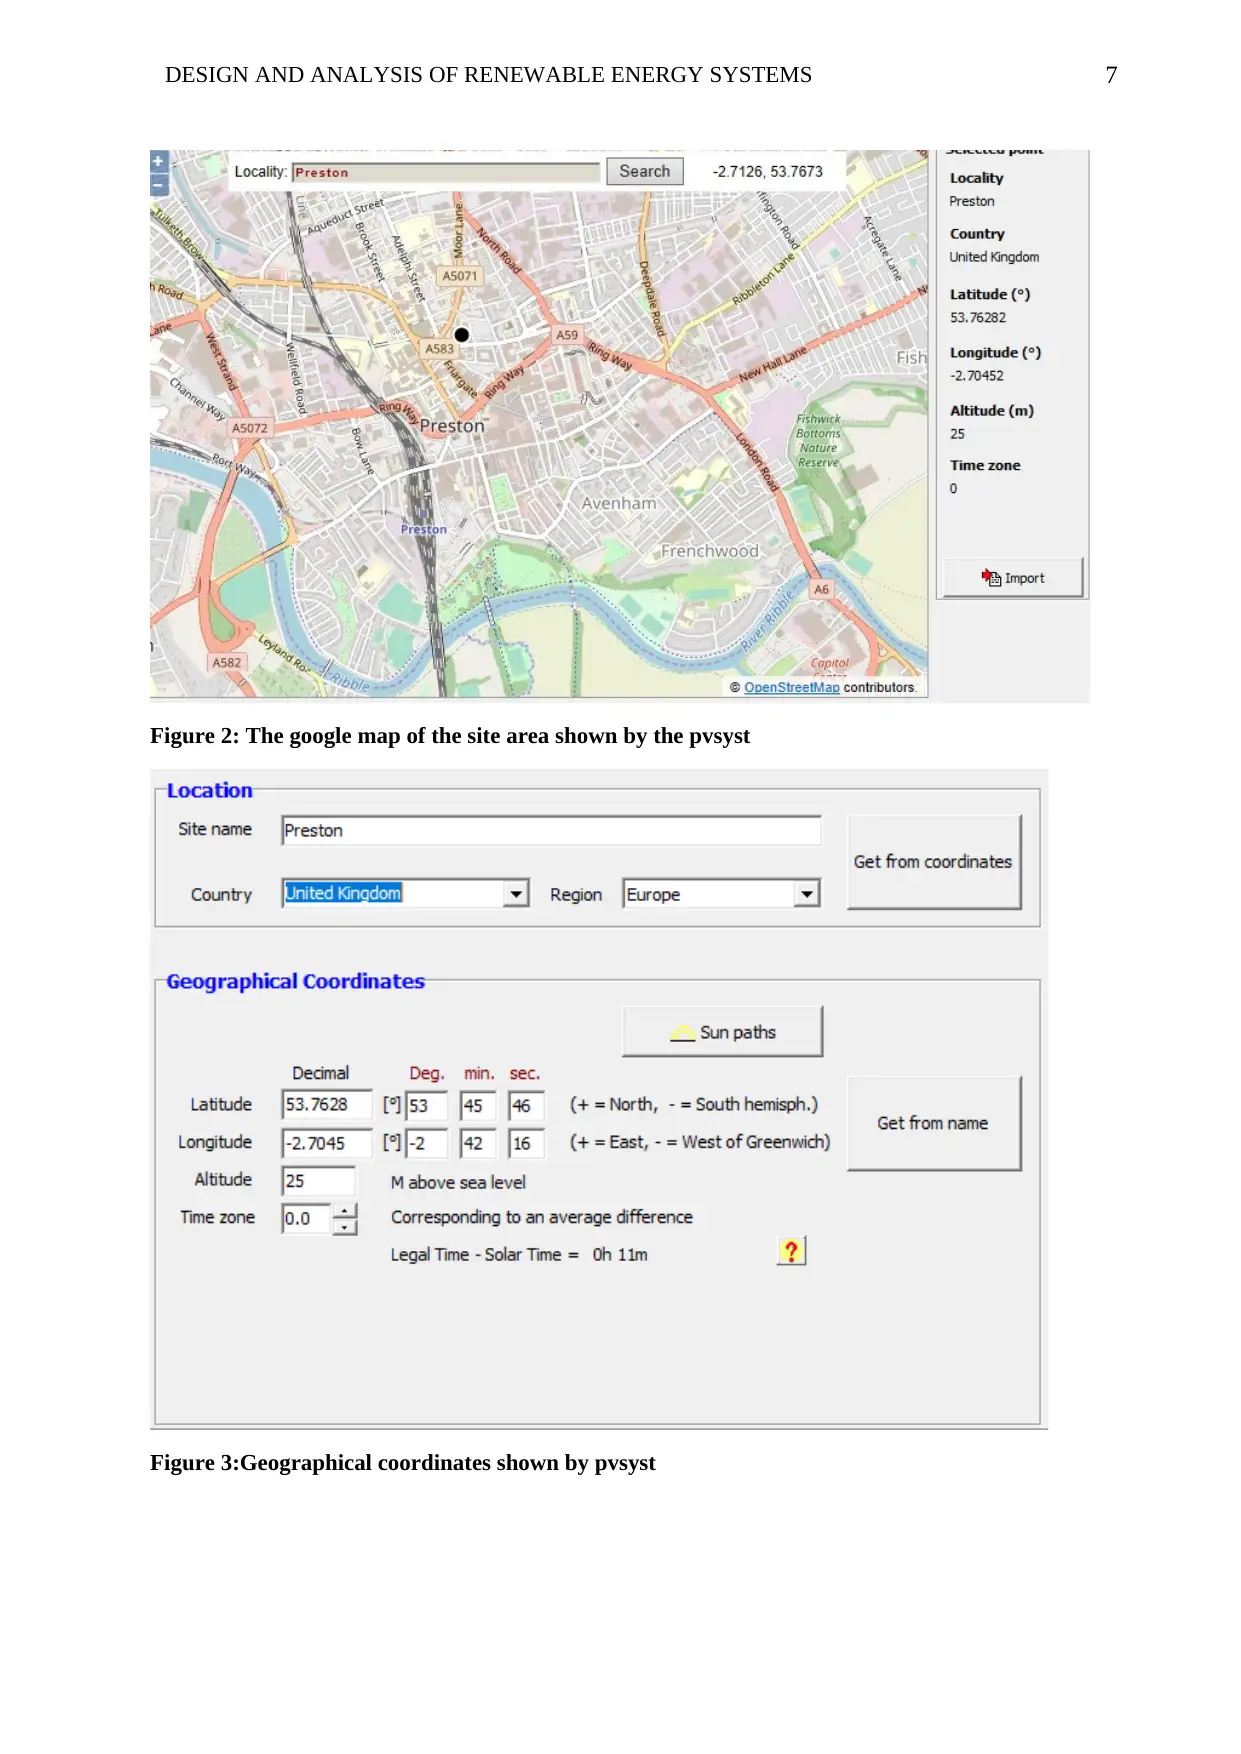
This report presents a detailed technical analysis and design of a grid-connected photovoltaic (PV) system for individual consumption. It encompasses a comprehensive overview of the installation process, including the selection of solar panels (Sharp NU180E1 monocrystalline), their arrangement (18 strings, 216 panels), and the optimal inclination angle. The report addresses the use of array junction boxes, DC and AC isolator switches, string inverters, and LV boards, providing a complete system layout. Data from PVSYST software, including sun path and irradiation data, is incorporated to simulate system performance. The analysis includes an evaluation of voltage generation, solar irradiation, and system efficiency, with data presented in tables and charts. The study compares AC and DC voltage data, and the report provides insights into the efficiency of the system and potential areas for improvement. The report also includes PVSYST simulation results to validate the design and assess the system's performance, with references to relevant sources.
tabler-icon-diamond-filled.svg

Contribute Materials

Your contribution can guide someone’s learning journey. Share your documents today.
Document Page
1Running head: DESIGN AND ANALYSIS OF RENEWABLE ENERGY SYSTEMS
Design and Analysis of renewable energy systems
Name
Institutional Affiliation
tabler-icon-diamond-filled.svg

Secure Best Marks with AI Grader

Need help grading? Try our AI Grader for instant feedback on your assignments.
Document Page
2DESIGN AND ANALYSIS OF RENEWABLE ENERGY SYSTEMS
Introduction
Part A: Analysis and evaluation of a grid-connected photovoltaic (PV) system
This report is aimed at developing a technical report of the design of the PV system for
individual consumption. The technical design will show the process of installation, the solar
panel requirements (in terms of wattage per panel), the mode of installation (in terms of
whether to have solar tracking or have them at an angle), and the kind of solar panel to be
used (whether monocrystalline or polycrystalline). The design should also take into account
the issue of cables to be used, where it should address the cable size and type. Temperature
details and requirement is also a determinant of a solar installation. Some of the technical bit
of the report shall be analysed by PVSYST, so that the details of the area where solar
installation is to happen is known. The software also can project the power output expected in
the area.
The Technical Design
The solar panels shall be on the roof top, see figure 1, arranged in 18 strings of solar panels,
this means that 12 modules connected in parallel with each array having three of those. Each
panel shall have a wattage of 180W and the brand of solar that shall be in use will be
manufactured by Sharp. The model number from Sharp company shall be NU180E1, which
emphasises on the wattage produced per solar panel of monocrystalline type. One array of
solar, shall have thirty-six panels and there are six arrays in total 216 panels and it also means
that there shall be six inverters also connected in parallel. The solar panels will be of
monocrystalline type, which is ideal for the system design. Monocrystalline, is said to be
highly efficient and sleeker in aesthetics, qualities best for individual consumption (sage,
2019). Because the solar panels shall be at the roof, the inclination angle shall be slight,
around 10o, which relates to the area of coverage which is around 283m2.
Figure 1: Solar PV system for UCLan Media Factory
From the array or the panels, the next connection is the array junction box, for Direct Current
(DC). This component of electric supply, it is responsible for splitting the power that is fed
into different circuits, at the same time it provides protection of the circuits to each circuit.
Document Page
3DESIGN AND ANALYSIS OF RENEWABLE ENERGY SYSTEMS
This component of power supply in a solar circuit, also controls the DC power that comes
from solar panels and are fitted with surge protective device in them (Sharan, 2019). Since
isolation is needed during the operation of the solar power system, there shall be a DC
isolator switch. This device is necessary for isolation of the solar power system during
maintenance of the PV array. This must not be confused with the AC isolator; the difference
is simply in the power they isolate (Wind and Sun, 2019). For the project, a 32A was used for
the purpose. After the inverter, there’s an isolator, but this time since the power has been
converted, the isolator shall be an AC type. The AC inverters are also used to isolate the
inverter. These isolators are lockable, meaning there’s a restricted access to them.
From this, the power is channelled to the inverters, which play an important role in the
project, always referred to as the “brains” of a solar power system. These helps in converting
the DC power from the solar panels to AC, that is usable by most loads. They are viewed as
the take-off for energy in a solar PV system. Due to the power that can be generated in the
system, the type of inverters that can be used here shall be the string inverters, these are
domestic inverters that are used in the range of the power requirements relevant here
(Adnalanda, 2018).
The final bit of the system is the panel and the Low Voltage (LV) board where the loads or
the suppliers get connected through. To the plant room, there is a meter, which records the
power out and the power in. There are MCCB (100A) incorporated at the distribution board
section of the main board. The project shall us a 125A main switch, that can isolate the power
system as well, the cabling connected here shall be a 95mm2 4core SWA. Before the power
goes for distribution, there’s the main LV switch, which has a 1600A MCCB, this does the
main isolation and tripping when there’s an over voltage, this offers protection to the load.
Data available
For this there’s an available data for DC and AC voltage recorded monthly for a whole year,
the data shows the months when the voltage were high and those when it was low.
The information about the system is shown above:
Document Page
4DESIGN AND ANALYSIS OF RENEWABLE ENERGY SYSTEMS
Table 1: The voltage generated for the year 2010 from AC source
Months IG 60 HV_1 IG 60 HV_2 IG 60 HV_3 IG 60 HV_4. IG 60 HV_5. IG 60 HV_6.
Jan - - - - - -
Feb 6,014.00 6,031.00 6,250.00 6,034.00 6,092.00 6,041.00
Mar 964.00 967.00 962.00 966.00 976.00 968.00
Apr - - - - - -
May 4,348.00 4,081.00 4,095.00 4,076.00 4,109.00 4,142.00
Jun 1,699.00 1,690.00 1,695.00 1,685.00 1,699.00 1,712.00
Jul - - - - - -
Aug 4,574.00 4,555.00 4,551.00 4,573.00 4,367.00 4,336.00
Sep 2,670.00 2,654.00 2,651.00 2,665.00 2,692.00 2,670.00
Oct - - - - - -
Nov 3,348.00 3,357.00 3,350.00 3,337.00 3,367.00 3,396.00
Dec 3,341.00 3,351.00 3,347.00 3,329.00 3,367.00 3,390.00
Total 26,958.00 26,686.00 26,901.00 26,665.00 26,669.00 26,655.00
The data displayed shows the data for the whole year voltage, this is dependent on the solar
radiation, which is another data set that shall be displayed. The data displayed are categorised
on what was recorded on the six inverters that were used. In February, there was a higher
voltage recorded and can be seen in the graph 1. This month looks like the sun radiation was
at its best therefore it recorded the highest voltage.
Jan Feb Mar Apr May Jun Jul Aug Sep Oct Nov Dec
-
1,000.00
2,000.00
3,000.00
4,000.00
5,000.00
6,000.00
7,000.00
IG 60 HV_1
IG 60 HV_2
IG 60 HV_3
IG 60 HV_4.
IG 60 HV_5.
IG 60 HV_6.
Chart 1: Representation of the AC voltage over a period of 1 year, 2010
The data shows the voltage generated, see table 2, raw voltage, before being taken to the
inverter, so this is DC voltage measured from the panels across the six DC JB. One thing that
can be noted is the voltage tapped was came in daily, no day did it miss, unlike the AC
source.
tabler-icon-diamond-filled.svg

Secure Best Marks with AI Grader

Need help grading? Try our AI Grader for instant feedback on your assignments.
Document Page
5DESIGN AND ANALYSIS OF RENEWABLE ENERGY SYSTEMS
Table 2: The voltage generated in the year 2010 DC source
IG 60 HV_1 IG 60 HV_2 IG 60 HV_3 IG 60 HV_4 IG 60 HV_5 IG 60 HV_6
Jan 226424 221010 231245 223991 230140 225733
Feb 181912 178187 181491 179006 181754 181146
Mar 294592 292520 296152 295997 294886 294060
Apr 452692 448820 528359 449897 449550 445533
May 522792 523397 522405 516902 521807 518410
Jun 522331 521671 522966 517214 520606 519195
Jul 518755 518815 525704 521945 524171 524346
Aug 474888 474155 478258 475387 477720 474748
Sep 391753 391663 395905 392574 392247 389093
Oct 337080 332518 340217 337170 340579 337052
Nov 264363 250985 255885 253435 261629 257737
Dec 162364 159933 172916 168169 158718 157042
Total
The chart plotted, clearly shows the data per month for the whole year, where it can be seen
that the months of May, June, and July gave a lot of voltage and power generally.
Jan Feb Mar Apr May Jun Jul Aug Sep Oct Nov Dec
0
100000
200000
300000
400000
500000
600000
IG 60 HV_1
IG 60 HV_2
IG 60 HV_3
IG 60 HV_4
IG 60 HV_5
IG 60 HV_6
Chart 2:DC voltage generated for the period of 1 year within 2010
Table 3: Monthly data of solar irradiation
Months Total
irradiation
Jan 93,731.00
Feb 91,806.00
Mar 213,615.00
Apr 474,926.00
May 554,786.00
Jun 584,159.00
Jul 413,430.00
Aug 435,206.00
Sep 326,254.00
Oct 248,400.00
Nov 144,169.00
Dec 101,449.00
Document Page
6DESIGN AND ANALYSIS OF RENEWABLE ENERGY SYSTEMS
Jan Feb Mar Apr May Jun Jul Aug Sep Oct Nov Dec
-
100,000.00
200,000.00
300,000.00
400,000.00
500,000.00
600,000.00
700,000.00
Chart 3: Solar irradiation for the year 2010
It can be seen that the solar radiation data relates to the voltage data and chart plotted in chart
2. The month of May, July, July, and August are the months that recorded a heavier solar
radiation. Meaning that solar power would be tapped very well at those months than any,
which is consistent with the DC voltage production.
The systems efficiency, can be measured by looking at the voltage that comes out from the
solar, before being inverted to AC, which is useful power. In this case, the total voltage
generated was taken, for the AC and DC, then a percentage was done, see table 4.
Table 4:Effeciency of the system table
IG 60 HV_1 IG 60 HV_2 IG 60 HV_3 IG 60 HV_4 IG 60 HV_5 IG 60 HV_6
DC voltage 4,349,946.00 4,313,674.00 4,451,503.00 4,331,687.00 4,353,807.00 4,324,095.00
AC voltage 26,958.00 26,686.00 26,901.00 26,665.00 26,669.00 26,655.00
Efficiency 0.00620 0.00619 0.00604 0.00616 0.00613 0.00616
The system yield can be seen from the efficiency and the performance ratio as well. The
system is less efficiency, and the stake holders needs to check why the system is not as
efficient as it should be.
Task B: System simulation in PVSYST and model validation.
The design of the 38.8kW solar production plant of a standalone, simulation of the data shall
be done by Pvsyst version V6.81. We shall have the preliminary and post evaluation data
tests for the viable power generation. The total system performance and the efficiency of the
system. From the pvsyst data, the following data were retrieved, the sun path, irradiation data,
Document Page
7DESIGN AND ANALYSIS OF RENEWABLE ENERGY SYSTEMS
Figure 2: The google map of the site area shown by the pvsyst
Figure 3:Geographical coordinates shown by pvsyst
tabler-icon-diamond-filled.svg

Paraphrase This Document

Need a fresh take? Get an instant paraphrase of this document with our AI Paraphraser
Document Page
8DESIGN AND ANALYSIS OF RENEWABLE ENERGY SYSTEMS
Table 5: Table showing the irradiation data of Preston area
Figure 4: Sun paths at Preston during the months shown
Document Page
9DESIGN AND ANALYSIS OF RENEWABLE ENERGY SYSTEMS
Figure 5:Systsm Specification
Chart 4:Irradiation presentation during the months and other details
The irradiation data plotted is the same as the one shown in chart 3, with the peak being around
5.1kWh/m2 per day, since our panels have a tilt of around 10O.
Document Page
10DESIGN AND ANALYSIS OF RENEWABLE ENERGY SYSTEMS
Chart 5:The solar output plotted data
System output is consistent with the data shown in chart 2,
Table 6: The results data
Results table
tabler-icon-diamond-filled.svg

Secure Best Marks with AI Grader

Need help grading? Try our AI Grader for instant feedback on your assignments.
Document Page
11DESIGN AND ANALYSIS OF RENEWABLE ENERGY SYSTEMS
Figure 6: The investments
References
Document Page
12DESIGN AND ANALYSIS OF RENEWABLE ENERGY SYSTEMS
Adnalanda. (2018, December 22). 5 Types Of Solar Inverters. Retrieved from Urja: sun for life:
http://urjaglobal.in/5-types-of-solar-inverters.php
sage, E. (2019, July 6). Monocrystalline and polycrystalline solar panels: what you need to know.
Retrieved from Energysage: Smarter energy decisions:
https://www.energysage.com/solar/101/monocrystalline-vs-polycrystalline-solar-panels/
Sharan, H. (2019, February 17). DCDB: Array Junction Box, DC Distribution Box. Retrieved from
Kenbrook: solar: https://kenbrooksolar.com/price-list/acdb-dcdb-array-junction-box-
manufacturer
Wind and Sun. (2019). Isolation Switches. Retrieved from Wind&Sun: Powering the future:
http://www.windandsun.co.uk/products/Grid-Connect-Accessories/Isolation-Switches#.XUw-
LOgzbIU
chevron_up_icon
1 out of 12
circle_padding
hide_on_mobile
zoom_out_icon
logo.png

Your All-in-One AI-Powered Toolkit for Academic Success.

Available 24*7 on WhatsApp / Email

[object Object]