Finance Report: Ratio Analysis of Renishaw plc - Spring 2020

Verified

Added on  2023/01/12

|9
|1905
|38
Report
AI Summary
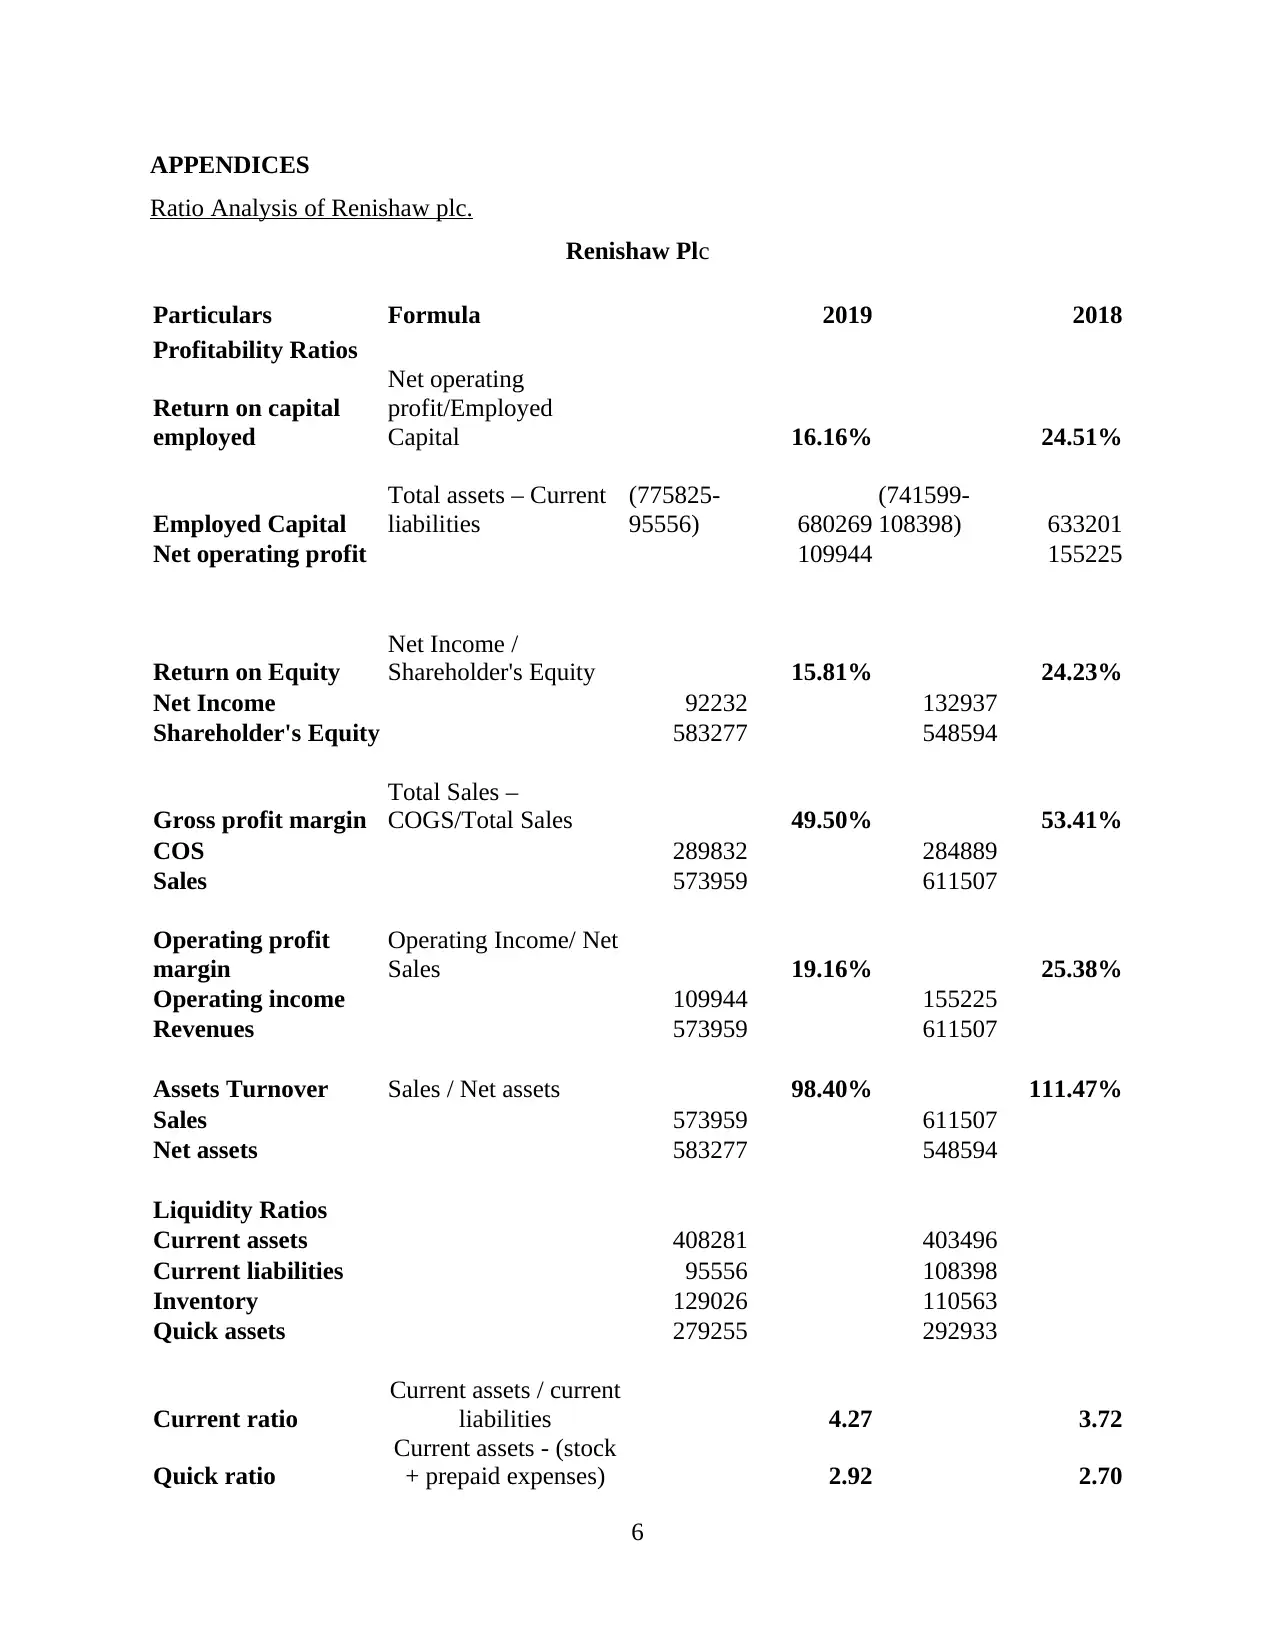
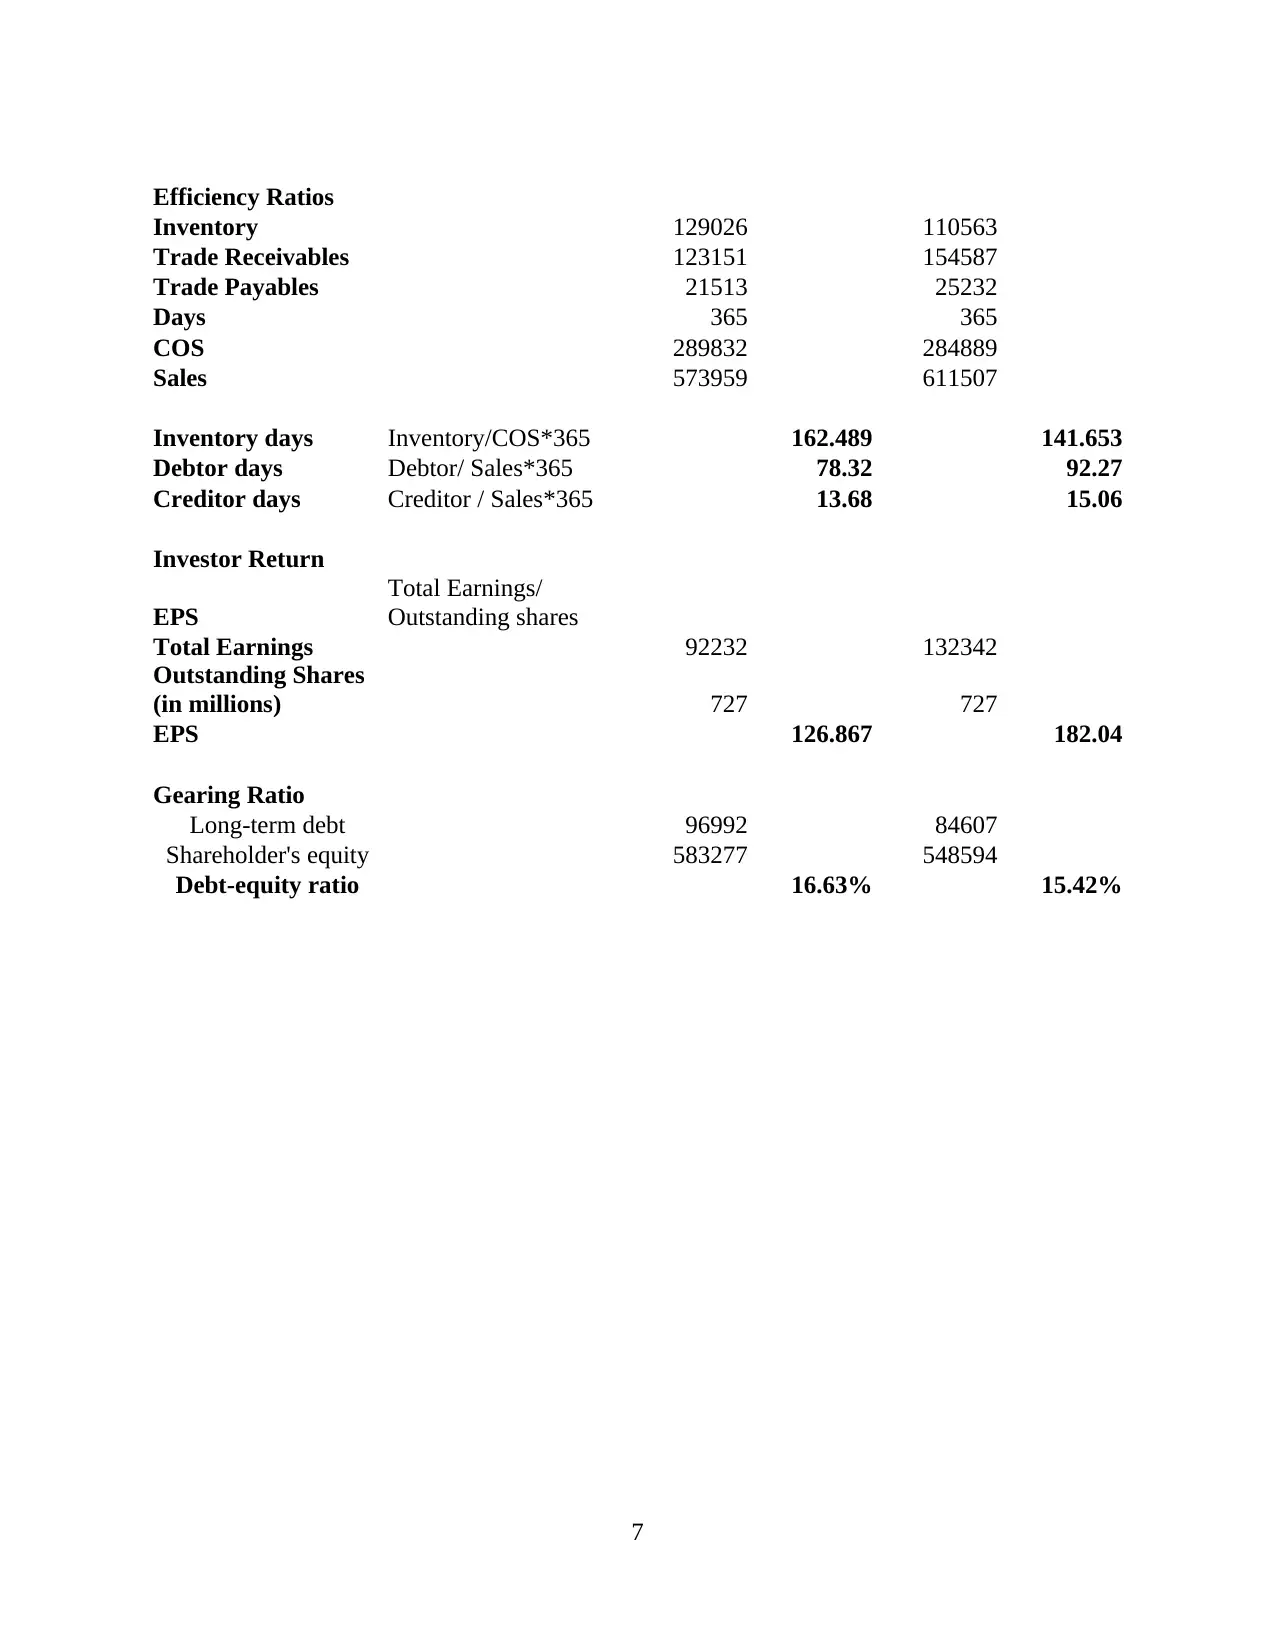
This report provides a comprehensive financial analysis of Renishaw plc, a British engineering corporation, using ratio analysis. It delves into the company's financial performance by examining various financial ratios, including profitability ratios like Return on Capital Employed (ROCE), Return on Equity (ROE), and profit margins, along with liquidity ratios such as the current and quick ratios. The analysis also covers working capital management and efficiency ratios, such as asset turnover and inventory days, and solvency ratios like the debt-equity ratio. The report highlights the trends in these ratios from 2018 to 2019, identifying strengths and weaknesses in Renishaw plc's financial position and providing insights into its operational efficiency, liquidity, and solvency. The conclusion emphasizes the need for corrective measures to address the decline in returns and revenues, offering a critical assessment of the company's financial health.
Document Page
FINANCE FOR MANAGERS
tabler-icon-diamond-filled.svg

Paraphrase This Document

Need a fresh take? Get an instant paraphrase of this document with our AI Paraphraser
Document Page
TABLE OF CONTENTS
INTRODUCTION...........................................................................................................................1
REPORT..........................................................................................................................................1
CONCLUSION ...............................................................................................................................4
REFERENCES................................................................................................................................5
Ratio Analysis of Renishaw plc...................................................................................................6
Document Page
INTRODUCTION
Finance is term broadly described for study and systems of the money, investment and
financial instruments. Authorities have preferred to divide the finance in three categories that is
public finance, personal finance and corporate finance. Most important is corporate finance and
has critical role in every business. Business cannot run smoothly without the availability of
sufficient finance to carry out the operations. Present report has covered the importance of
finance. This has used ratio analysis as a tool for assessing the financial health and position of
company. In the present report Renishaw plc has been taken as the host company. Report will
enhance the understanding of the financial performance of company using the financial ratios.
REPORT
Renishaw Plc
Renishaw plc is British engineering corporation which is based in Gloucestershire.
Company specialise in measurement, healthcare, motion control, spectroscopy and for
manufacturing. It is also known for the measuring machines & machine tools. Company is
leading in the metal additive production where the machine prints part using metal powder.
Company is listed over London Stock Exchange (LSE) and constituent of FTSE 250 Index. It is
operating since 1973 in the engineering industry. Company had revenues of 574 million in 2019
with operating income of 99.8 million. It employs over 4968 people in the industry.
Assessing financial performance of company.
Financial performance of the company can be measures using number of indicators such
as financial ratios like liquidity ration, solvency ratios, profitability and many more ratios.
Measuring financial performance is essential to identify the health and position of the company
in the industry in comparison to its competitors. The users before investing he funds assess the
financial performance by analysing its profitability, its liquidity position, operating efficiency
and the financial structures. Ratio analysis is an essential tool used by the experts and users of
financial statements for assessing the viability of their investments. They prevent the investors
from blocking their funds in industries having low profitability and returns. In the present case
financial performance of Renishaw plc has been assessed. In depth analysis of financial
statements have been carried out in the report.
Profitability Ratios
1
Document Page
Return on capital employed represents the return generated by company over the capital
employed in the company. ROCE of company is 15.81% in 2019 and 24.51% in 2018. Return
has decreased from the last year as the profits for the year have decreased. There has been
significant decline in the return. This can affect the image of company in financial market (Erin,
2019). This represents the efficiency of company in managing its available resources to earn
profits. Decrease is seen as the sales of company has declined from last year with the increase in
cost of goods sold.
Return on Equity measures the return generated by company over its equity capital. This
is an important profitability and investor ratio that has direct influence over the decisions of
investors. Investors are concerned with the returns over their investments higher the return,
higher is the share price of company. ROE of company is 15.81% and it has declined from
24.23% in 2018. Company is require to immediate steps to reframe its policies for increasing the
returns.
Gross profit margins of company were 53.41 % in 2018 and this has decreased to
49.50% in 2019. The gross profits are high but company is required to take immediate steps so
that the reasons of decline could be controlled. Gross should be high as company carries out its
other operations from the gross profits of company.
Net operating profit margins are essential for the business enterprise as it represents that
business is running successfully. Net profit represents that company is having adequate returns
after carrying out the business (Dicu, Bondoc and Popescu, 2019). Net profit margin of
company has declined significantly from 25.38% to 19.16%. This requires serious attention of
the management as expenses have continued to grow and there has been decline in the revenues
of company decreasing returns.
Liquidity Ratios
Current ratio represent the ability of company in meeting its short term obligations from
the current assets. Current ratio of company is 4.27 in 2019 and it has increase from 3.72 in
2018. Liquidity position of company is becoming stronger even more. Company is enough
current assets for meeting its short term obligations. Industry standards for current ratio is 2:1
and it is having liquidity position twice the industry standards. Liquidity position of company
should be strong as it this has direct impact over external stakeholders like suppliers and the
2
tabler-icon-diamond-filled.svg

Paraphrase This Document

Need a fresh take? Get an instant paraphrase of this document with our AI Paraphraser
Document Page
financial institutes. They are concerned whether the company will be able to meet its obligations
of payment for the supplies and funds borrowed on short term basis.
Quick Ratio of company is also high, it is having ratio of 2.92 in 2019 and had 2.70 in
2018. In the both the years ratios are above the standard of 1.5 : 1. The ratio measures liquidity
position of company excluding the inventory as it is not considered liquid asset because it is not
possible for the company to sell it on current basis to generate cash (Abdelraheem and
Serajeldin, 2017). However the liquidity position of company is strong even after excluding the
inventory from the current assets. High liquidity shows that company has funds blocked in
organisation which could be invested on short term basis elsewhere for generating returns.
Working Capital Management/ Efficiency Ratios
Efficiency ratios measures how much efficient company is in managing its resources.
Asset turnover ratio of company has declined from last year due to the decrease in sales. It
measures the sales generated by company as against its assets. Current asset turnover ratio of
company is 98.40%.
Inventory days of the company have increased from last year. This represents that the
movement of inventory from company has slowed down. It has to take promotional strategies for
increasing the frequency of inventory movement.
Debtor and creditor days shows that the gap is very high. Collection days of companies
are very high as against the payables (Quaranta, Tartufoli and Zifaro, 2018). This increases the
working capital cash cycle. It should reduce the debtor days so that collections could be used for
repayments to suppliers instead of using other funds.
Solvency Ratio
Debt Equity ratio is calculated for assessing the financial risk associated with the
company. Company do not have high debt, it has debt equity ratio of 16.63% in 2019 which was
15.42 % 2018. Company is having equity capital high, it shows that it do not uses debt financing
in its business. Cost of equity financing is much higher than that of debt (Rahman, 2017).
Company may adopt debt financing for meeting its financial requirements. The current debt
equity ratio represent that there is not high financial risk in the company.
Shareholder Return
Earning per share is the shareholder return. This refers to the earnings of company on
per share basis. This represents the amount of return available on each share of company. The
3
Document Page
analysis show that the EPS of company has declined from last year due to the decrease in profits.
Investors will make a shift if they do not get adequate earnings over their shares (Brîndescu-
Olariu, 2016). However the earning per share are high.
CONCLUSION
From the above report conclusions could be drawn that the financial performance of
company is assessed using various financial ratios. Renishaw plc is operating efficiently in the
industry however the returns and revenues of the company have declined significantly from last
year. Therefore company is required to take immediate corrective measures for getting the
company back on its track.
4
Document Page
REFERENCES
Books and Journals
Erin, O.A., 2019. An investigative analysis into the impact of International Financial Reporting
Standards (IFRS) on the profitability ratios of Nigerian banks.
Dicu, C., Bondoc, M.D. and Popescu, M.B., 2019. A Quantitative Approach To Profitability
Ratios. Scientific Bulletin-Economic Sciences. 18(1). pp.57-65.
Abdelraheem, A.A.E. and Serajeldin, B.E.A., 2017. Impact of Liquidity Ratio Analysis on
Financial Data Quality (Field Study in Commercial Banks-West Kordofan-
Sudan). International Journal of Research in Social Sciences. 7(6). pp.263-271.
Quaranta, A.G., Tartufoli, S. and Zifaro, M., 2018. An Alternative Proposal based on
Organizational Effectiveness and Efficiency Ratios for Forecasting the Financial Status of
a Firm. International Review of Business Research Papers. 14(1).
Rahman, A.A.A.A., 2017. The Relationship between Solvency Ratios and Profitability Ratios:
Analytical Study in Food Industrial Companies listed in Amman Bursa. International
Journal of Economics and Financial Issues. 7(2). pp.86-93.
Brîndescu-Olariu, D., 2016. Assessment of the bankruptcy risk based on the solvency
ratio. Theoretical & Applied Economics. 23(3).
Online
[Online]. Available through : <>.
[Online]. Available through : <>.
5
tabler-icon-diamond-filled.svg

Paraphrase This Document

Need a fresh take? Get an instant paraphrase of this document with our AI Paraphraser
Document Page
APPENDICES
Ratio Analysis of Renishaw plc.
Renishaw Plc
Particulars Formula 2019 2018
Profitability Ratios
Return on capital
employed
Net operating
profit/Employed
Capital 16.16% 24.51%
Employed Capital
Total assets – Current
liabilities
(775825-
95556) 680269
(741599-
108398) 633201
Net operating profit 109944 155225
Return on Equity
Net Income /
Shareholder's Equity 15.81% 24.23%
Net Income 92232 132937
Shareholder's Equity 583277 548594
Gross profit margin
Total Sales –
COGS/Total Sales 49.50% 53.41%
COS 289832 284889
Sales 573959 611507
Operating profit
margin
Operating Income/ Net
Sales 19.16% 25.38%
Operating income 109944 155225
Revenues 573959 611507
Assets Turnover Sales / Net assets 98.40% 111.47%
Sales 573959 611507
Net assets 583277 548594
Liquidity Ratios
Current assets 408281 403496
Current liabilities 95556 108398
Inventory 129026 110563
Quick assets 279255 292933
Current ratio
Current assets / current
liabilities 4.27 3.72
Quick ratio
Current assets - (stock
+ prepaid expenses) 2.92 2.70
6
Document Page
Efficiency Ratios
Inventory 129026 110563
Trade Receivables 123151 154587
Trade Payables 21513 25232
Days 365 365
COS 289832 284889
Sales 573959 611507
Inventory days Inventory/COS*365 162.489 141.653
Debtor days Debtor/ Sales*365 78.32 92.27
Creditor days Creditor / Sales*365 13.68 15.06
Investor Return
EPS
Total Earnings/
Outstanding shares
Total Earnings 92232 132342
Outstanding Shares
(in millions) 727 727
EPS 126.867 182.04
Gearing Ratio
Long-term debt 96992 84607
Shareholder's equity 583277 548594
Debt-equity ratio 16.63% 15.42%
7
chevron_up_icon
1 out of 9
circle_padding
hide_on_mobile
zoom_out_icon
[object Object]