Comprehensive Project Report: Accounting System and Processes
VerifiedAdded on  2023/06/04
|17
|2646
|448
Report
AI Summary
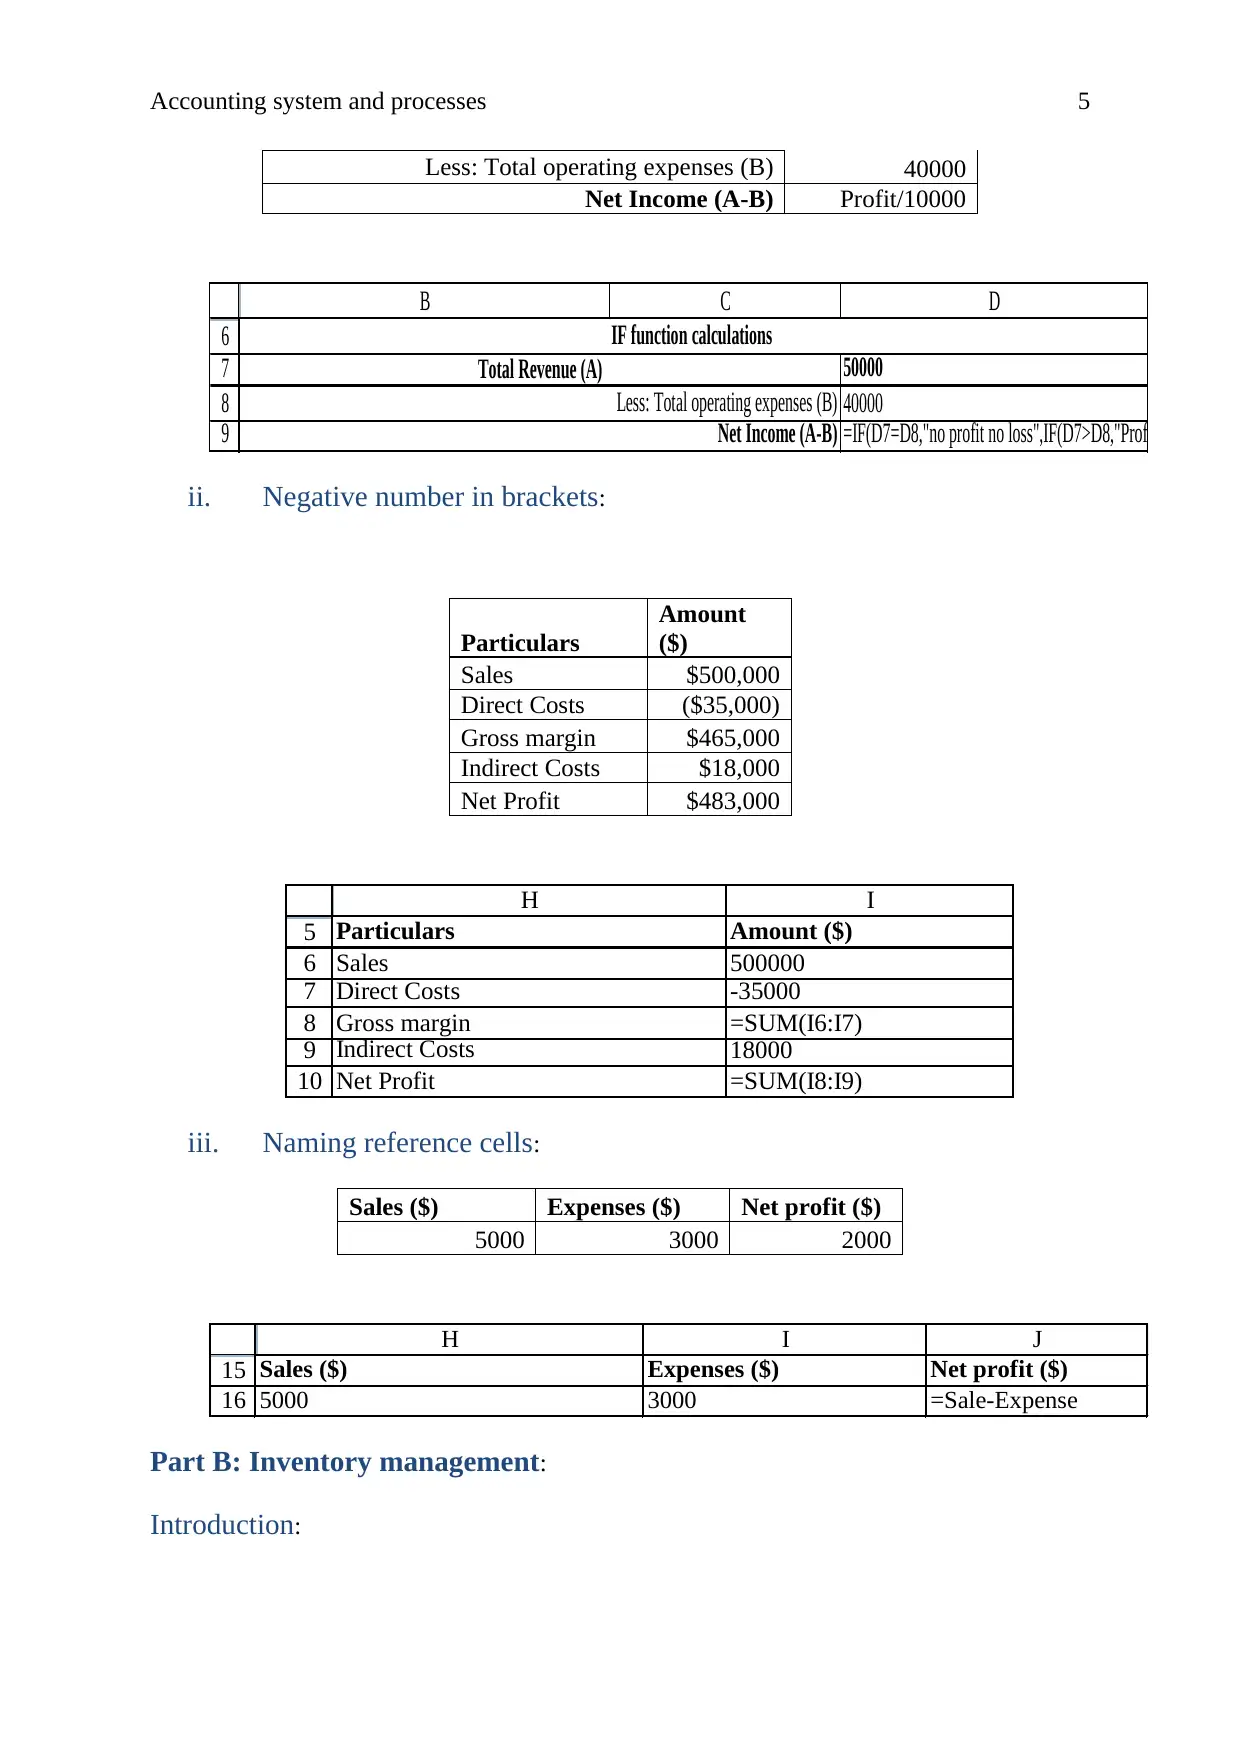
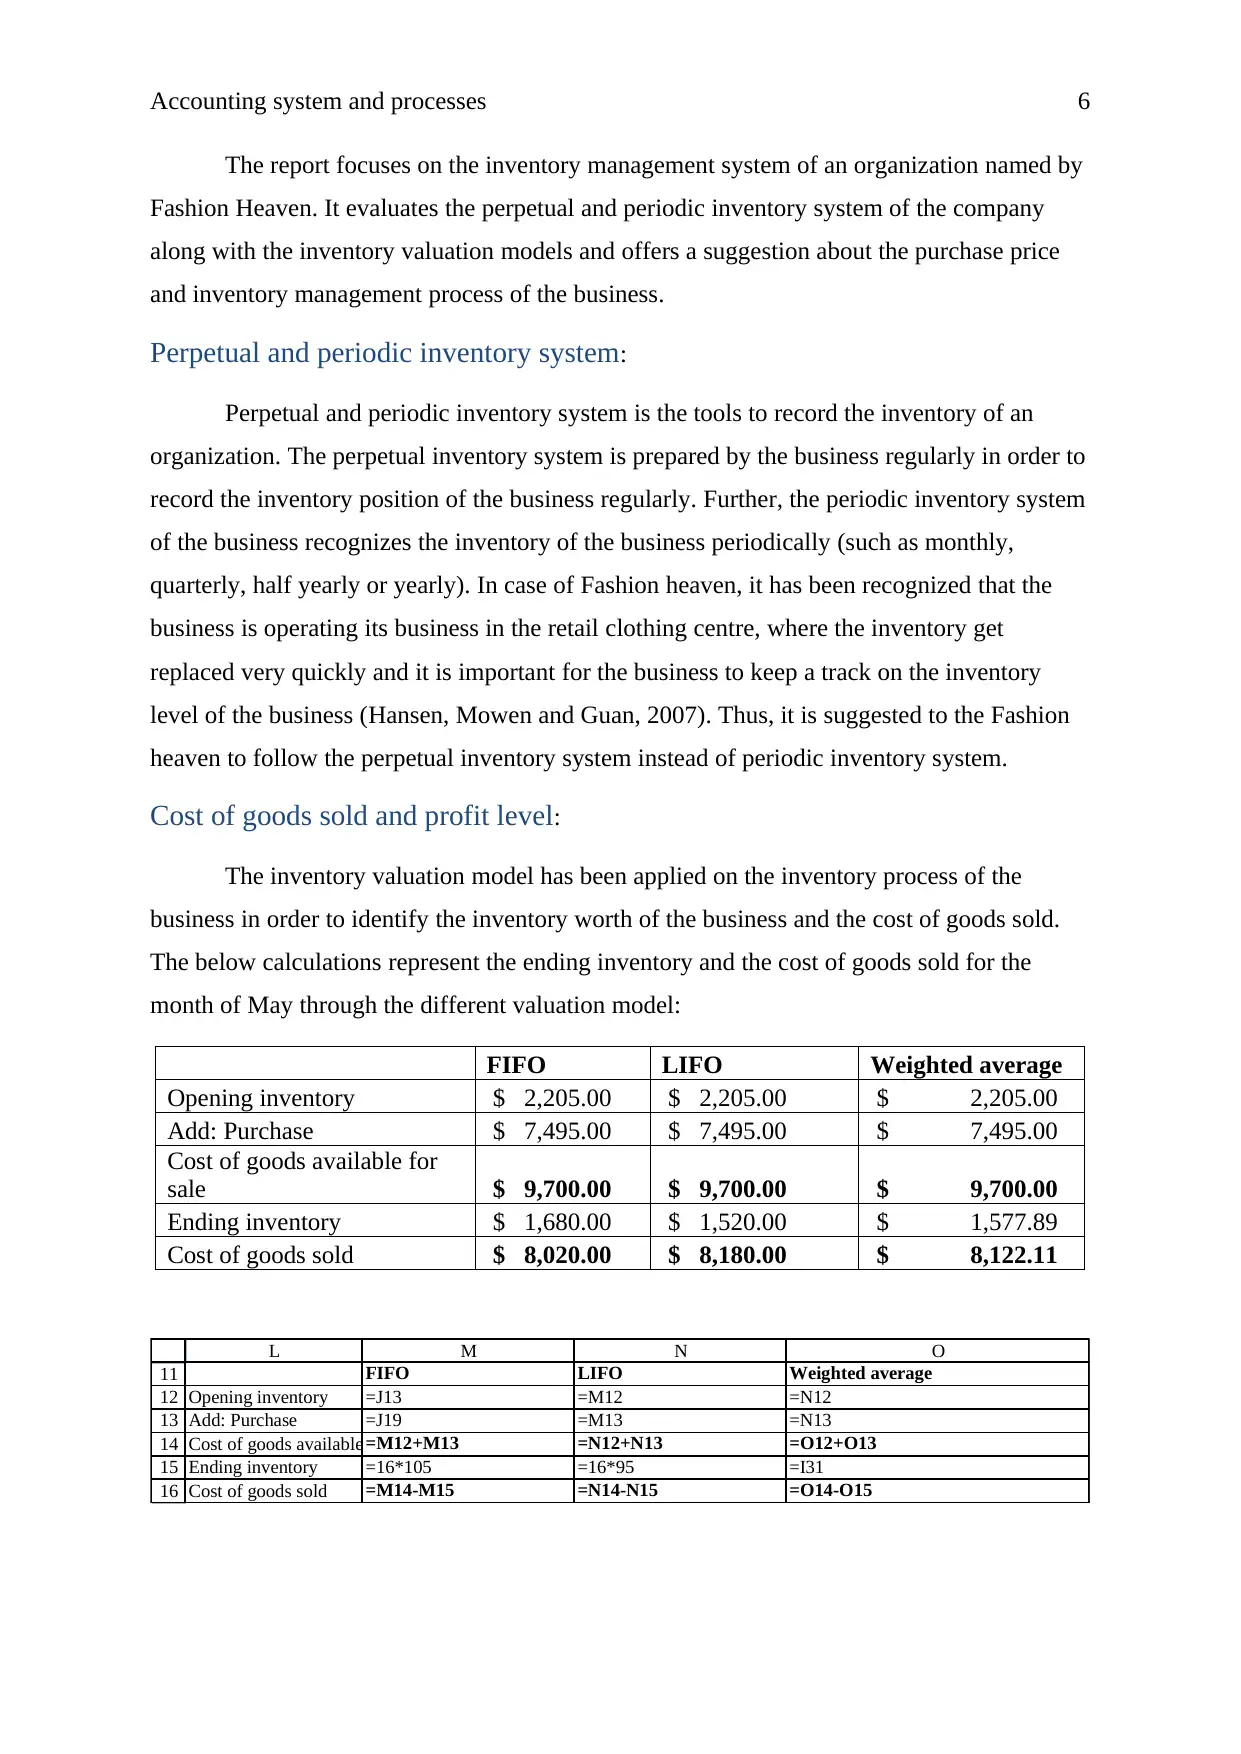
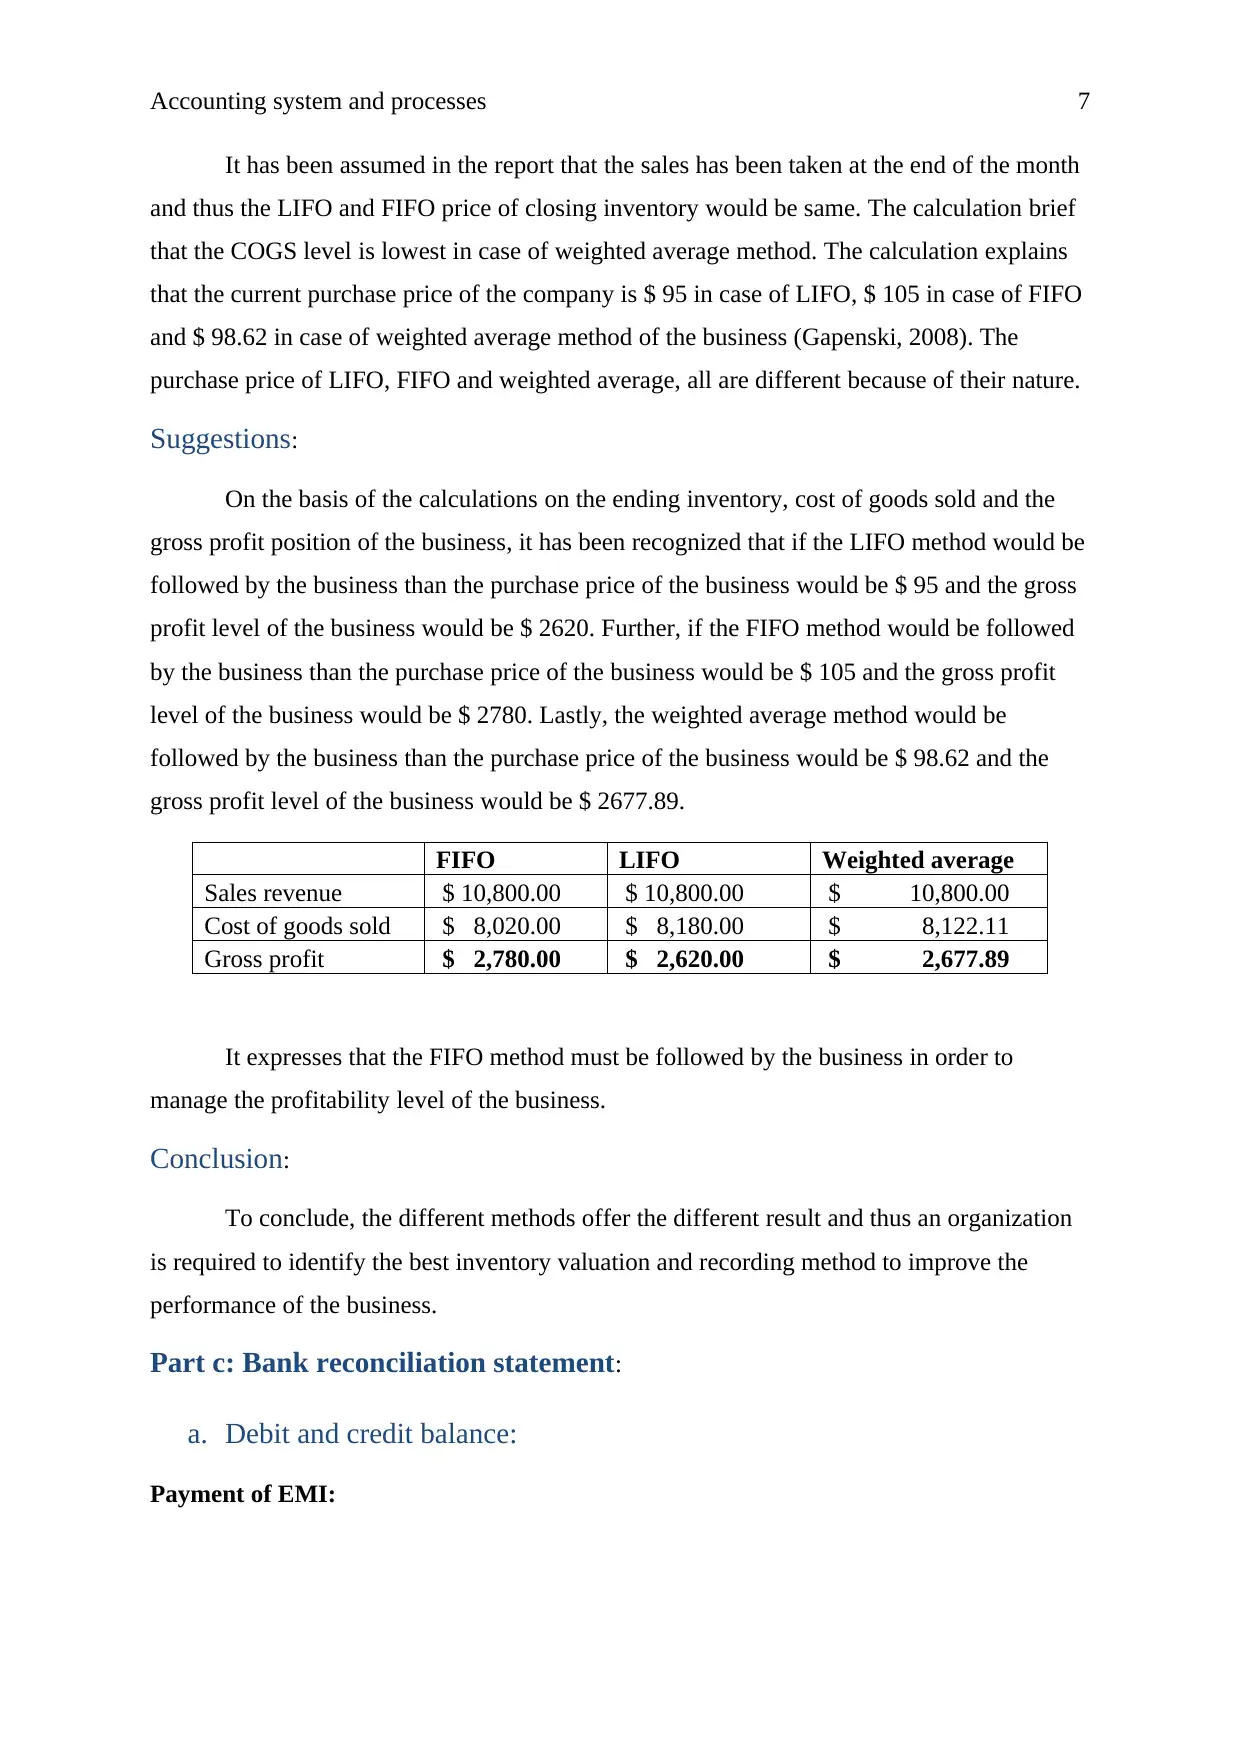
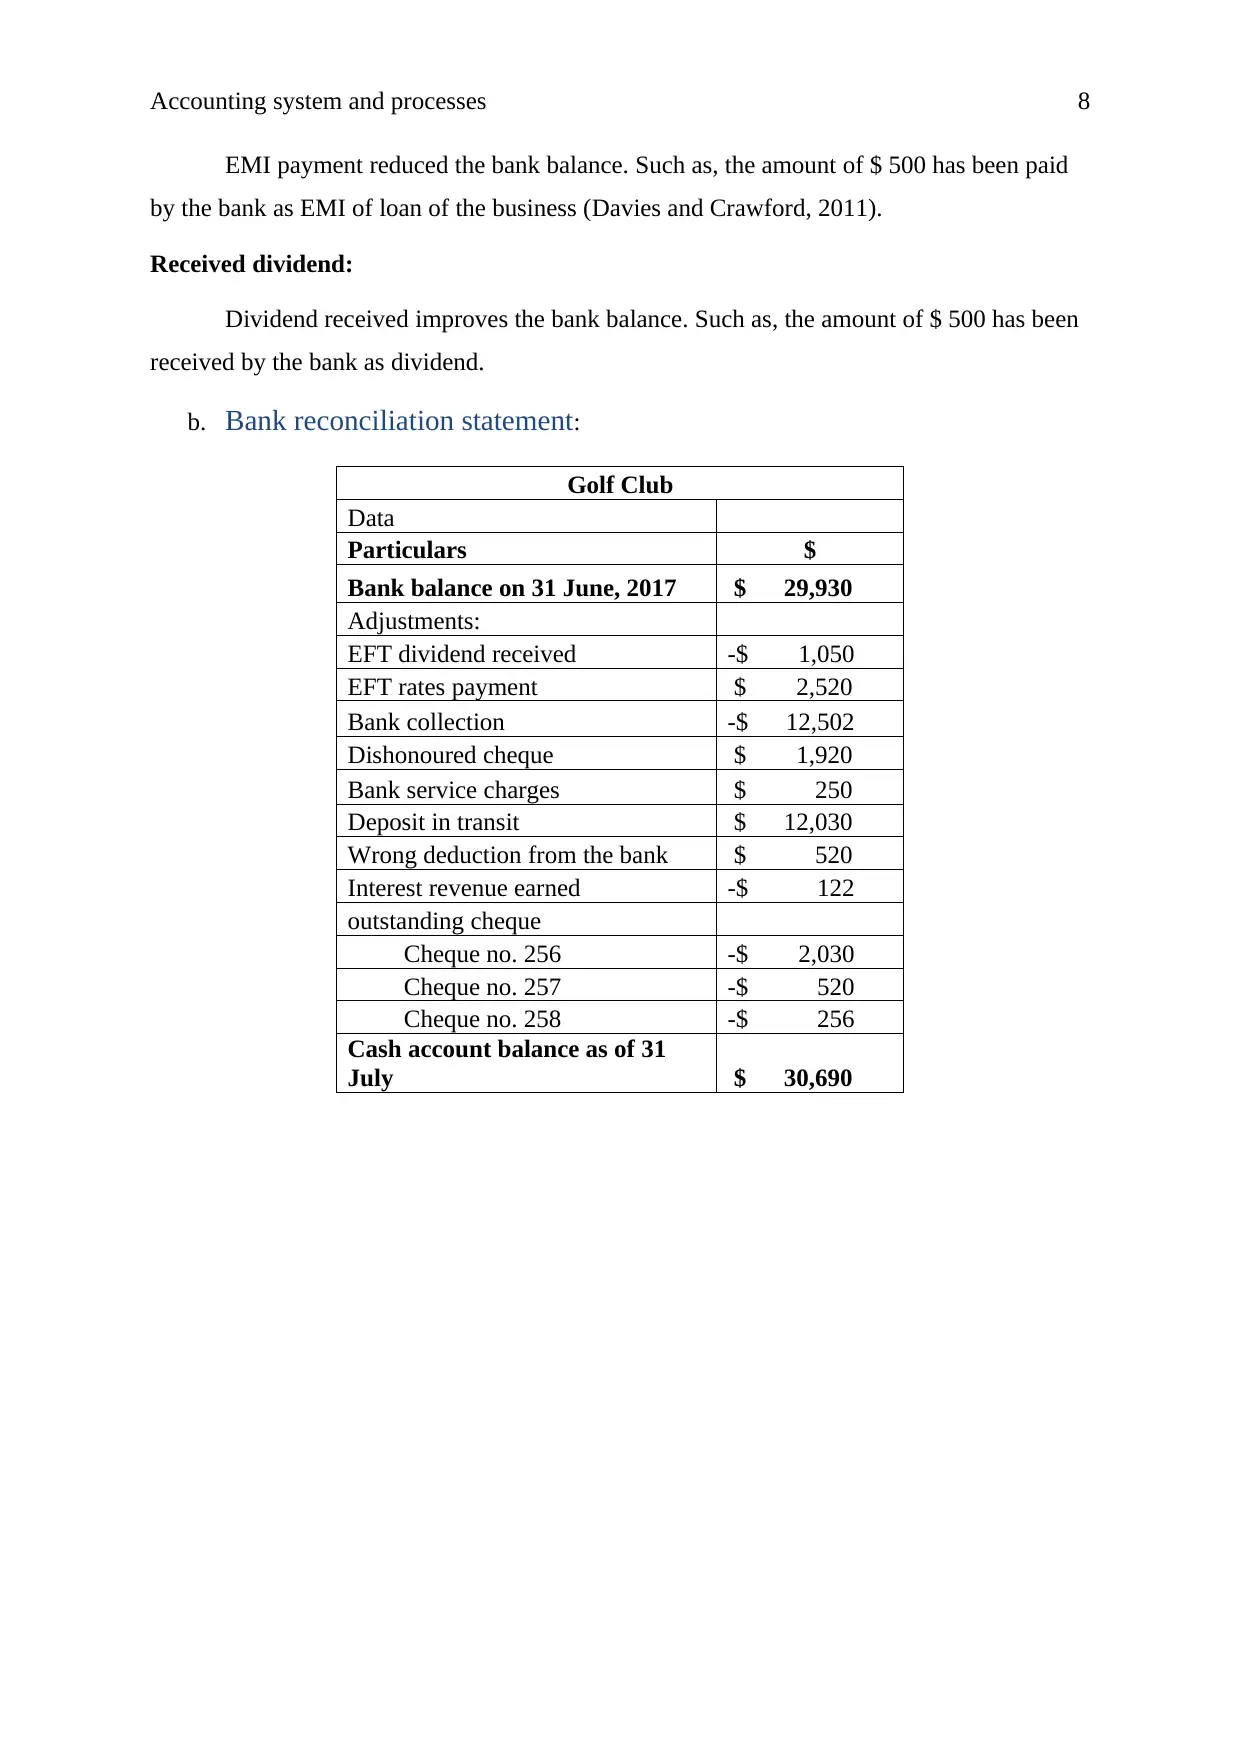
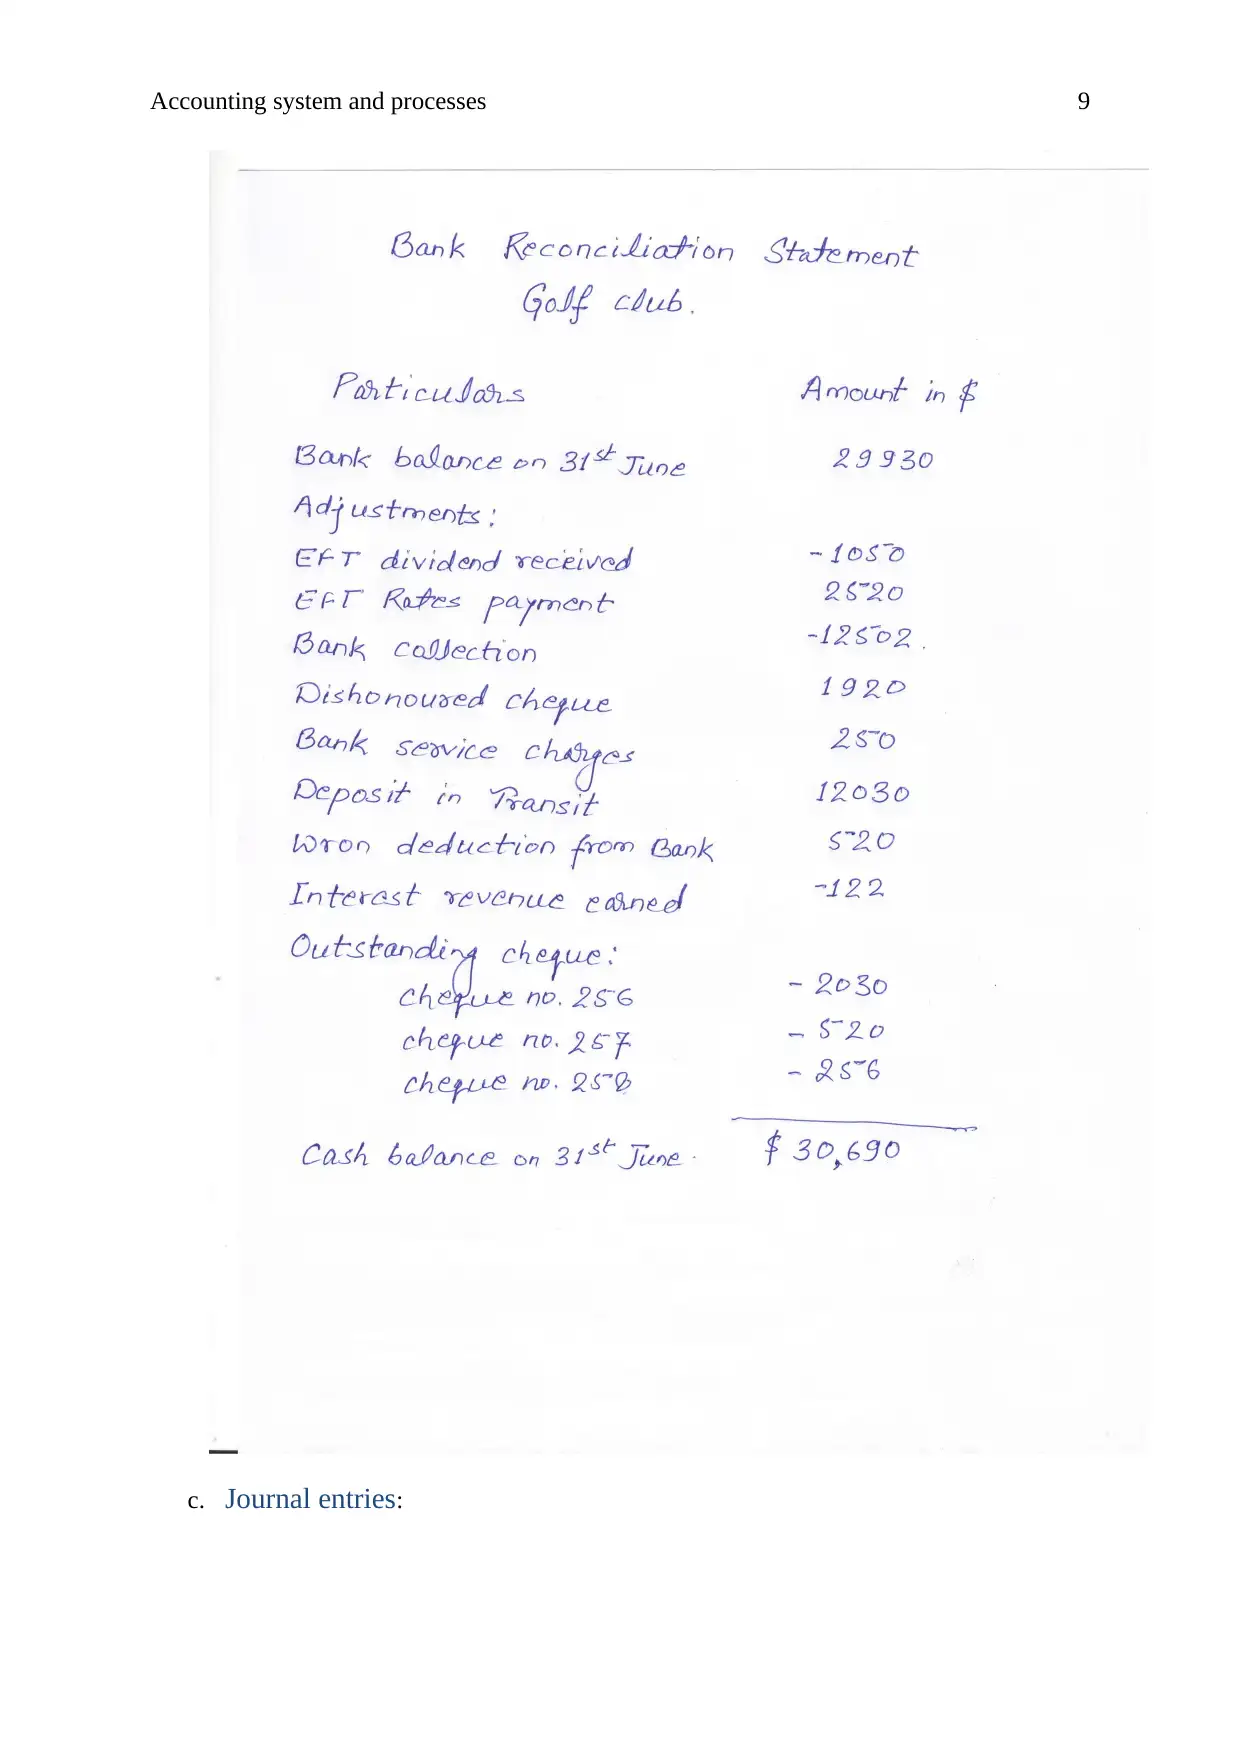
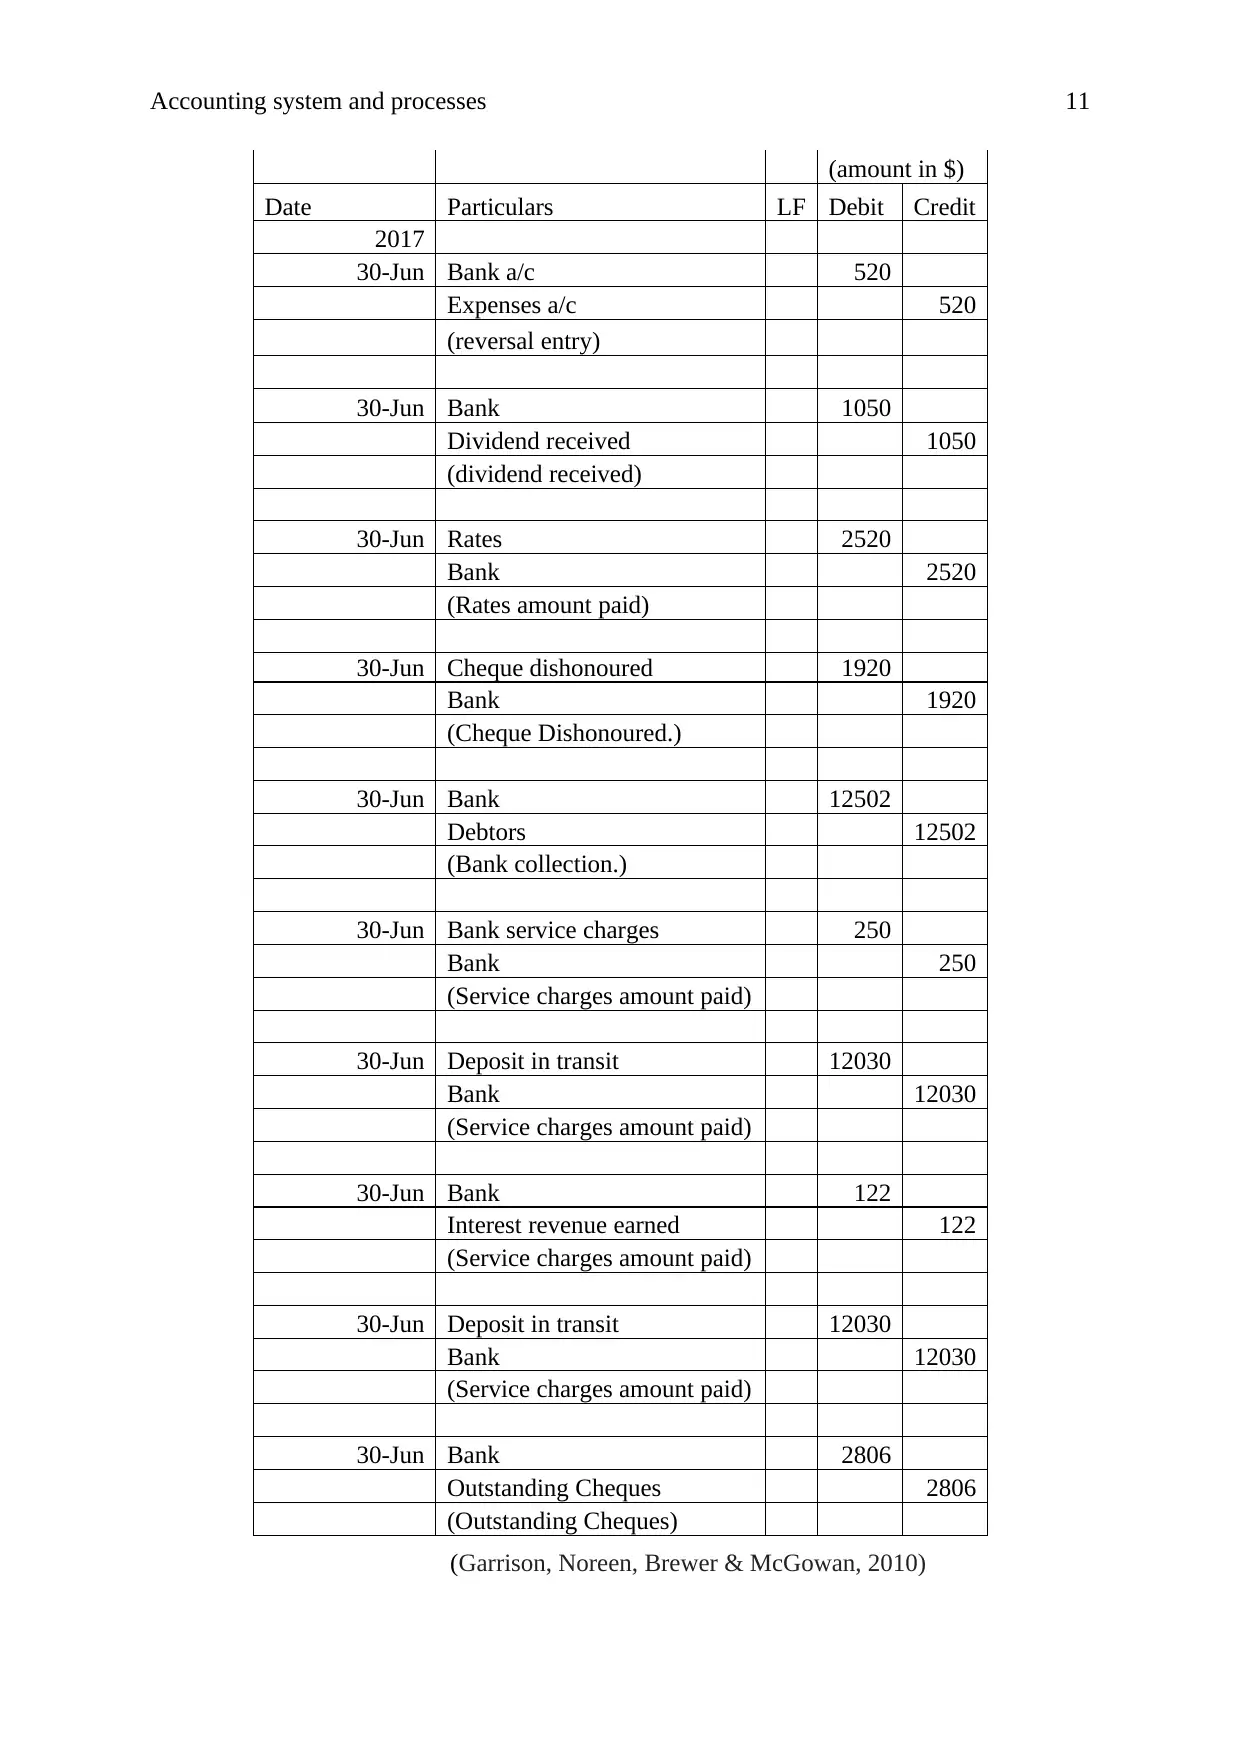
This project report provides a detailed analysis of accounting systems and processes, covering spreadsheet applications, inventory management, bank reconciliation, and bad debt management. The report begins with an examination of spreadsheet usage in accounting, including the advantages and disadvantages, separation of data reports, and practical examples using IF functions and cell referencing. It then transitions to inventory management, comparing perpetual and periodic systems, evaluating cost of goods sold using FIFO, LIFO, and weighted average methods, and offering suggestions for Fashion Heaven's inventory practices. The report further addresses bank reconciliation, explaining debit and credit balances, constructing a bank reconciliation statement, and providing relevant journal entries. Lastly, it delves into bad debt management, discussing various methods and conducting a financial analysis of Coca-Cola Amatil, including profitability, liquidity, capital structure, and sustainability, ultimately recommending long-term investment. Desklib offers a wealth of similar solved assignments and study resources for students.

Running Head: Accounting system and processes
1
Project Report: Accounting system and processes
1
Project Report: Accounting system and processes
Secure Best Marks with AI Grader
Need help grading? Try our AI Grader for instant feedback on your assignments.

Accounting system and processes 2
Contents
Part A: Spreadsheet...........................................................................................................3
a.Spreadsheet................................................................................................................3
b.Separation of data report and spreadsheet.................................................................3
c.Spreadsheet example..................................................................................................3
i.IF function..................................................................................................................3
ii.Negative number in brackets.....................................................................................4
iii.Naming reference cells.............................................................................................4
Part B: Inventory management.........................................................................................4
Introduction...................................................................................................................4
Perpetual and periodic inventory system......................................................................5
Cost of goods sold and profit level...............................................................................5
Suggestions...................................................................................................................6
Conclusion....................................................................................................................6
Part c: Bank reconciliation statement...............................................................................6
a.Debit and credit balance:...........................................................................................6
b.Bank reconciliation statement....................................................................................7
c.Journal entries............................................................................................................8
Part D: Bad debt management and financial decision....................................................10
Introduction.................................................................................................................10
Bad debt method.........................................................................................................10
Various bad debt methods..........................................................................................10
Financial analysis........................................................................................................10
Sustainability analysis................................................................................................12

Accounting system and processes 3
Recommendation and conclusion...............................................................................13
References.......................................................................................................................14
Appendix.........................................................................................................................15

Accounting system and processes 4
Part A: Spreadsheet:
a. Spreadsheet:
Spreadsheet is used by the accountant even after the availability of different accounting
software, due to the easiness and the reliability on the spreadsheet. Though, there are various
disadvantages of spreadsheet which has been discussed below:
i. Cause of costly mistakes:
Various costly mistakes could take place in a business because of the spreadsheet
evaluation such as a record of wrong number could affect at huge level (Wordpress, 2018).
ii. Time thieves:
On the basis of the a research, it has been found that an accountant or the spreadsheet
preparer spend average 12 hours per month on the spreadsheet in order to revise, consolidate,
modification, correction etc the spreadsheet. Spreadsheet eats so much time of a business and
thus this toll must be replaced by the business (Hillier, Grinblatt & Titman, 2011).
iii. Difficult to process:
Further, sometimes it become difficult for the few users to process the spreadsheet in
proper way as well as the wrong figure represents the different answer which impacts the
overall decision process of an organization (Chron, 2018).
Thus, it has been recognised that the spreadsheet could impact much on the overall
figures and the outcome of the business.
b. Separation of data report and spreadsheet:
Data report is always used to evaluate and analyze the result which has been generated
through the calculations in the spreadsheet and thus both the reports are in important in order
to identify the figures and their analysis (Chron, 2018). So, it is always said to the accounts to
represent both the files separately in order to manage the easiness, reliability and the
transparency in the business.
c. Spreadsheet example:
i. IF function:
IF function calculations
Total Revenue (A) 50000
Secure Best Marks with AI Grader
Need help grading? Try our AI Grader for instant feedback on your assignments.

Accounting system and processes 5
Less: Total operating expenses (B) 40000
Net Income (A-B) Profit/10000
6
7
8
9
B C D
50000
40000
=IF(D7=D8,"no profit no loss",IF(D7>D8,"Profit/",IF(D7<D8,
Total Revenue (A)
IF function calculations
Less: Total operating expenses (B)
Net Income (A-B)
ii. Negative number in brackets:
Particulars
Amount
($)
Sales $500,000
Direct Costs ($35,000)
Gross margin $465,000
Indirect Costs $18,000
Net Profit $483,000
5
6
7
8
9
10
H I
Particulars Amount ($)
Sales 500000
Direct Costs -35000
Gross margin =SUM(I6:I7)
Indirect Costs 18000
Net Profit =SUM(I8:I9)
iii. Naming reference cells:
Sales ($) Expenses ($) Net profit ($)
5000 3000 2000
15
16
H I J
Sales ($) Expenses ($) Net profit ($)
5000 3000 =Sale-Expense
Part B: Inventory management:
Introduction:

Accounting system and processes 6
The report focuses on the inventory management system of an organization named by
Fashion Heaven. It evaluates the perpetual and periodic inventory system of the company
along with the inventory valuation models and offers a suggestion about the purchase price
and inventory management process of the business.
Perpetual and periodic inventory system:
Perpetual and periodic inventory system is the tools to record the inventory of an
organization. The perpetual inventory system is prepared by the business regularly in order to
record the inventory position of the business regularly. Further, the periodic inventory system
of the business recognizes the inventory of the business periodically (such as monthly,
quarterly, half yearly or yearly). In case of Fashion heaven, it has been recognized that the
business is operating its business in the retail clothing centre, where the inventory get
replaced very quickly and it is important for the business to keep a track on the inventory
level of the business (Hansen, Mowen and Guan, 2007). Thus, it is suggested to the Fashion
heaven to follow the perpetual inventory system instead of periodic inventory system.
Cost of goods sold and profit level:
The inventory valuation model has been applied on the inventory process of the
business in order to identify the inventory worth of the business and the cost of goods sold.
The below calculations represent the ending inventory and the cost of goods sold for the
month of May through the different valuation model:
FIFO LIFO Weighted average
Opening inventory $ 2,205.00 $ 2,205.00 $ 2,205.00
Add: Purchase $ 7,495.00 $ 7,495.00 $ 7,495.00
Cost of goods available for
sale $ 9,700.00 $ 9,700.00 $ 9,700.00
Ending inventory $ 1,680.00 $ 1,520.00 $ 1,577.89
Cost of goods sold $ 8,020.00 $ 8,180.00 $ 8,122.11
11
12
13
14
15
16
L M N O
FIFO LIFO Weighted average
Opening inventory =J13 =M12 =N12
Add: Purchase =J19 =M13 =N13
Cost of goods available for sale=M12+M13 =N12+N13 =O12+O13
Ending inventory =16*105 =16*95 =I31
Cost of goods sold =M14-M15 =N14-N15 =O14-O15

Accounting system and processes 7
It has been assumed in the report that the sales has been taken at the end of the month
and thus the LIFO and FIFO price of closing inventory would be same. The calculation brief
that the COGS level is lowest in case of weighted average method. The calculation explains
that the current purchase price of the company is $ 95 in case of LIFO, $ 105 in case of FIFO
and $ 98.62 in case of weighted average method of the business (Gapenski, 2008). The
purchase price of LIFO, FIFO and weighted average, all are different because of their nature.
Suggestions:
On the basis of the calculations on the ending inventory, cost of goods sold and the
gross profit position of the business, it has been recognized that if the LIFO method would be
followed by the business than the purchase price of the business would be $ 95 and the gross
profit level of the business would be $ 2620. Further, if the FIFO method would be followed
by the business than the purchase price of the business would be $ 105 and the gross profit
level of the business would be $ 2780. Lastly, the weighted average method would be
followed by the business than the purchase price of the business would be $ 98.62 and the
gross profit level of the business would be $ 2677.89.
FIFO LIFO Weighted average
Sales revenue $ 10,800.00 $ 10,800.00 $ 10,800.00
Cost of goods sold $ 8,020.00 $ 8,180.00 $ 8,122.11
Gross profit $ 2,780.00 $ 2,620.00 $ 2,677.89
It expresses that the FIFO method must be followed by the business in order to
manage the profitability level of the business.
Conclusion:
To conclude, the different methods offer the different result and thus an organization
is required to identify the best inventory valuation and recording method to improve the
performance of the business.
Part c: Bank reconciliation statement:
a. Debit and credit balance:
Payment of EMI:
Paraphrase This Document
Need a fresh take? Get an instant paraphrase of this document with our AI Paraphraser

Accounting system and processes 8
EMI payment reduced the bank balance. Such as, the amount of $ 500 has been paid
by the bank as EMI of loan of the business (Davies and Crawford, 2011).
Received dividend:
Dividend received improves the bank balance. Such as, the amount of $ 500 has been
received by the bank as dividend.
b. Bank reconciliation statement:
Golf Club
Data
Particulars $
Bank balance on 31 June, 2017 $ 29,930
Adjustments:
EFT dividend received -$ 1,050
EFT rates payment $ 2,520
Bank collection -$ 12,502
Dishonoured cheque $ 1,920
Bank service charges $ 250
Deposit in transit $ 12,030
Wrong deduction from the bank $ 520
Interest revenue earned -$ 122
outstanding cheque
Cheque no. 256 -$ 2,030
Cheque no. 257 -$ 520
Cheque no. 258 -$ 256
Cash account balance as of 31
July $ 30,690

Accounting system and processes 9
c. Journal entries:
c. Journal entries:

Accounting system and processes 10
Journal entries
Journal entries
Secure Best Marks with AI Grader
Need help grading? Try our AI Grader for instant feedback on your assignments.

Accounting system and processes 11
(amount in $)
Date Particulars LF Debit Credit
2017
30-Jun Bank a/c 520
Expenses a/c 520
(reversal entry)
30-Jun Bank 1050
Dividend received 1050
(dividend received)
30-Jun Rates 2520
Bank 2520
(Rates amount paid)
30-Jun Cheque dishonoured 1920
Bank 1920
(Cheque Dishonoured.)
30-Jun Bank 12502
Debtors 12502
(Bank collection.)
30-Jun Bank service charges 250
Bank 250
(Service charges amount paid)
30-Jun Deposit in transit 12030
Bank 12030
(Service charges amount paid)
30-Jun Bank 122
Interest revenue earned 122
(Service charges amount paid)
30-Jun Deposit in transit 12030
Bank 12030
(Service charges amount paid)
30-Jun Bank 2806
Outstanding Cheques 2806
(Outstanding Cheques)
(Garrison, Noreen, Brewer & McGowan, 2010)

Accounting system and processes 12
Part D: Bad debt management and financial decision:
Introduction:
The report concentrates on coca cola Amatil and the various associated information of
the business.
Bad debt method:
The annual report (2017) explains that the company is following the aging method to
evaluate the bad debt amount. On the basis of the below image, the bad debts of the business
is $ 3.9 million.
Figure 1: Bad debt
(Annual report, 2017)
Various bad debt methods:
The various other methods to record the bad debts of the business are % of sales
method and the personal estimation method. The % of sales method concentrates on the total
sales of the business whereas the personal estimation method recognizes the evaluation on the
market and estimated the bad debt position of the business (Garrison, Noreen, Brewer &
McGowan, 2010).
Financial analysis:
The financial analysis study has been done on the coca cola Amatil. The profitability,
liquidity and capital structure ratios of the business have been calculated to identify the
investment position of the company.

Accounting system and processes 13
The profitability ratio expresses that the return on capital employed and the gross
profit margin of the company in last 3 years is quite similar. Though, the below graph
explains the changes of the business.
Figure 2: Profitability ratios
(annual report, 2017)
The liquidity ratio expresses the current ratio and quick ratio position of the business.
The current level of liquidity has been lowered and still little reduction could be done by the
business without facing the liquidity risk.
Figure 3: Liquidity ratios
(annual report, 2017)
Paraphrase This Document
Need a fresh take? Get an instant paraphrase of this document with our AI Paraphraser

Accounting system and processes 14
The capital structure ratio expresses the gearing ratio and the interest coverage ratio, the
position of the business has been improved from the last year and still explains that the
company should make few changes into the capital structure to manage the cost and the risk
position of the business.
Figure 4: Capital structure ratios
(annual report, 2017)
Sustainability analysis:
The sustainability report of business explains that the company has managed enough
changes into the events and the programs to improve the customers and society level. The
business has reduced the use of chemical in order to offer the quality product to the customers
(annual report, 2017).
Recommendation and conclusion:
On the basis of the overall evaluation on the coca cola Amatil sustainability position
and the financial performance, it has been found that the performance of the company is
improving and thus the investment into the company is a good option. An investor is
suggested to invest for long term in the company to get higher return.

Accounting system and processes 15
References:
Annual report. (2017). Coca Cola Amatil. (Online). Retrieved 2018 from:
https://www.ccamatil.com/-/media/Cca/Corporate/Files/ASX-Announcements/
2018/2017-Full-Year-Report.ashx
Chron. (2018). Advantages and disadvantages of spreadsheet. (Online). Retrieved 2018 from:
http://smallbusiness.chron.com/advantages-disadvantages-spreadsheets-26551.html
Davies, T. and Crawford, I., (2011). Business accounting and finance. Pearson.
Gapenski, L.C., (2008). Healthcare finance: an introduction to accounting and financial
management. Health Administration Press.
Garrison, R. H., Noreen, E. W., Brewer, P. C., & McGowan, A. (2010). Managerial
accounting. Issues in Accounting Education, 25(4), 792-793.
Hansen, D., Mowen, M. and Guan, L., (2007). Cost management: accounting and control.
Cengage Learning.
Hillier, D., Grinblatt, M. and Titman, S., (2011). Financial markets and corporate strategy.
McGraw Hill.
Wordpress. (2018). Spreadsheet concepts. (Online). Retrieved from:
https://spreadsheetconcepts.wordpress.com/advantages-and-disadvantages/.

Accounting system and processes 16
Appendix:
Ratio Calculations 2015 2016 2017
Profitability Ratios: 2015 2016 2017
Return on Capital employed 2,015 2,016 2,017
Operating profit / -324 -510 -272
Capital employed (total assets - current
liabilities)
4,66
6
4,62
1
4,21
8
Answer: % -6.94% -11.04% -6.45%
Gross Profit Margin 2,015 2,016 2,017
Gross profit / 2,080 2,079 2,042
Sales Revenue (note used operating revenue) 5,033 5,091 4,881
Answer: 41.3% 40.8% 41.8%
Liquidity Ratios 2015 2016 2017
Current Ratio 2,015 2,016 2,017
Current Assets / 3,128 3,105 2,800
Current liabilities 2,001 1,843 1,839
Answer: 1.56 1.68 1.52
Acid test ratio 2,015 2,016 2,017
Current Assets - Inventory / 2,394 2,429 2,130
Current Liabilities 2,001 1,843 1,839
Answer: 1.20 1.32 1.16
Capital Structure Ratios 2015 2016 2017
Gearing ratio 2,015 2,016 2,017
Long term liabilities / 2,256 2,211 2,338
Capital employed 4,666 4,621 4,218
Answer: % 0.483 0.478 0.554
Interest Coverage Ratio 2,015 2,016 2,017
EBIT / -324 -510 -272
Secure Best Marks with AI Grader
Need help grading? Try our AI Grader for instant feedback on your assignments.

Accounting system and processes 17
Net Finance Costs (used net interest expense) 121 115 104
Answer:
-
2.68
-
4.43
-
2.62
Net Finance Costs (used net interest expense) 121 115 104
Answer:
-
2.68
-
4.43
-
2.62
1 out of 17
Related Documents

Your All-in-One AI-Powered Toolkit for Academic Success.
 +13062052269
info@desklib.com
Available 24*7 on WhatsApp / Email
Unlock your academic potential
© 2024  |  Zucol Services PVT LTD  |  All rights reserved.