A Report on HRM Functions and their Impact on Job Satisfaction
VerifiedAdded on 2023/06/12
|11
|2369
|445
Report
AI Summary
This report investigates the relationship between human resource management (HRM) practices and job satisfaction. It employs statistical analysis, including correlation, ANOVA, and Chi-square tests, to examine factors such as physical work environment, freedom in choosing work methods, recognition, responsibility, and opportunities for skill utilization. The study reveals a significant association between gender and recognition for good work, suggesting potential gender bias within organizations. While some job satisfaction factors correlate, others do not, highlighting the importance of identifying independent and dependent variables. The analysis concludes that addressing gender discrimination and fostering an inclusive organizational culture are crucial for enhancing employee job satisfaction and overall business environment. Desklib offers a wealth of similar solved assignments and past papers to aid students in their studies.
Individual Report
Paraphrase This Document
Need a fresh take? Get an instant paraphrase of this document with our AI Paraphraser
Contents
Introduction and Literature Review.................................................................................................3
MAIN BODY..................................................................................................................................3
Methods.......................................................................................................................................3
Results..........................................................................................................................................5
CONCLUSION................................................................................................................................8
REFERENCES..............................................................................................................................10
Introduction and Literature Review
The topic that has been chosen is human resource management. The HRM is a very vast
topic under which come leadership, role clarity, job satisfaction, appraisal, and many more. In
the report, the survey is done on the respondents who work in an organization and some type of
behavioural questions are being asked to them. In this report, the topic that has been chosen is
job satisfaction (Bin-Tahir and et.al., 2018). The objective of conducting the study is to analyse
the functions of human resource management which will lead to the make assuming and helps in
developing the culture of the organization in a better and appropriate way, which could be
beneficial for the employees as well as for the enterprise as well.
The review of literature for this research could be:
According to Anton Vorina, 2017, in the research paper analysis on the relationship between
job satisfaction and employee engagement, it could have been said that the association between
both the factors named job satisfaction and engagement for employees in business activities
leads to a significant relationship. This, in turn, states that by analysing and using the various test
in SPSS, through the regression model, the independent factor influences the other dependent
variable.
As per the viewpoint of Mohibullah Waziri, in the research on the analysis of the impact of
training on the performance of employees, it could be stated that between the variables related to
HRM named job skills, enhancement, morale, performance, the correlation is positive, which
means that the relationship exists between these variables optimistically. It lays a positive impact
on the working of the organization. It enhances and helps in boosting the productivity of the
company.
MAIN BODY
Methods.
The variable that is to be used in this research is job satisfaction. It will help in analysing
the relationship between both factors independent and dependent. It could be done when the time
and activity are properly allocated. The responsibilities of every employee should be clearly
defined to then, then only the satisfaction could be gathered by the employees (Daryanto, 2018).
⊘ This is a preview!⊘
Do you want full access?
Subscribe today to unlock all pages.
Trusted by 1+ million students worldwide
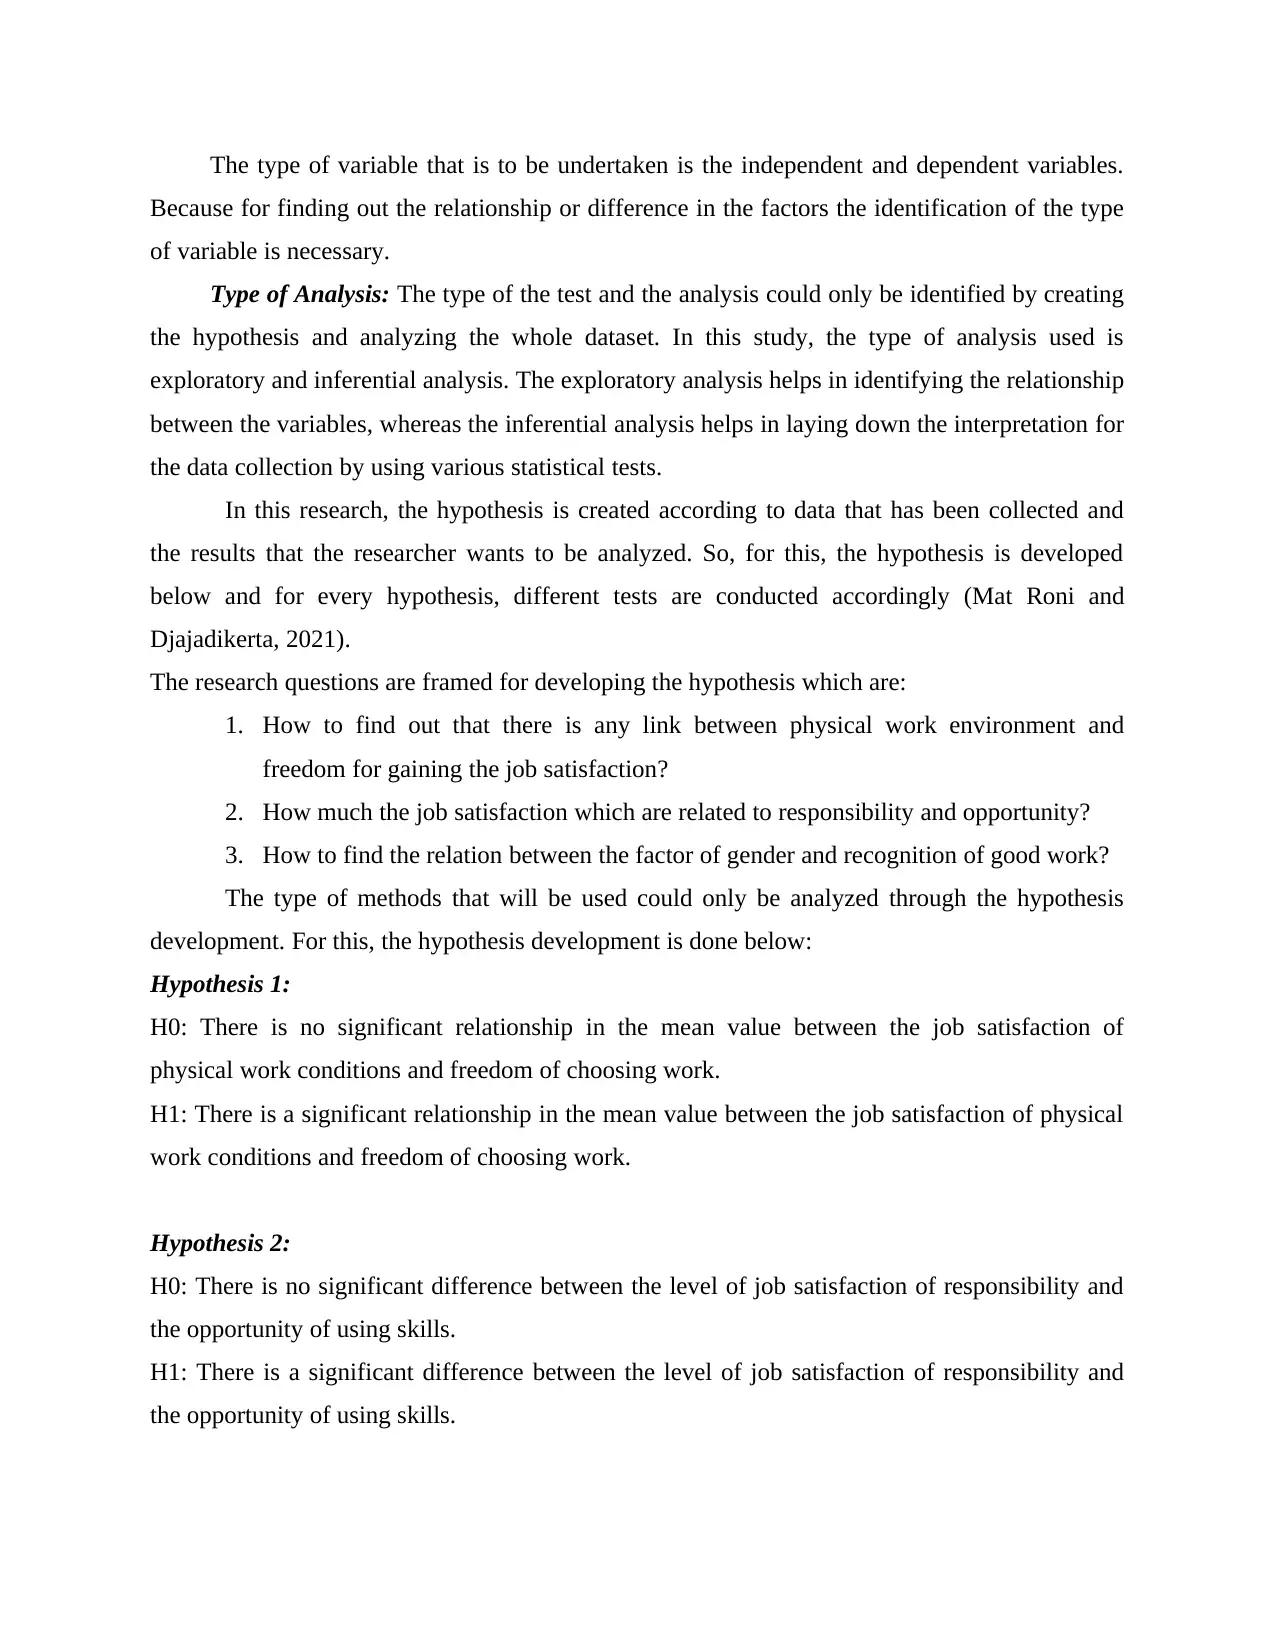
The type of variable that is to be undertaken is the independent and dependent variables.
Because for finding out the relationship or difference in the factors the identification of the type
of variable is necessary.
Type of Analysis: The type of the test and the analysis could only be identified by creating
the hypothesis and analyzing the whole dataset. In this study, the type of analysis used is
exploratory and inferential analysis. The exploratory analysis helps in identifying the relationship
between the variables, whereas the inferential analysis helps in laying down the interpretation for
the data collection by using various statistical tests.
In this research, the hypothesis is created according to data that has been collected and
the results that the researcher wants to be analyzed. So, for this, the hypothesis is developed
below and for every hypothesis, different tests are conducted accordingly (Mat Roni and
Djajadikerta, 2021).
The research questions are framed for developing the hypothesis which are:
1. How to find out that there is any link between physical work environment and
freedom for gaining the job satisfaction?
2. How much the job satisfaction which are related to responsibility and opportunity?
3. How to find the relation between the factor of gender and recognition of good work?
The type of methods that will be used could only be analyzed through the hypothesis
development. For this, the hypothesis development is done below:
Hypothesis 1:
H0: There is no significant relationship in the mean value between the job satisfaction of
physical work conditions and freedom of choosing work.
H1: There is a significant relationship in the mean value between the job satisfaction of physical
work conditions and freedom of choosing work.
Hypothesis 2:
H0: There is no significant difference between the level of job satisfaction of responsibility and
the opportunity of using skills.
H1: There is a significant difference between the level of job satisfaction of responsibility and
the opportunity of using skills.
Paraphrase This Document
Need a fresh take? Get an instant paraphrase of this document with our AI Paraphraser
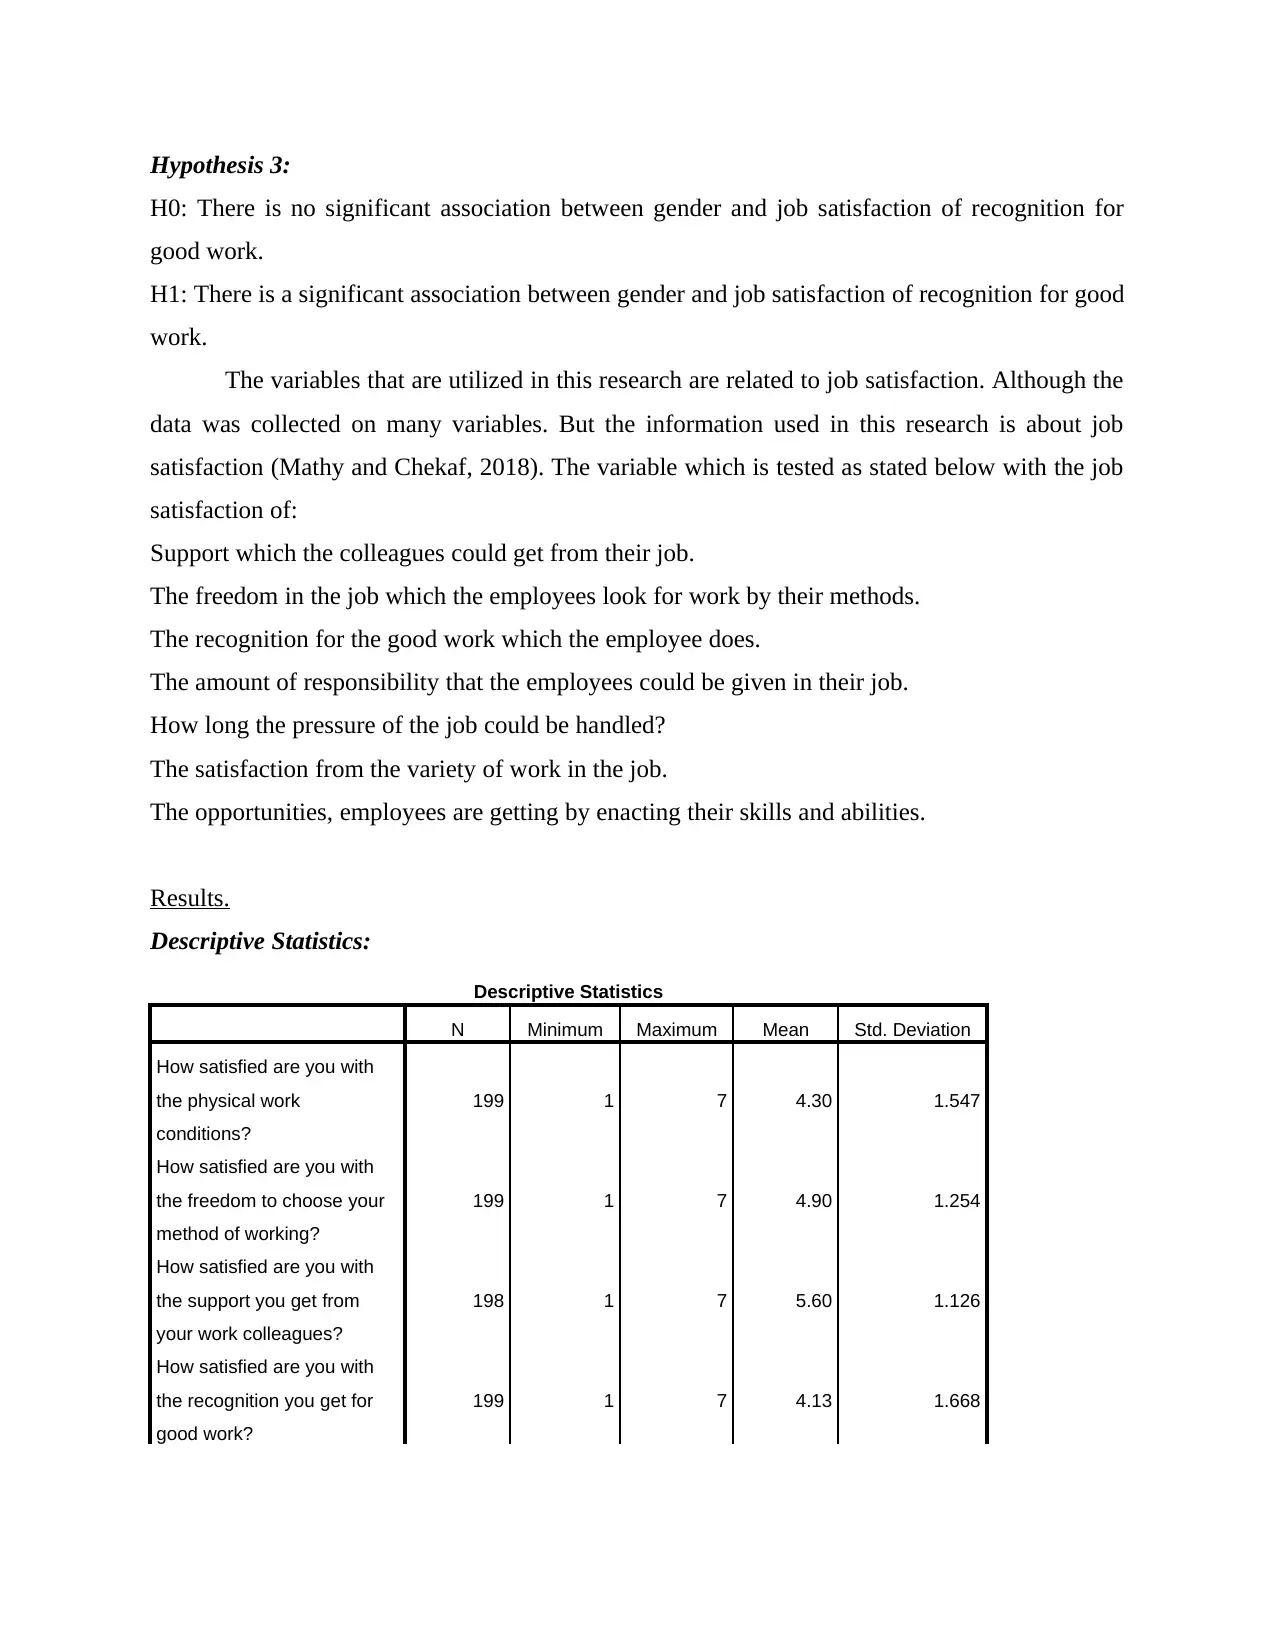
Hypothesis 3:
H0: There is no significant association between gender and job satisfaction of recognition for
good work.
H1: There is a significant association between gender and job satisfaction of recognition for good
work.
The variables that are utilized in this research are related to job satisfaction. Although the
data was collected on many variables. But the information used in this research is about job
satisfaction (Mathy and Chekaf, 2018). The variable which is tested as stated below with the job
satisfaction of:
Support which the colleagues could get from their job.
The freedom in the job which the employees look for work by their methods.
The recognition for the good work which the employee does.
The amount of responsibility that the employees could be given in their job.
How long the pressure of the job could be handled?
The satisfaction from the variety of work in the job.
The opportunities, employees are getting by enacting their skills and abilities.
Results.
Descriptive Statistics:
Descriptive Statistics
N Minimum Maximum Mean Std. Deviation
How satisfied are you with
the physical work
conditions?
199 1 7 4.30 1.547
How satisfied are you with
the freedom to choose your
method of working?
199 1 7 4.90 1.254
How satisfied are you with
the support you get from
your work colleagues?
198 1 7 5.60 1.126
How satisfied are you with
the recognition you get for
good work?
199 1 7 4.13 1.668
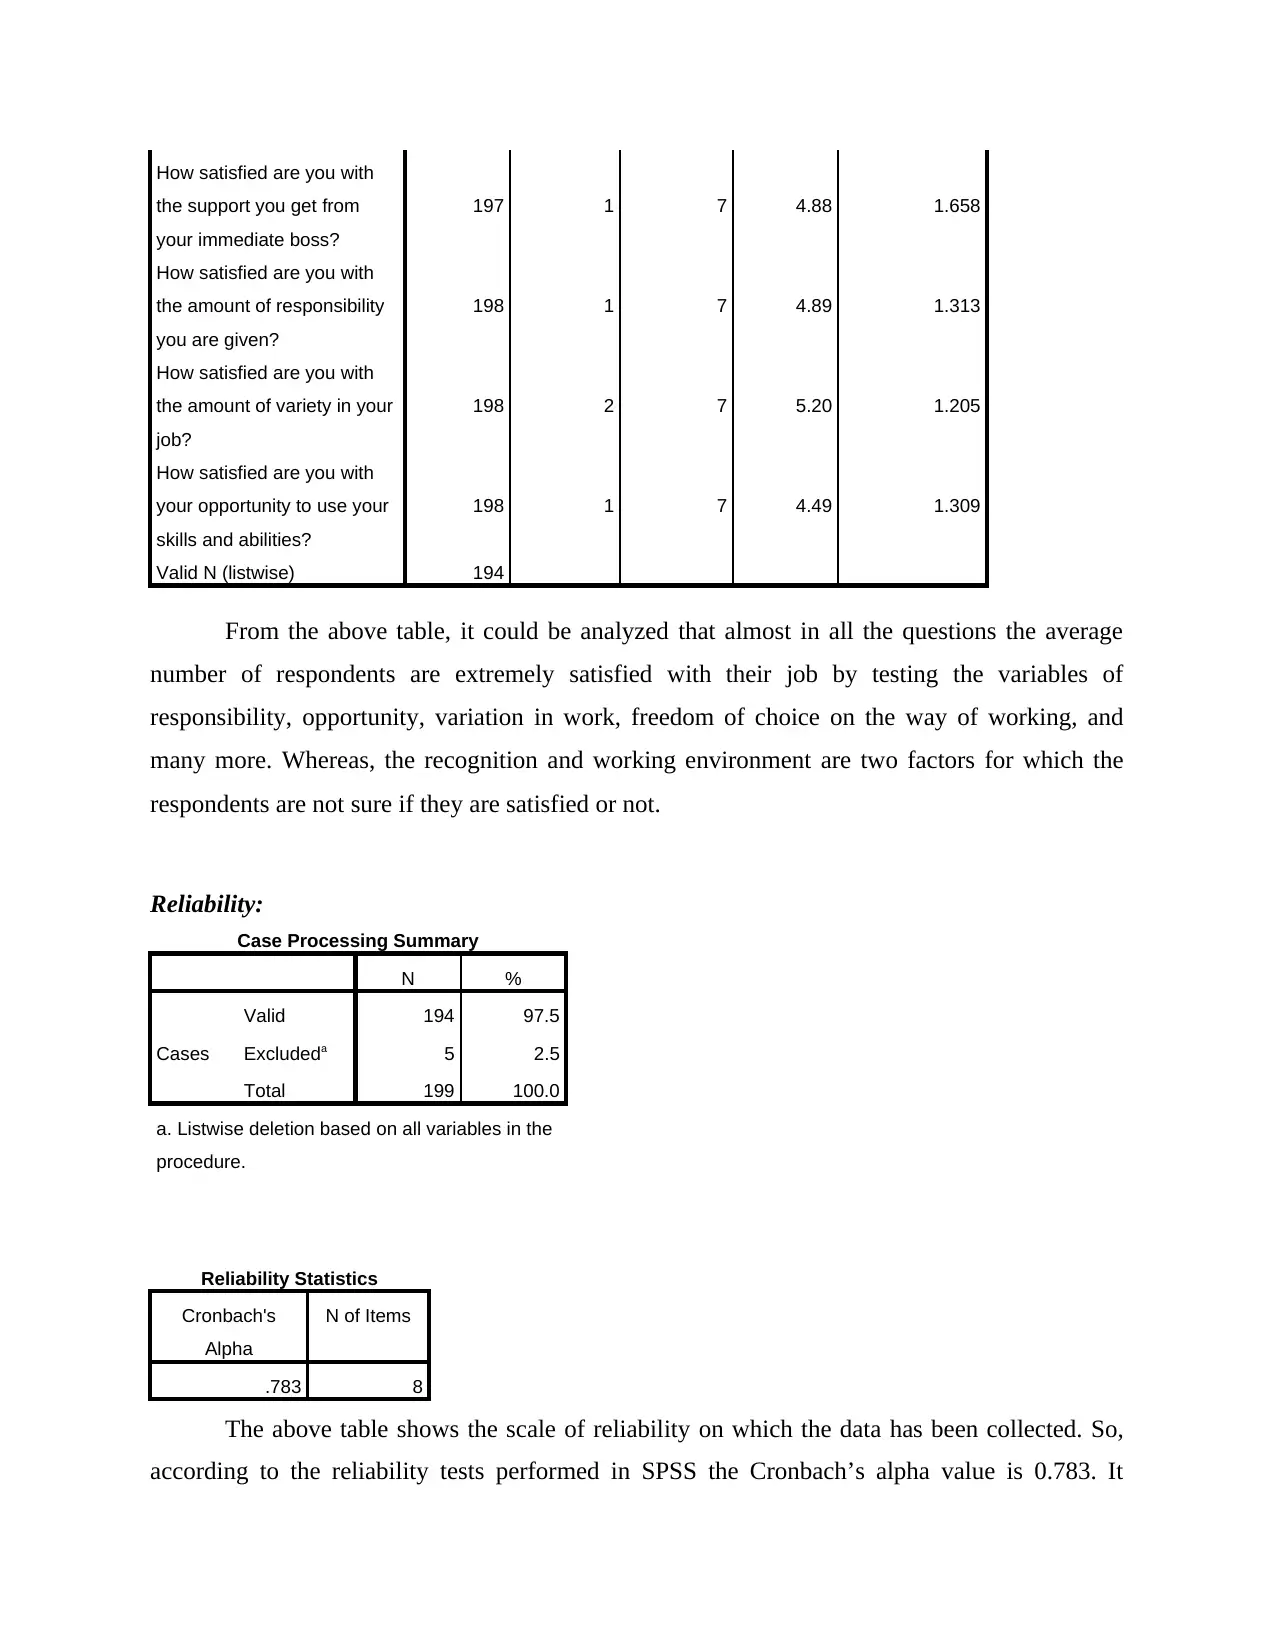
How satisfied are you with
the support you get from
your immediate boss?
197 1 7 4.88 1.658
How satisfied are you with
the amount of responsibility
you are given?
198 1 7 4.89 1.313
How satisfied are you with
the amount of variety in your
job?
198 2 7 5.20 1.205
How satisfied are you with
your opportunity to use your
skills and abilities?
198 1 7 4.49 1.309
Valid N (listwise) 194
From the above table, it could be analyzed that almost in all the questions the average
number of respondents are extremely satisfied with their job by testing the variables of
responsibility, opportunity, variation in work, freedom of choice on the way of working, and
many more. Whereas, the recognition and working environment are two factors for which the
respondents are not sure if they are satisfied or not.
Reliability:
Case Processing Summary
N %
Cases
Valid 194 97.5
Excludeda 5 2.5
Total 199 100.0
a. Listwise deletion based on all variables in the
procedure.
Reliability Statistics
Cronbach's
Alpha
N of Items
.783 8
The above table shows the scale of reliability on which the data has been collected. So,
according to the reliability tests performed in SPSS the Cronbach’s alpha value is 0.783. It
⊘ This is a preview!⊘
Do you want full access?
Subscribe today to unlock all pages.
Trusted by 1+ million students worldwide
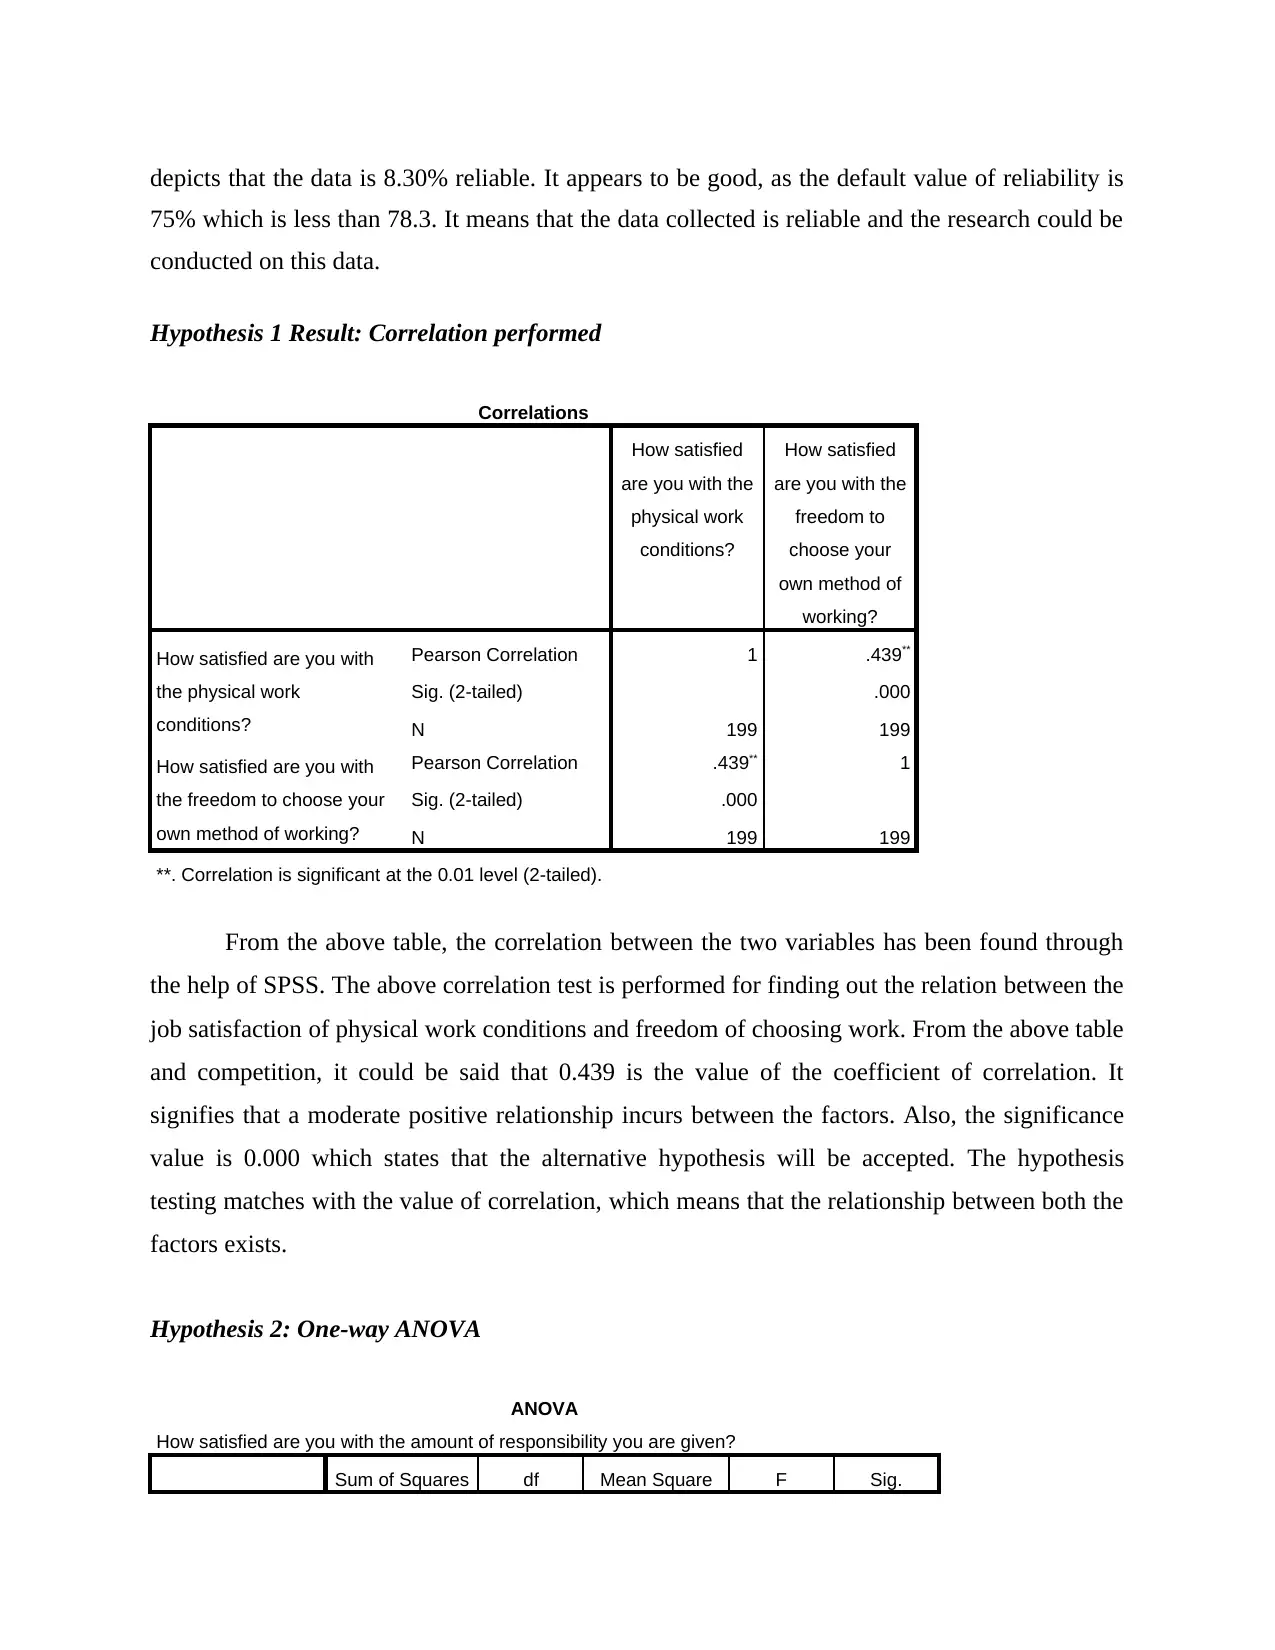
depicts that the data is 8.30% reliable. It appears to be good, as the default value of reliability is
75% which is less than 78.3. It means that the data collected is reliable and the research could be
conducted on this data.
Hypothesis 1 Result: Correlation performed
Correlations
How satisfied
are you with the
physical work
conditions?
How satisfied
are you with the
freedom to
choose your
own method of
working?
How satisfied are you with
the physical work
conditions?
Pearson Correlation 1 .439**
Sig. (2-tailed) .000
N 199 199
How satisfied are you with
the freedom to choose your
own method of working?
Pearson Correlation .439** 1
Sig. (2-tailed) .000
N 199 199
**. Correlation is significant at the 0.01 level (2-tailed).
From the above table, the correlation between the two variables has been found through
the help of SPSS. The above correlation test is performed for finding out the relation between the
job satisfaction of physical work conditions and freedom of choosing work. From the above table
and competition, it could be said that 0.439 is the value of the coefficient of correlation. It
signifies that a moderate positive relationship incurs between the factors. Also, the significance
value is 0.000 which states that the alternative hypothesis will be accepted. The hypothesis
testing matches with the value of correlation, which means that the relationship between both the
factors exists.
Hypothesis 2: One-way ANOVA
ANOVA
How satisfied are you with the amount of responsibility you are given?
Sum of Squares df Mean Square F Sig.
Paraphrase This Document
Need a fresh take? Get an instant paraphrase of this document with our AI Paraphraser
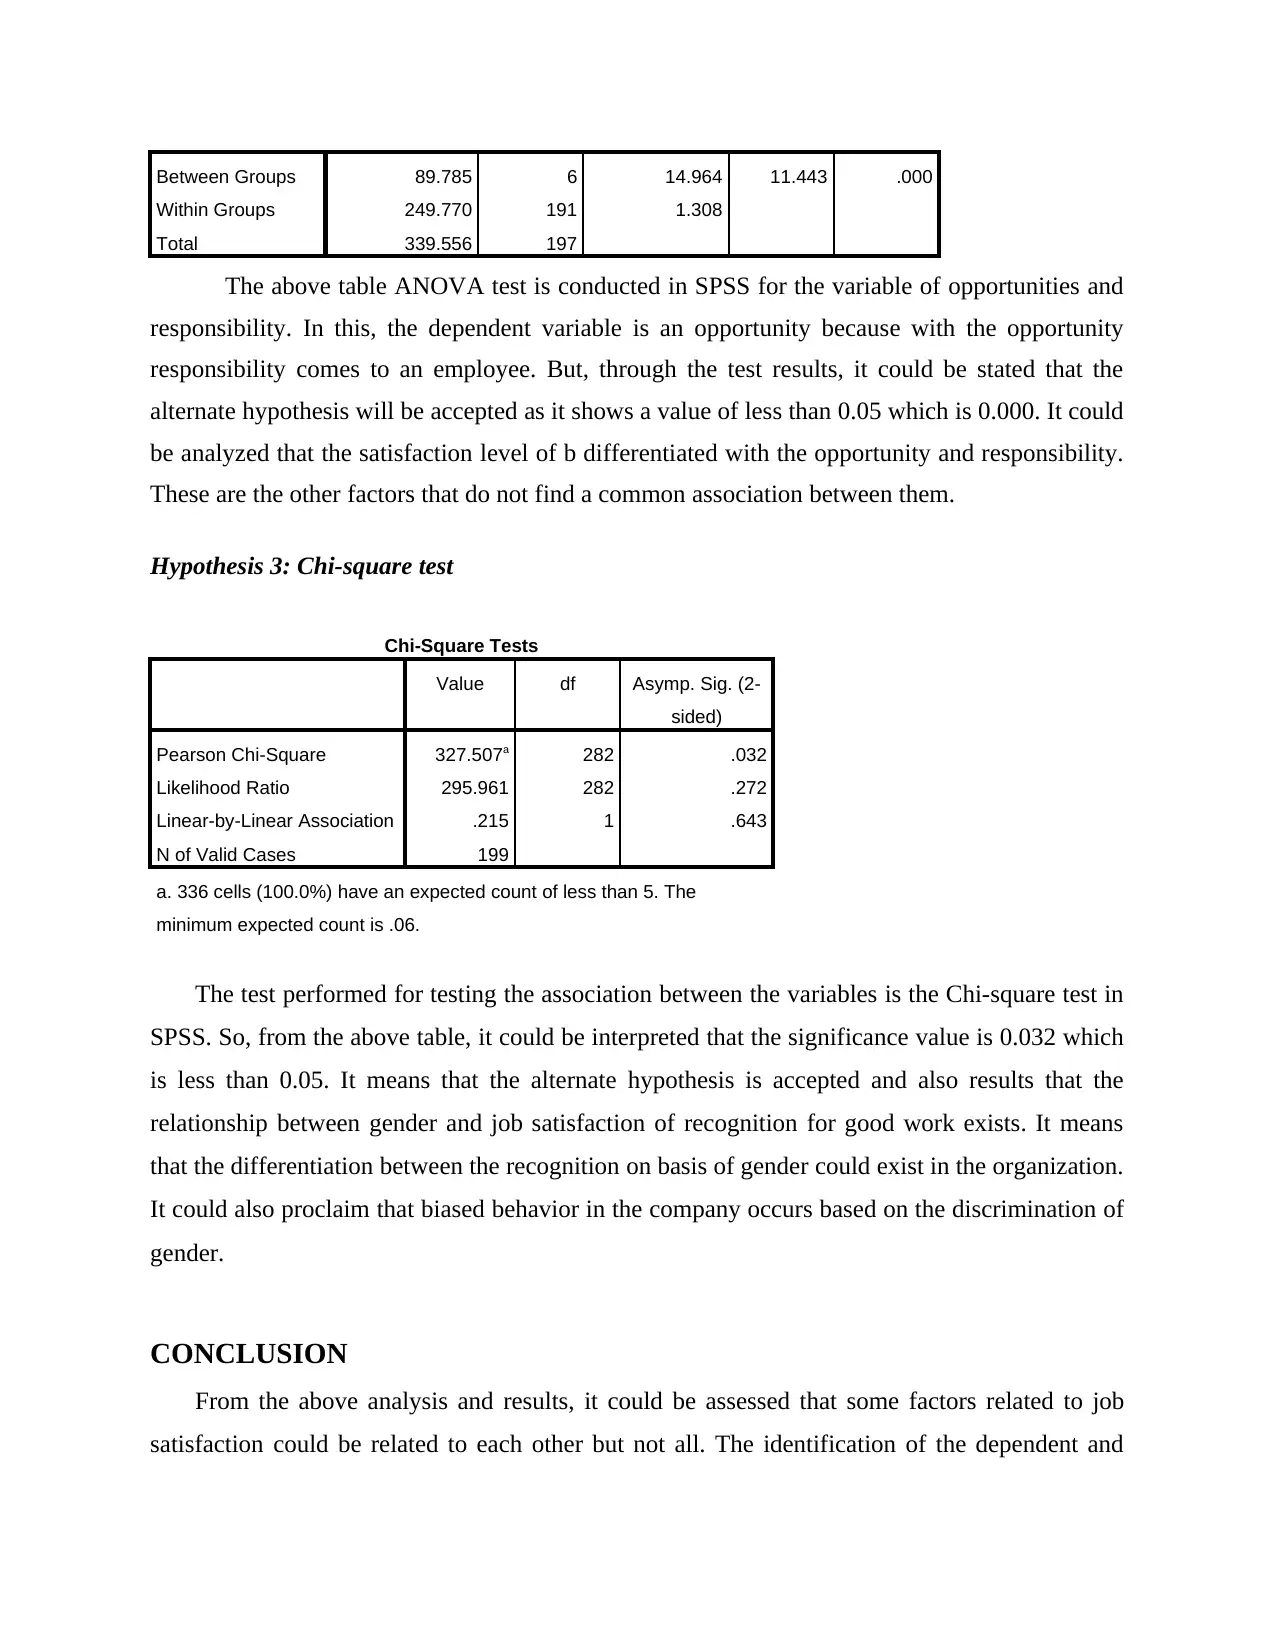
Between Groups 89.785 6 14.964 11.443 .000
Within Groups 249.770 191 1.308
Total 339.556 197
The above table ANOVA test is conducted in SPSS for the variable of opportunities and
responsibility. In this, the dependent variable is an opportunity because with the opportunity
responsibility comes to an employee. But, through the test results, it could be stated that the
alternate hypothesis will be accepted as it shows a value of less than 0.05 which is 0.000. It could
be analyzed that the satisfaction level of b differentiated with the opportunity and responsibility.
These are the other factors that do not find a common association between them.
Hypothesis 3: Chi-square test
Chi-Square Tests
Value df Asymp. Sig. (2-
sided)
Pearson Chi-Square 327.507a 282 .032
Likelihood Ratio 295.961 282 .272
Linear-by-Linear Association .215 1 .643
N of Valid Cases 199
a. 336 cells (100.0%) have an expected count of less than 5. The
minimum expected count is .06.
The test performed for testing the association between the variables is the Chi-square test in
SPSS. So, from the above table, it could be interpreted that the significance value is 0.032 which
is less than 0.05. It means that the alternate hypothesis is accepted and also results that the
relationship between gender and job satisfaction of recognition for good work exists. It means
that the differentiation between the recognition on basis of gender could exist in the organization.
It could also proclaim that biased behavior in the company occurs based on the discrimination of
gender.
CONCLUSION
From the above analysis and results, it could be assessed that some factors related to job
satisfaction could be related to each other but not all. The identification of the dependent and
independent factors is very essential. It only states and helps in finding the outcome of the
analysis. The main conclusion that can be drawn from the above analysis, is that the association
between the factors of gender and recognition exists. Gender discrimination is done in the
organization which in turn reduces the opportunities for enhancing and growing the abilities of
the employee disabled. It could affect the business environment and lead to an adverse impact on
the thinking of the employee. This should be lessened or removed from the organization’s
culture. Also, the hypothesis created usually were accepted by the alternate. It was surprising that
the relationship between gender and opportunity exists in companies in today’s time also.
⊘ This is a preview!⊘
Do you want full access?
Subscribe today to unlock all pages.
Trusted by 1+ million students worldwide
REFERENCES
Books and Journals
Bin-Tahir, S.Z. And et.al., 2018. The impact of translanguaging approach on teaching Arabic
reading in a multilingual classroom. Ijaz Arabi Journal of Arabic Learning, 1(1).
Daryanto, A., 2018. SPSS Heterogeneity Macro.
Mat Roni, S. and Djajadikerta, H.G., 2021. Assess the Quality of Your Instrument. In Data
Analysis with SPSS for Survey-based Research (pp. 69-88). Springer, Singapore.
Mathy, F. and Chekaf, M., 2018. Experiments and modeling in cognitive science: MATLAB,
SPSS, Excel and E-prime. Elsevier.
McCormick, K. and Salcedo, J., 2020. SPSS statistics for dummies. John Wiley & Sons.
Mulenga, D. and Siziya, S., 2019. Indoor air pollution related respiratory ill health, a sequel of
biomass use. SciMedicine Journal. 1(1), pp.30-37.
Tang, L.X. And et.al., 2018. Long non-coding RNA OGFRP1 regulates LYPD3 expression by
sponging miR-124-3p and promotes non-small cell lung cancer progression.
Biochemical and biophysical research communications. 505(2). pp.578-585.
Terzioğlu, C. and Özkan, B., 2018. Psychodrama and the emotional state of women dealing with
infertility. 36(1). pp.87-99.
Wada, O. and et.al., 2020. Structural severity, phase angle, and quadriceps strength among
patients with knee osteoarthritis: the SPSS-OK study. Clinical rheumatology. 39(10).
pp.3049-3056.
Woolf, E., Zhu, Y., Emory, K., Zhao, J. and Liu, C., 2019. Willingness to consume insect-
containing foods: A survey in the United States. Lwt. 10. pp.100-105.
An Analysis of the Relationship Between Job Satisfaction and Employee Engagement, 2017.
[Online] Available through
<https://www.researchgate.net/publication/318656620_An_Analysis_of_the_Relationsh
ip_Between_Job_Satisfaction_and_Employee_Engagement>
Analysis of Impact of training on employees’ performance using SPSS, 2020. [Online] Available
through
<https://www.researchgate.net/publication/339884385_Analysis_of_Impact_of_training
_on_employees'_performance_using_SPSS-A_case_of_Da_Afghanistan_Bank>
Paraphrase This Document
Need a fresh take? Get an instant paraphrase of this document with our AI Paraphraser

1 out of 11
Related Documents


Your All-in-One AI-Powered Toolkit for Academic Success.
+13062052269
info@desklib.com
Available 24*7 on WhatsApp / Email
![[object Object]](/_next/static/media/star-bottom.7253800d.svg)
Unlock your academic potential
Copyright © 2020–2026 A2Z Services. All Rights Reserved. Developed and managed by ZUCOL.