Comprehensive Report on Job Satisfaction: Analysis and Recommendations
VerifiedAdded on 2023/04/26
|73
|11496
|78
Report
AI Summary
This report provides a detailed analysis of job satisfaction, exploring various factors that influence it, such as the nature of the job, management styles, social relationships, and personal adjustment. It highlights the importance of job satisfaction for employee retention, productivity, and overall company success. The report discusses business intelligence requirements, including the challenges faced by human resource managers, and the methods used to analyze data, such as Microsoft Excel, statistical tools like regression, variance, correlation, covariance, Chi-square, Z-test, and T-test. The analysis includes calculations of variance, standard deviation, covariance, correlation, and regression, along with Chi-square and Z-test results to assess the relationships between different variables. The findings indicate the impact of training on job satisfaction and the dependence of marital status on promotion. The report concludes with recommendations based on the analysis, emphasizing the importance of creating a positive work environment and addressing the challenges in human resource management to enhance employee satisfaction and organizational outcomes.
1
Running head: Job satisfaction
Job satisfaction
First name, Last name
Institution
Running head: Job satisfaction
Job satisfaction
First name, Last name
Institution
Paraphrase This Document
Need a fresh take? Get an instant paraphrase of this document with our AI Paraphraser
2
Job satisfaction
Introduction
Job satisfaction is regarded as one’s state of mind or feeling based on the status of their work.
Job status can be affected by numerous factors which may include; quality relationship between
the employee and supervisor, quality of working environment and the level of work fulfillments.
Job satisfaction can also be categorized as positive attitude of employee towards job, whereas
variation of negative attitudes can be categorized job dissatisfaction. Therefore, job satisfaction
may be regarded as an attitude that may result from combination and balancing of numerous
dislikes and likes experience in job. In addition, job evaluation may depend upon one’s failure or
success in achieving personal objectives and upon apparent combination of the job and its end.
According to Valentine et al., (2011), the satisfaction of any employee’s feelings to a particular
job can be classified into four summation sections. These include:
1. Job - nature of job (dangerous, dull or interesting), working hours, relationship with
other workers, job opportunities (promotion or prospectus), overtime regulation, machine
and tools and physical environment.
2. Management – supervisory treatment, participation, punishment and rewards, favoritism
and leave policies and blames and praises.
3. Social relationship – neighbors, friends, social activities participation, associates, caste
barrier and attitude towards community.
4. Personal adjustment - emotionality and health.
Job satisfaction is a fundamental pointer of how employees will feel about the job assigned for
and also predicts the workers behaviors in regards to their job turnover, absenteeism, citizenship,
the benefit of job satisfaction and work morale.
The labor force offered by employees in an organization is a key asset. Their departure or
withdraw could result to a significant effect that may hinder organization’s business objectives
and plans. This may ultimately result to a decline to productivity. Therefore, employee
satisfaction is fundamental in success and growth of a company. A positive satisfaction would
satisfy customers’ service and effective business planning. This would also progress the
confidence of the investors this is because they are always concern with appropriate employees
capacity performance. Job satisfaction is directly related to talent since a creative brain could be
caused by happy brain. Employee’s happiness is an aspiration to talent management since it
greatly influences creativity, loyalty and productivity of the employees.
Importance of job satisfaction
Satisfaction of job ensures recruitment of a right employees and their retention in an
organization. This also ensures productivity is maintained by keeping the employees constantly
motivated and engaged. Job satisfaction also controls negative effects of conflicts and stress that
3
Job satisfaction
minimizes labor turnover for employees. To ensure that this would materialize a work
environment is created from range of factors which includes; management styles, company
culture, human resources and hierarchies policies. Employees’ satisfaction is a fulfillment of
personal feeling and satisfied in their job. Employees turnover is regarded as the rate in which an
employee withdraw from job either voluntary or involuntarily. Therefore, positive work
environment directly decrease turnover and increase employees satisfactory.
Secondly, personal respect at all stages of the company is an integrated part of ensuring positive
work environment. Personal respect protects works from sexual harassment, discrimination
based on gender, age or ethnic background. Therefore, the more respect employees are given at
the work place, then the more they will be satisfied with the job. A lack of respect may result to
employees quitting the job and increase in turnover.
Thirdly, growth opportunities offered to employees’ plays an important role on work
environment.
Fourthly, management style applied by the managers and owners directly influences the company
productivity. Managers can apply collaborative management style by working together with his or
her subordinate in order to accomplish a particular task. Managers can also apply facilitative styles
by ensuring that employees will always have the right material, tools and prompt information about
the job. Managers can also apply coercive style to manage every employee’s move. The best
management style will rely on a given situation and the nature of work that is performed.
Lastly, the company culture includes the procedural ways in which conflicts are solved and
handled, the communication style, policies on dress code and other details. The culture of a
company must fit with status of employees in order to increase job satisfaction.
.
⊘ This is a preview!⊘
Do you want full access?
Subscribe today to unlock all pages.
Trusted by 1+ million students worldwide
4
Job satisfaction
Business intelligence required
The department of human resource management is classified as a field where innovative trends
are supposed to be focused, in order to capitalize on employees’ skill, knowledge, ability and job
satisfaction. These characteristics are aimed at accomplishing the company’s objectives and
goals. Many have argued that human resource job is amongst the difficult positions one may hold
in an organization. This is because their responsibilities lies on ensuring that the right personnel
is either employed or hired for the right work, this generally will have a direct impact on the
company (Stone and Deadrick, 2015).
Human resource management has been adapting itself to changes of work environment, but the
changes have never been fully solved, since they still take place. The human resource challenge
includes:
1. Many companies have been facing difficulty in retaining high rate of labor turnover, to
control this human resource manager are required to take action
2. The multi-cultural companies operates in different nations, therefore their companies
work force will be associated with people from different cultures. Human resource
manager will find it hard to deal with all the needs of this people at once.
3. Human resource manager faces difficulty in providing an environment for physically
handicapped employees. Since few companies provide job and facilities that are
designed to handicapped employees.
4. Human resource managers have been facing challenges to appropriately retrench
workers without hurting and antagonizing the workers and their unions.
Method used
The method used in analyzing the sample data was Microsoft excel. The importance of using
excel is categorized into two which includes; cost and convenience. Though, using excel in
analyzing the statistical data requires knowledge of data analysis, clarity and strong decision
skills.
Statistical descriptive tool in add – in data analysis is used in analyzing existing data; it also
helps in giving a general trend of idea on the sample data including:
The mode, mean, range and median
Standard deviation and variance
Maximum and minimum
Z – score
T-score
Paraphrase This Document
Need a fresh take? Get an instant paraphrase of this document with our AI Paraphraser
5
Job satisfaction
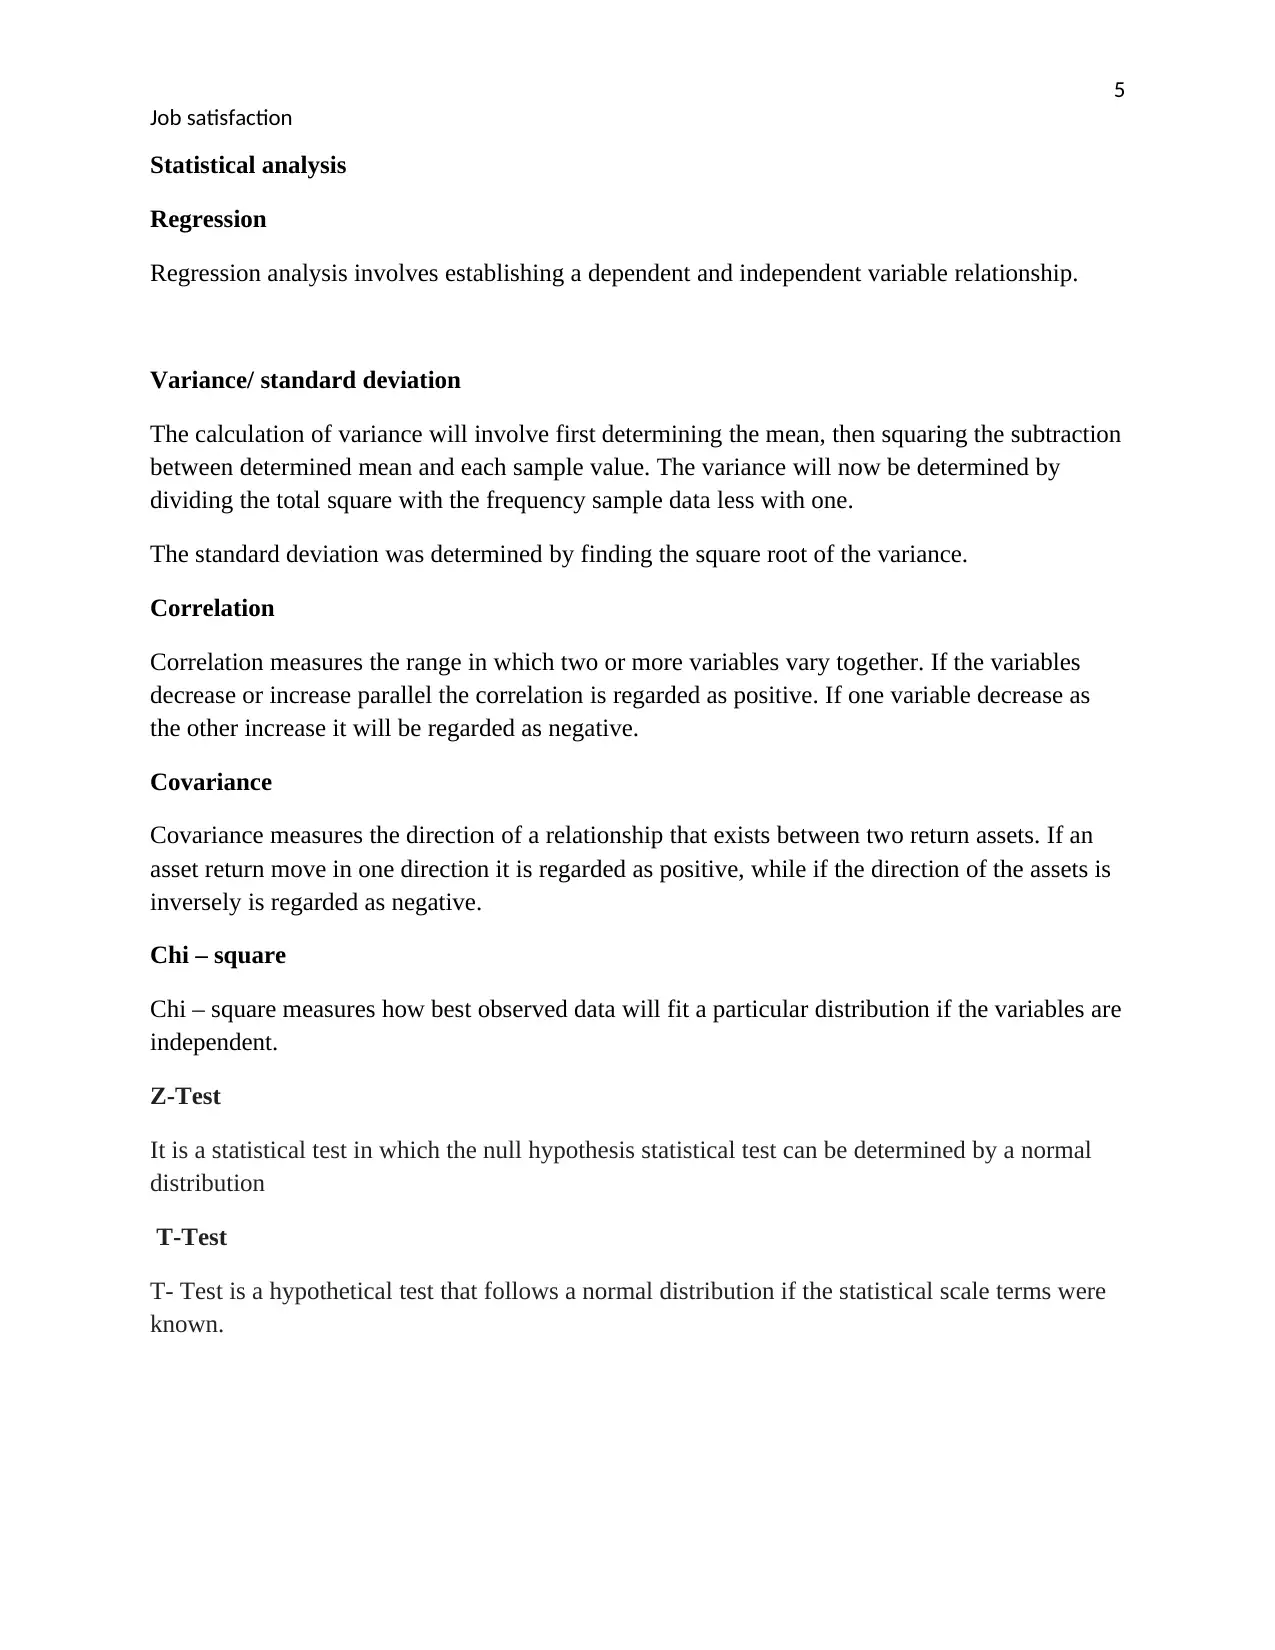
Statistical analysis
Regression
Regression analysis involves establishing a dependent and independent variable relationship.
Variance/ standard deviation
The calculation of variance will involve first determining the mean, then squaring the subtraction
between determined mean and each sample value. The variance will now be determined by
dividing the total square with the frequency sample data less with one.
The standard deviation was determined by finding the square root of the variance.
Correlation
Correlation measures the range in which two or more variables vary together. If the variables
decrease or increase parallel the correlation is regarded as positive. If one variable decrease as
the other increase it will be regarded as negative.
Covariance
Covariance measures the direction of a relationship that exists between two return assets. If an
asset return move in one direction it is regarded as positive, while if the direction of the assets is
inversely is regarded as negative.
Chi – square
Chi – square measures how best observed data will fit a particular distribution if the variables are
independent.
Z-Test
It is a statistical test in which the null hypothesis statistical test can be determined by a normal
distribution
T-Test
T- Test is a hypothetical test that follows a normal distribution if the statistical scale terms were
known.
Job satisfaction
Statistical analysis
Regression
Regression analysis involves establishing a dependent and independent variable relationship.
Variance/ standard deviation
The calculation of variance will involve first determining the mean, then squaring the subtraction
between determined mean and each sample value. The variance will now be determined by
dividing the total square with the frequency sample data less with one.
The standard deviation was determined by finding the square root of the variance.
Correlation
Correlation measures the range in which two or more variables vary together. If the variables
decrease or increase parallel the correlation is regarded as positive. If one variable decrease as
the other increase it will be regarded as negative.
Covariance
Covariance measures the direction of a relationship that exists between two return assets. If an
asset return move in one direction it is regarded as positive, while if the direction of the assets is
inversely is regarded as negative.
Chi – square
Chi – square measures how best observed data will fit a particular distribution if the variables are
independent.
Z-Test
It is a statistical test in which the null hypothesis statistical test can be determined by a normal
distribution
T-Test
T- Test is a hypothetical test that follows a normal distribution if the statistical scale terms were
known.
6
Job satisfaction
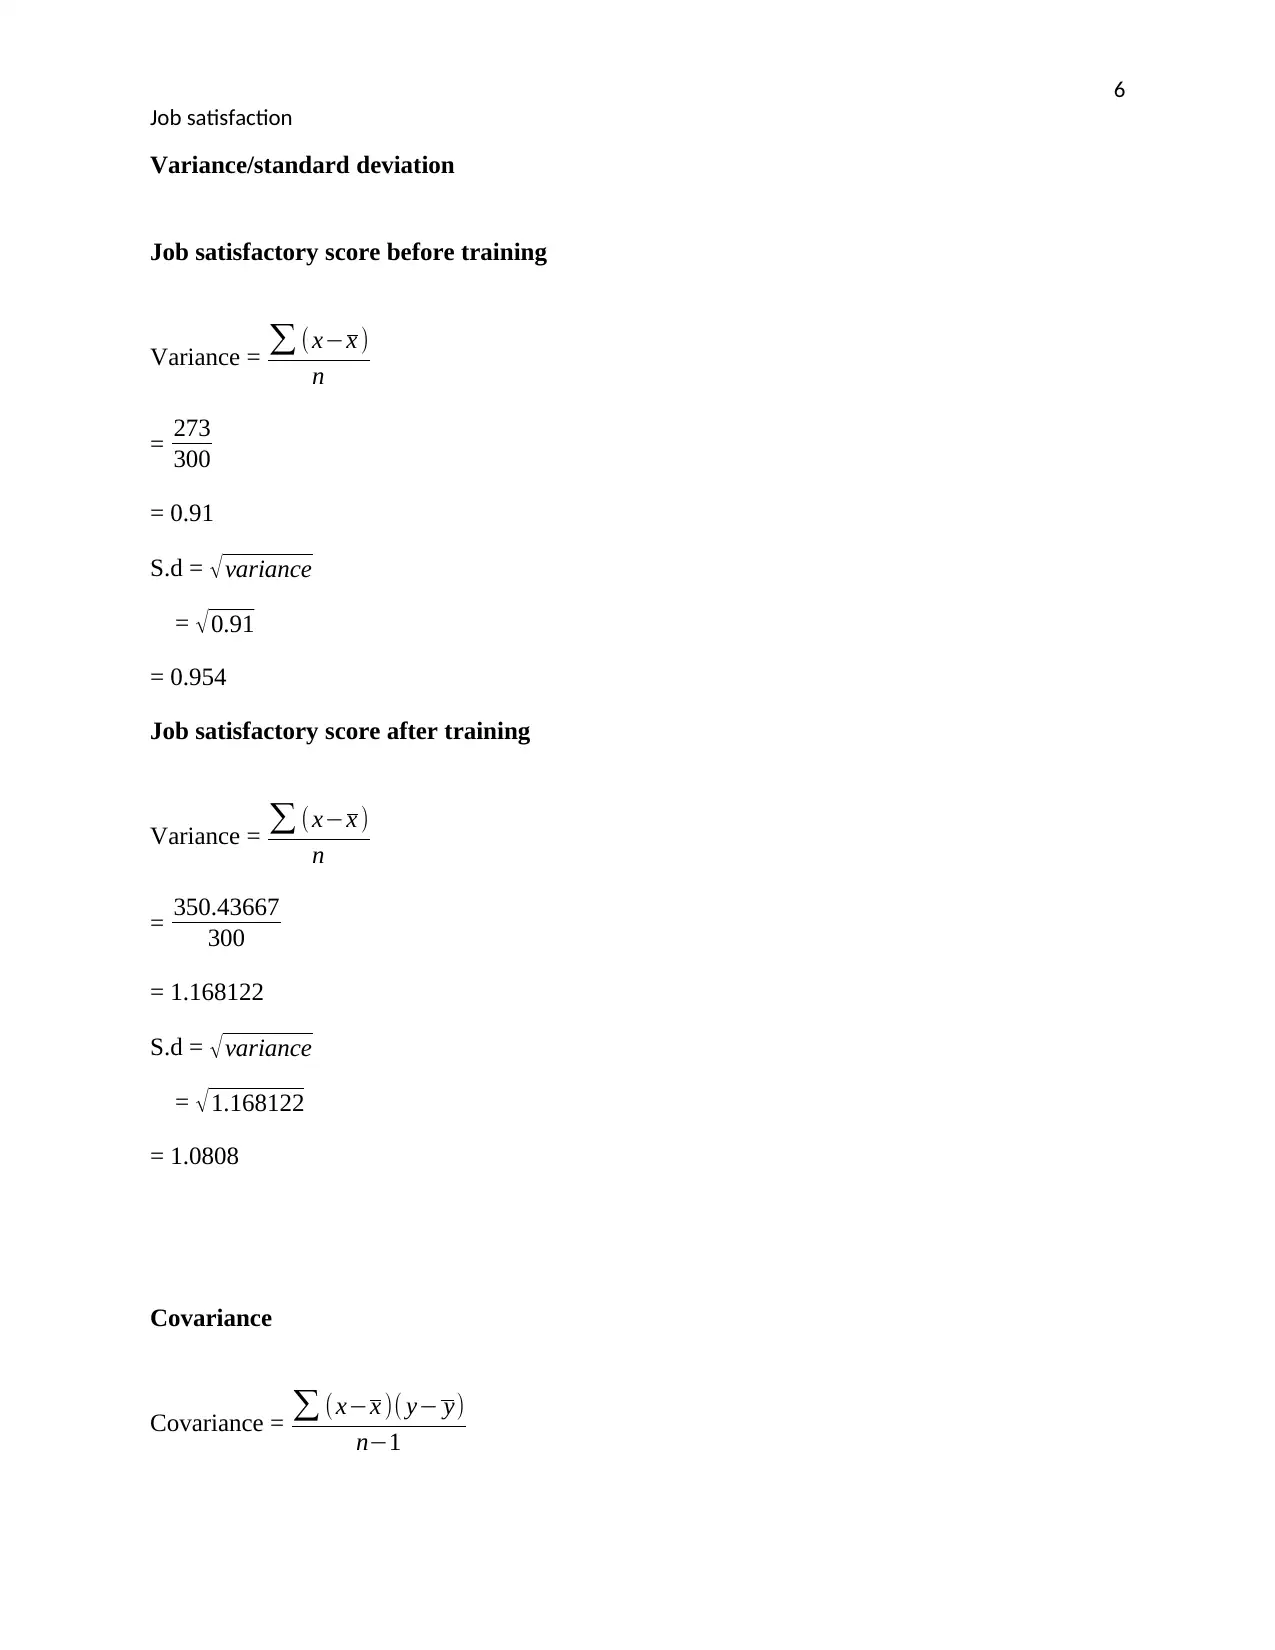
Variance/standard deviation
Job satisfactory score before training
Variance = ∑ (x−x )
n
= 273
300
= 0.91
S.d = √variance
= √0.91
= 0.954
Job satisfactory score after training
Variance = ∑ (x−x )
n
= 350.43667
300
= 1.168122
S.d = √variance
= √1.168122
= 1.0808
Covariance
Covariance = ∑ ( x−x )( y− y)
n−1
Job satisfaction
Variance/standard deviation
Job satisfactory score before training
Variance = ∑ (x−x )
n
= 273
300
= 0.91
S.d = √variance
= √0.91
= 0.954
Job satisfactory score after training
Variance = ∑ (x−x )
n
= 350.43667
300
= 1.168122
S.d = √variance
= √1.168122
= 1.0808
Covariance
Covariance = ∑ ( x−x )( y− y)
n−1
⊘ This is a preview!⊘
Do you want full access?
Subscribe today to unlock all pages.
Trusted by 1+ million students worldwide
7
Job satisfaction
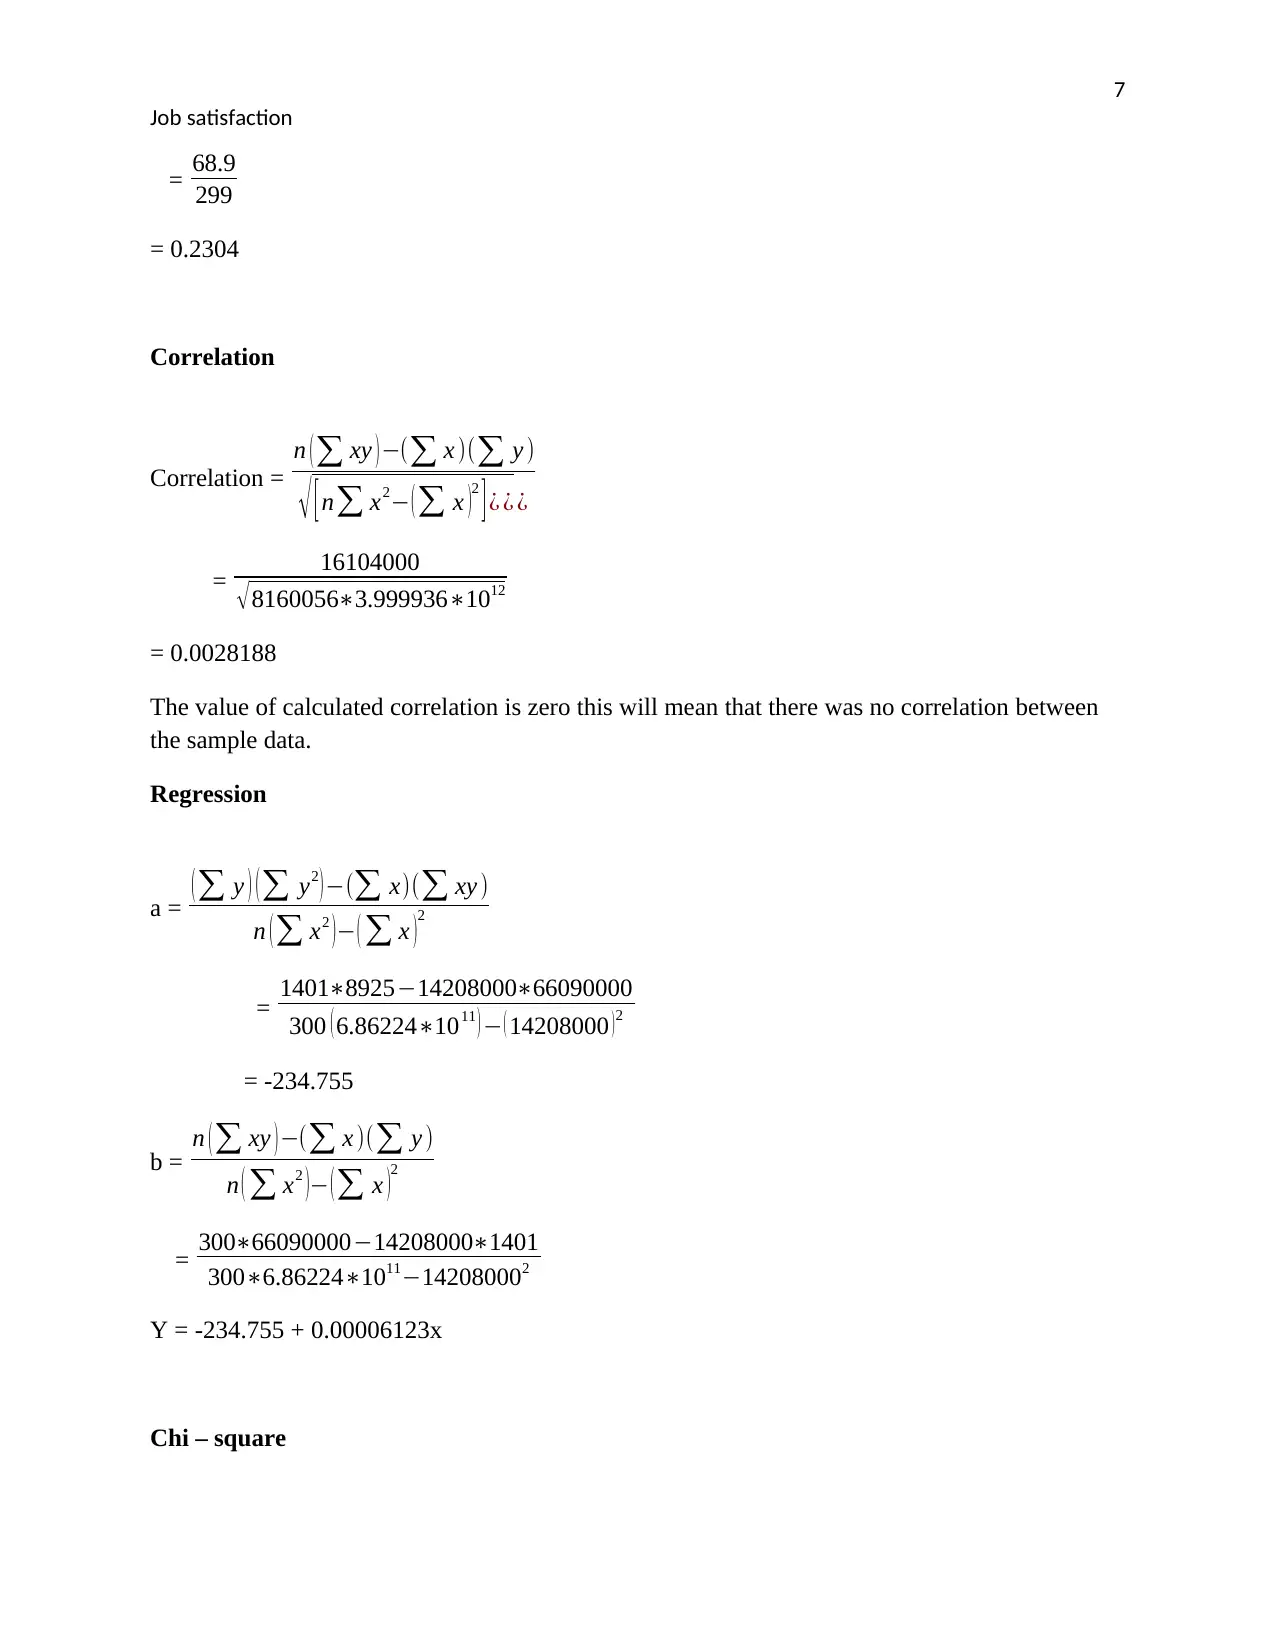
= 68.9
299
= 0.2304
Correlation
Correlation =
n (∑ xy )−(∑ x )(∑ y )
√ [ n∑ x2− (∑ x )2
] ¿ ¿ ¿
= 16104000
√ 8160056∗3.999936∗1012
= 0.0028188
The value of calculated correlation is zero this will mean that there was no correlation between
the sample data.
Regression
a = (∑ y ) (∑ y2 )−(∑ x)(∑ xy )
n (∑ x2 )− ( ∑ x )2
= 1401∗8925−14208000∗66090000
300 ( 6.86224∗1011 ) − ( 14208000 )2
= -234.755
b = n (∑ xy )−(∑ x )(∑ y )
n ( ∑ x2 )− (∑ x )2
= 300∗66090000−14208000∗1401
300∗6.86224∗1011−142080002
Y = -234.755 + 0.00006123x
Chi – square
Job satisfaction
= 68.9
299
= 0.2304
Correlation
Correlation =
n (∑ xy )−(∑ x )(∑ y )
√ [ n∑ x2− (∑ x )2
] ¿ ¿ ¿
= 16104000
√ 8160056∗3.999936∗1012
= 0.0028188
The value of calculated correlation is zero this will mean that there was no correlation between
the sample data.
Regression
a = (∑ y ) (∑ y2 )−(∑ x)(∑ xy )
n (∑ x2 )− ( ∑ x )2
= 1401∗8925−14208000∗66090000
300 ( 6.86224∗1011 ) − ( 14208000 )2
= -234.755
b = n (∑ xy )−(∑ x )(∑ y )
n ( ∑ x2 )− (∑ x )2
= 300∗66090000−14208000∗1401
300∗6.86224∗1011−142080002
Y = -234.755 + 0.00006123x
Chi – square
Paraphrase This Document
Need a fresh take? Get an instant paraphrase of this document with our AI Paraphraser
8
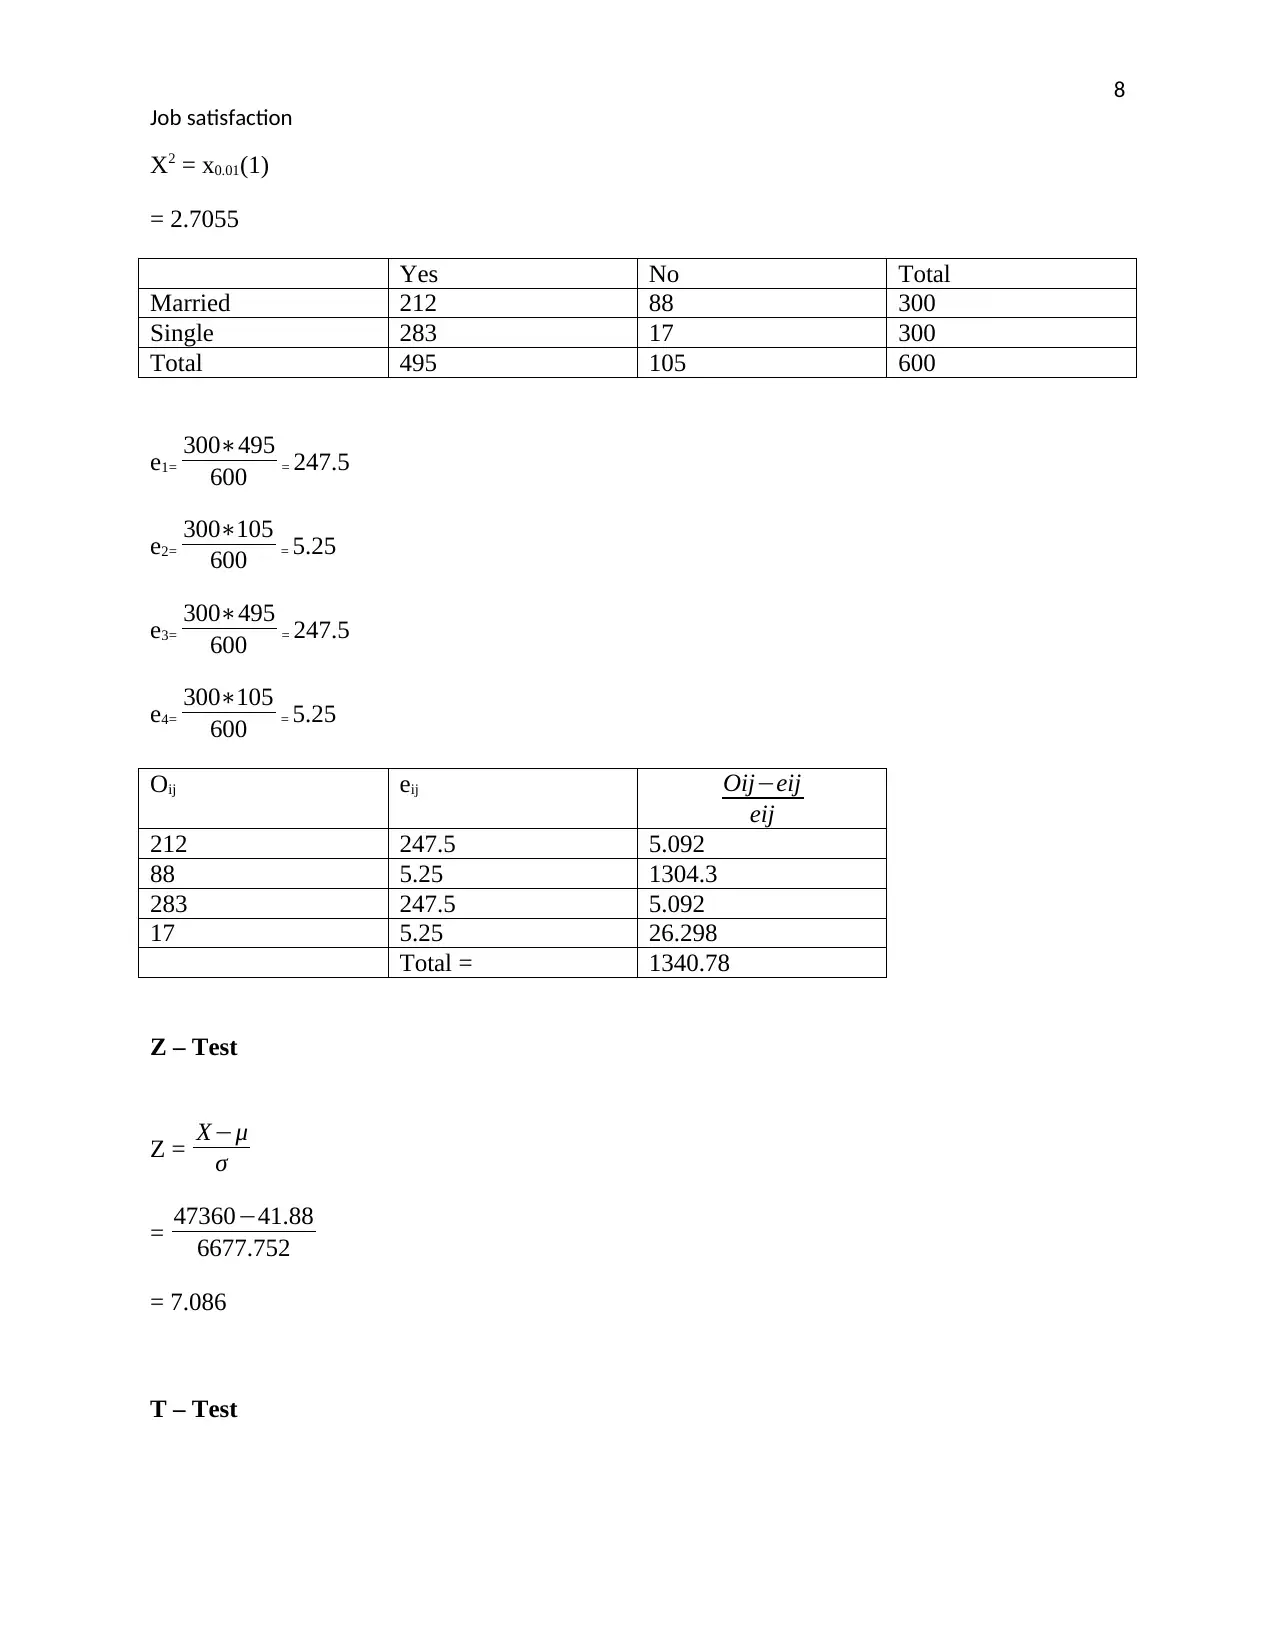
Job satisfaction
X2 = x0.01(1)
= 2.7055
Yes No Total
Married 212 88 300
Single 283 17 300
Total 495 105 600
e1=
300∗495
600 = 247.5
e2=
300∗105
600 = 5.25
e3=
300∗495
600 = 247.5
e4=
300∗105
600 = 5.25
Oij eij Oij−eij
eij
212 247.5 5.092
88 5.25 1304.3
283 247.5 5.092
17 5.25 26.298
Total = 1340.78
Z – Test
Z = X−μ
σ
= 47360−41.88
6677.752
= 7.086
T – Test
9
Job satisfaction
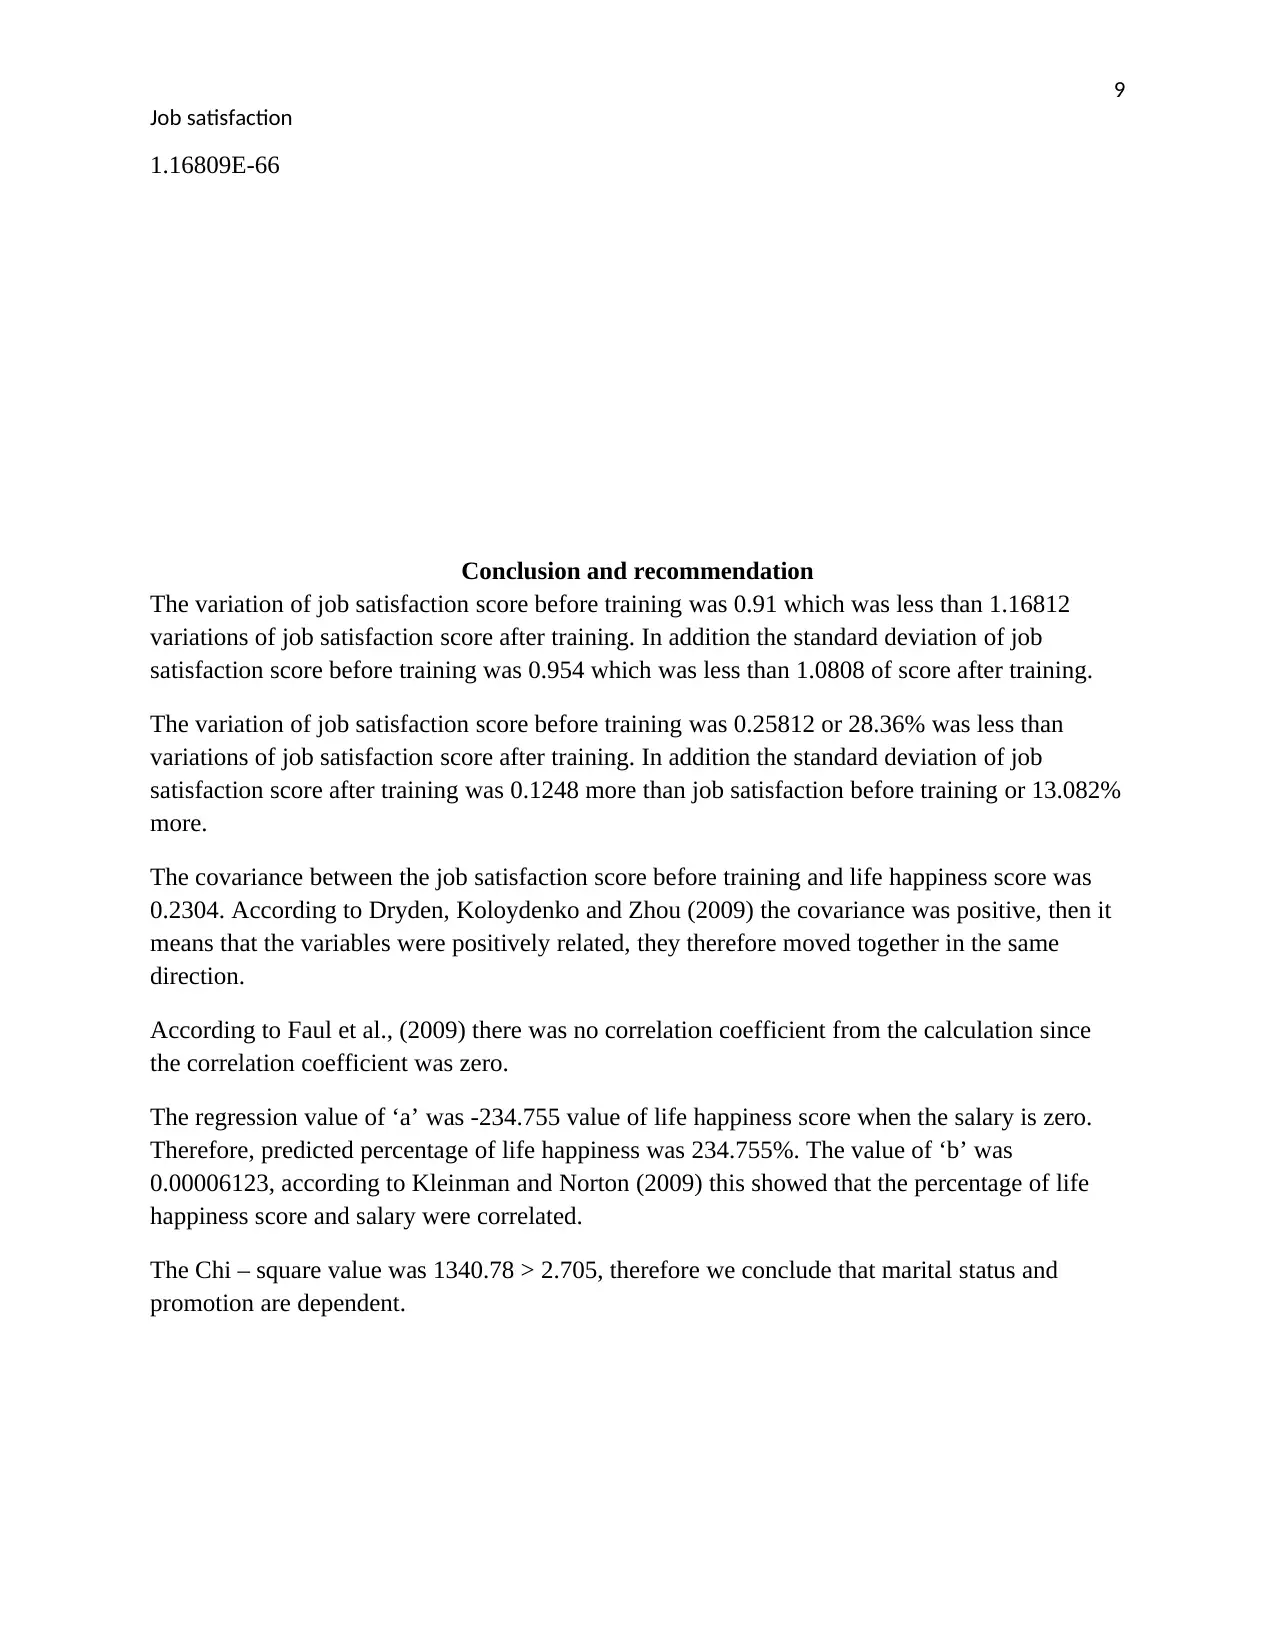
1.16809E-66
Conclusion and recommendation
The variation of job satisfaction score before training was 0.91 which was less than 1.16812
variations of job satisfaction score after training. In addition the standard deviation of job
satisfaction score before training was 0.954 which was less than 1.0808 of score after training.
The variation of job satisfaction score before training was 0.25812 or 28.36% was less than
variations of job satisfaction score after training. In addition the standard deviation of job
satisfaction score after training was 0.1248 more than job satisfaction before training or 13.082%
more.
The covariance between the job satisfaction score before training and life happiness score was
0.2304. According to Dryden, Koloydenko and Zhou (2009) the covariance was positive, then it
means that the variables were positively related, they therefore moved together in the same
direction.
According to Faul et al., (2009) there was no correlation coefficient from the calculation since
the correlation coefficient was zero.
The regression value of ‘a’ was -234.755 value of life happiness score when the salary is zero.
Therefore, predicted percentage of life happiness was 234.755%. The value of ‘b’ was
0.00006123, according to Kleinman and Norton (2009) this showed that the percentage of life
happiness score and salary were correlated.
The Chi – square value was 1340.78 > 2.705, therefore we conclude that marital status and
promotion are dependent.
Job satisfaction
1.16809E-66
Conclusion and recommendation
The variation of job satisfaction score before training was 0.91 which was less than 1.16812
variations of job satisfaction score after training. In addition the standard deviation of job
satisfaction score before training was 0.954 which was less than 1.0808 of score after training.
The variation of job satisfaction score before training was 0.25812 or 28.36% was less than
variations of job satisfaction score after training. In addition the standard deviation of job
satisfaction score after training was 0.1248 more than job satisfaction before training or 13.082%
more.
The covariance between the job satisfaction score before training and life happiness score was
0.2304. According to Dryden, Koloydenko and Zhou (2009) the covariance was positive, then it
means that the variables were positively related, they therefore moved together in the same
direction.
According to Faul et al., (2009) there was no correlation coefficient from the calculation since
the correlation coefficient was zero.
The regression value of ‘a’ was -234.755 value of life happiness score when the salary is zero.
Therefore, predicted percentage of life happiness was 234.755%. The value of ‘b’ was
0.00006123, according to Kleinman and Norton (2009) this showed that the percentage of life
happiness score and salary were correlated.
The Chi – square value was 1340.78 > 2.705, therefore we conclude that marital status and
promotion are dependent.
⊘ This is a preview!⊘
Do you want full access?
Subscribe today to unlock all pages.
Trusted by 1+ million students worldwide
10
Job satisfaction
References
Dryden, I. L., Koloydenko, A., & Zhou, D. (2009). Non-Euclidean statistics for covariance
matrices, with applications to diffusion tensor imaging. The Annals of Applied
Statistics, 3(3), 1102-1123.
Faul, F., Erdfelder, E., Buchner, A., & Lang, A. G. (2009). Statistical power analyses using G*
Power 3.1: Tests for correlation and regression analyses. Behavior research
methods, 41(4), 1149-1160.
Kleinman, L. C., & Norton, E. C. (2009). What's the risk? A simple approach for estimating
adjusted risk measures from nonlinear models including logistic regression. Health
services research, 44(1), 288-302.
Valentine, S., Godkin, L., Fleischman, G. M., & Kidwell, R. (2011). Corporate ethical values,
group creativity, job satisfaction and turnover intention: The impact of work context on
work response. Journal of Business Ethics, 98(3), 353-372.
Stone, D. L., & Deadrick, D. L. (2015). Challenges and opportunities affecting the future of
human resource management. Human Resource Management Review, 25(2), 139-145
Paraphrase This Document
Need a fresh take? Get an instant paraphrase of this document with our AI Paraphraser
11
Job satisfaction
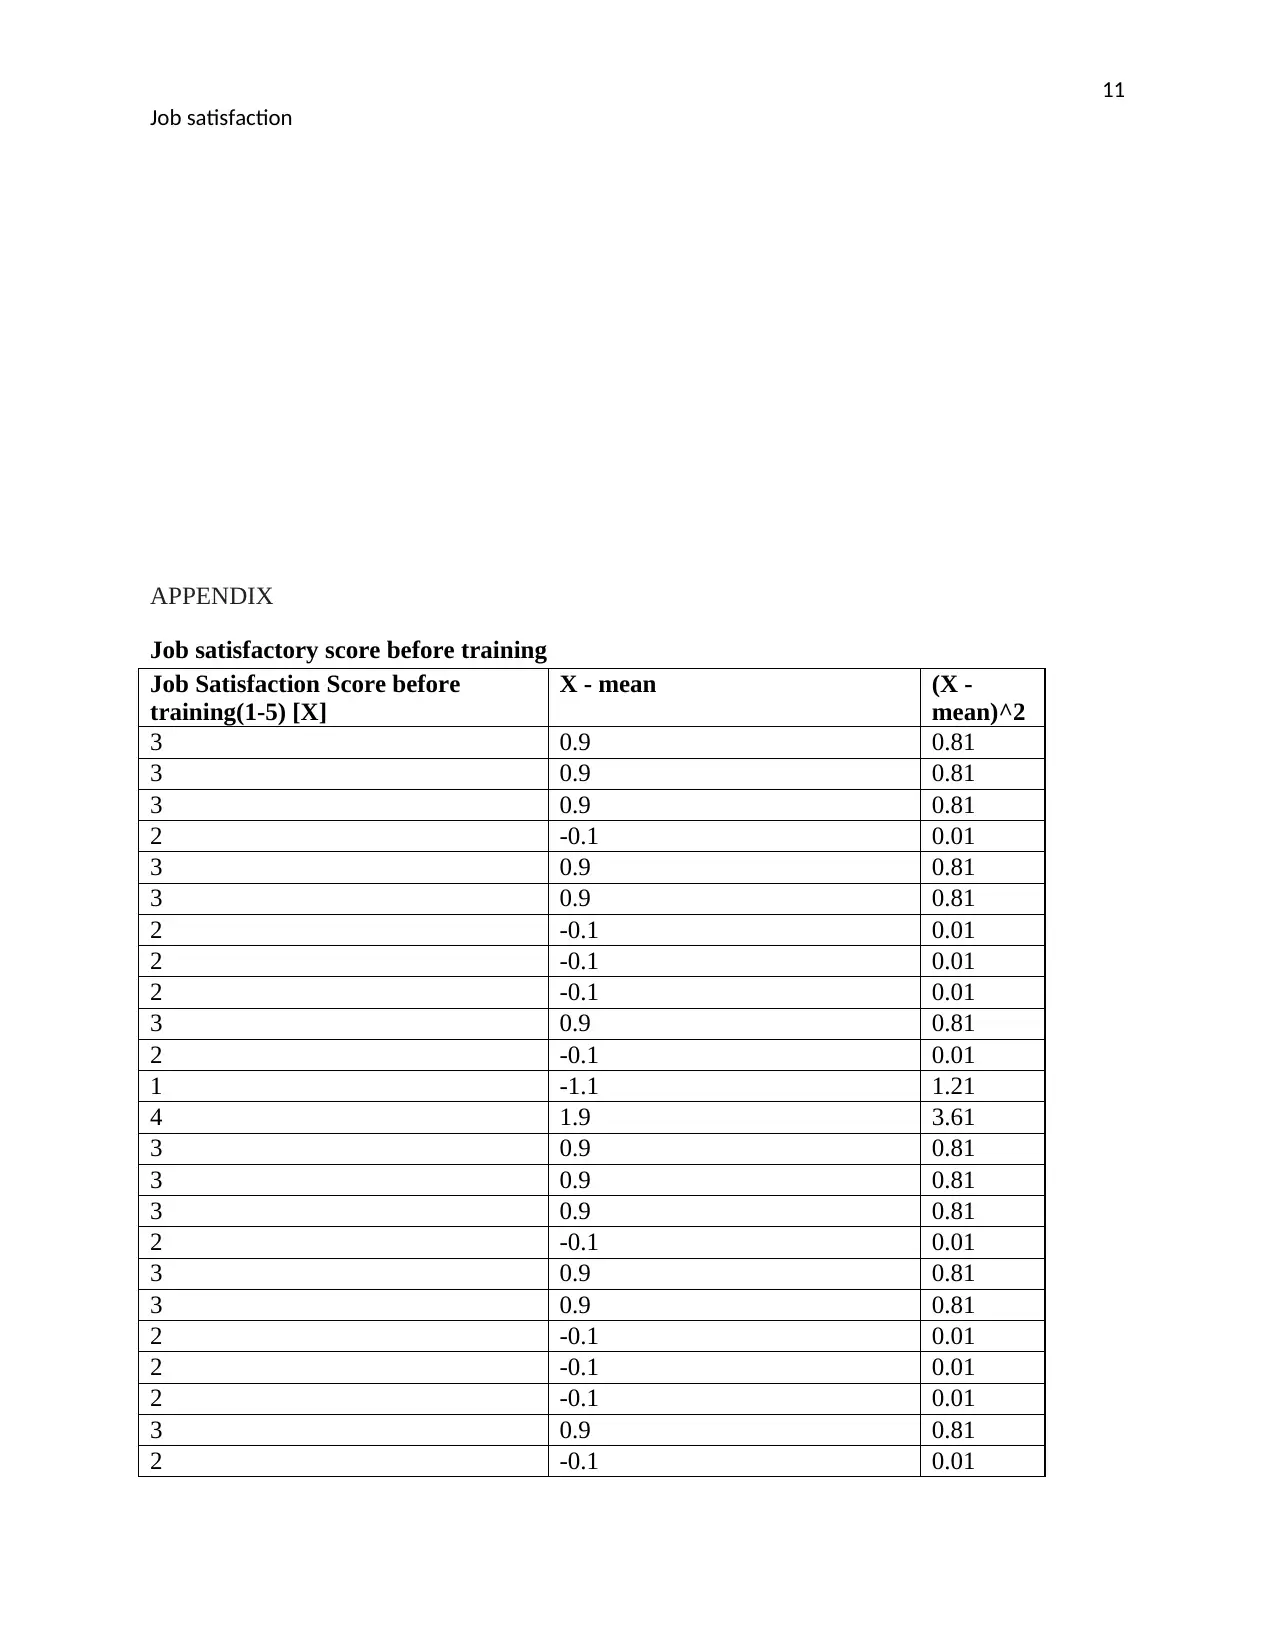
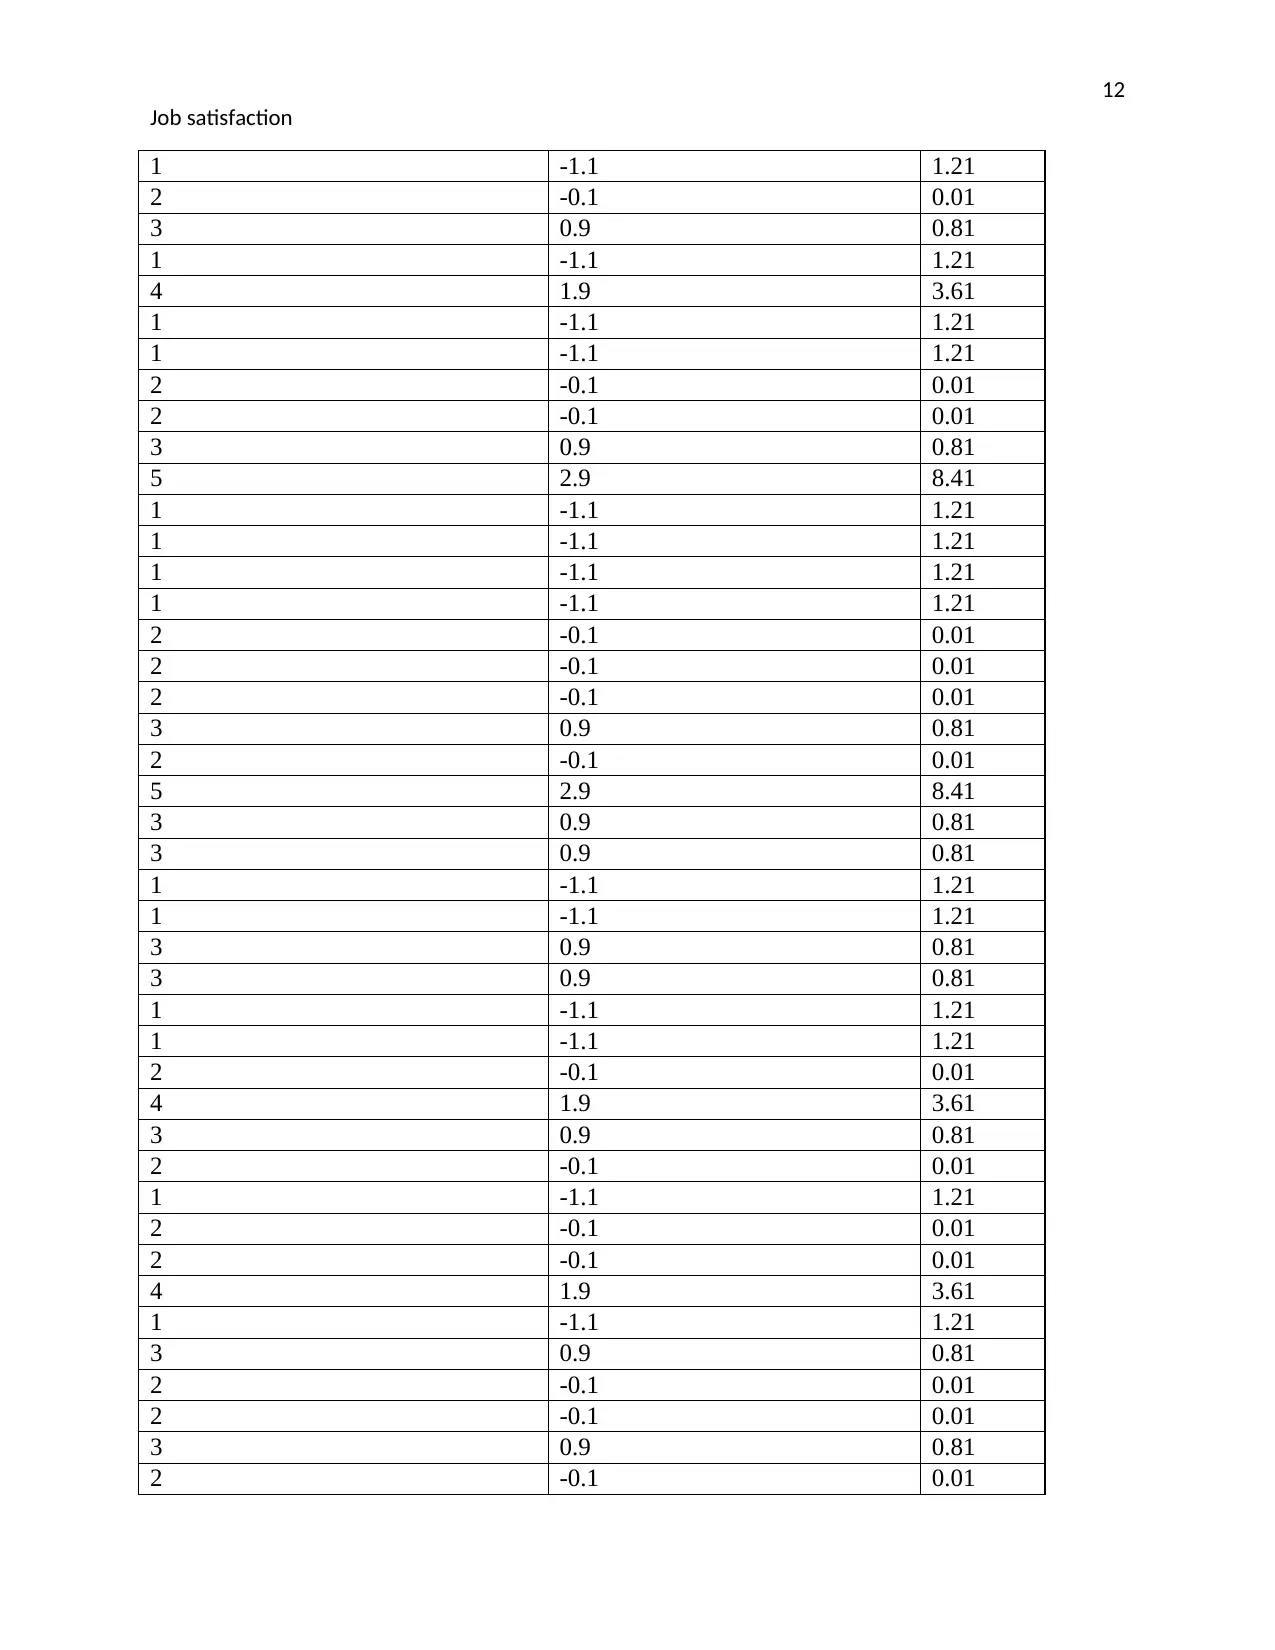
APPENDIX
Job satisfactory score before training
Job Satisfaction Score before
training(1-5) [X]
X - mean (X -
mean)^2
3 0.9 0.81
3 0.9 0.81
3 0.9 0.81
2 -0.1 0.01
3 0.9 0.81
3 0.9 0.81
2 -0.1 0.01
2 -0.1 0.01
2 -0.1 0.01
3 0.9 0.81
2 -0.1 0.01
1 -1.1 1.21
4 1.9 3.61
3 0.9 0.81
3 0.9 0.81
3 0.9 0.81
2 -0.1 0.01
3 0.9 0.81
3 0.9 0.81
2 -0.1 0.01
2 -0.1 0.01
2 -0.1 0.01
3 0.9 0.81
2 -0.1 0.01
Job satisfaction
APPENDIX
Job satisfactory score before training
Job Satisfaction Score before
training(1-5) [X]
X - mean (X -
mean)^2
3 0.9 0.81
3 0.9 0.81
3 0.9 0.81
2 -0.1 0.01
3 0.9 0.81
3 0.9 0.81
2 -0.1 0.01
2 -0.1 0.01
2 -0.1 0.01
3 0.9 0.81
2 -0.1 0.01
1 -1.1 1.21
4 1.9 3.61
3 0.9 0.81
3 0.9 0.81
3 0.9 0.81
2 -0.1 0.01
3 0.9 0.81
3 0.9 0.81
2 -0.1 0.01
2 -0.1 0.01
2 -0.1 0.01
3 0.9 0.81
2 -0.1 0.01
12
Job satisfaction
1 -1.1 1.21
2 -0.1 0.01
3 0.9 0.81
1 -1.1 1.21
4 1.9 3.61
1 -1.1 1.21
1 -1.1 1.21
2 -0.1 0.01
2 -0.1 0.01
3 0.9 0.81
5 2.9 8.41
1 -1.1 1.21
1 -1.1 1.21
1 -1.1 1.21
1 -1.1 1.21
2 -0.1 0.01
2 -0.1 0.01
2 -0.1 0.01
3 0.9 0.81
2 -0.1 0.01
5 2.9 8.41
3 0.9 0.81
3 0.9 0.81
1 -1.1 1.21
1 -1.1 1.21
3 0.9 0.81
3 0.9 0.81
1 -1.1 1.21
1 -1.1 1.21
2 -0.1 0.01
4 1.9 3.61
3 0.9 0.81
2 -0.1 0.01
1 -1.1 1.21
2 -0.1 0.01
2 -0.1 0.01
4 1.9 3.61
1 -1.1 1.21
3 0.9 0.81
2 -0.1 0.01
2 -0.1 0.01
3 0.9 0.81
2 -0.1 0.01
⊘ This is a preview!⊘
Do you want full access?
Subscribe today to unlock all pages.
Trusted by 1+ million students worldwide
1 out of 73
Related Documents


Your All-in-One AI-Powered Toolkit for Academic Success.
+13062052269
info@desklib.com
Available 24*7 on WhatsApp / Email
![[object Object]](/_next/static/media/star-bottom.7253800d.svg)
Unlock your academic potential
Copyright © 2020–2026 A2Z Services. All Rights Reserved. Developed and managed by ZUCOL.