Repsol PLC Financial Report: IFRS Analysis, Ratios & Investment
VerifiedAdded on 2023/06/13
|10
|2270
|464
Report
AI Summary
This report provides a financial analysis of Repsol PLC, an international energy company, using International Financial Reporting Standards (IFRS). It includes a company overview, management discussion and analysis (MD&A) from the 2017 annual report, and a detailed ratio analysis comparing Repsol's performance with British Petroleum (BP) across profitability, liquidity, and solvency. The report also examines market-related ratios and security analysis, considering the stock price reaction to the annual report release. Press releases from sources like the Financial Times, Yahoo Finance, and Reuters are summarized to provide context on the company's financial health and corporate social responsibility initiatives. Ultimately, the report concludes with an investment decision, recommending that investors consider Repsol PLC for both short-term and long-term investments based on its competitive market position and potential for returns. The analysis leverages financial data from Repsol's annual report and compares it to BP to assess Repsol's relative performance and investment attractiveness.
Running Head: Financial reporting and analysis
1
Project Report: Financial reporting and analysis
1
Project Report: Financial reporting and analysis
Paraphrase This Document
Need a fresh take? Get an instant paraphrase of this document with our AI Paraphraser
Financial reporting and analysis 2
Contents
Introduction.......................................................................................................................3
Company overview...........................................................................................................3
Management discussion and analysis...............................................................................3
Ratio analysis....................................................................................................................3
Security analysis...............................................................................................................6
Press release......................................................................................................................6
Investment decision..........................................................................................................7
Conclusion........................................................................................................................7
References.........................................................................................................................8
Appendix...........................................................................................................................9
Financial reporting and analysis 3
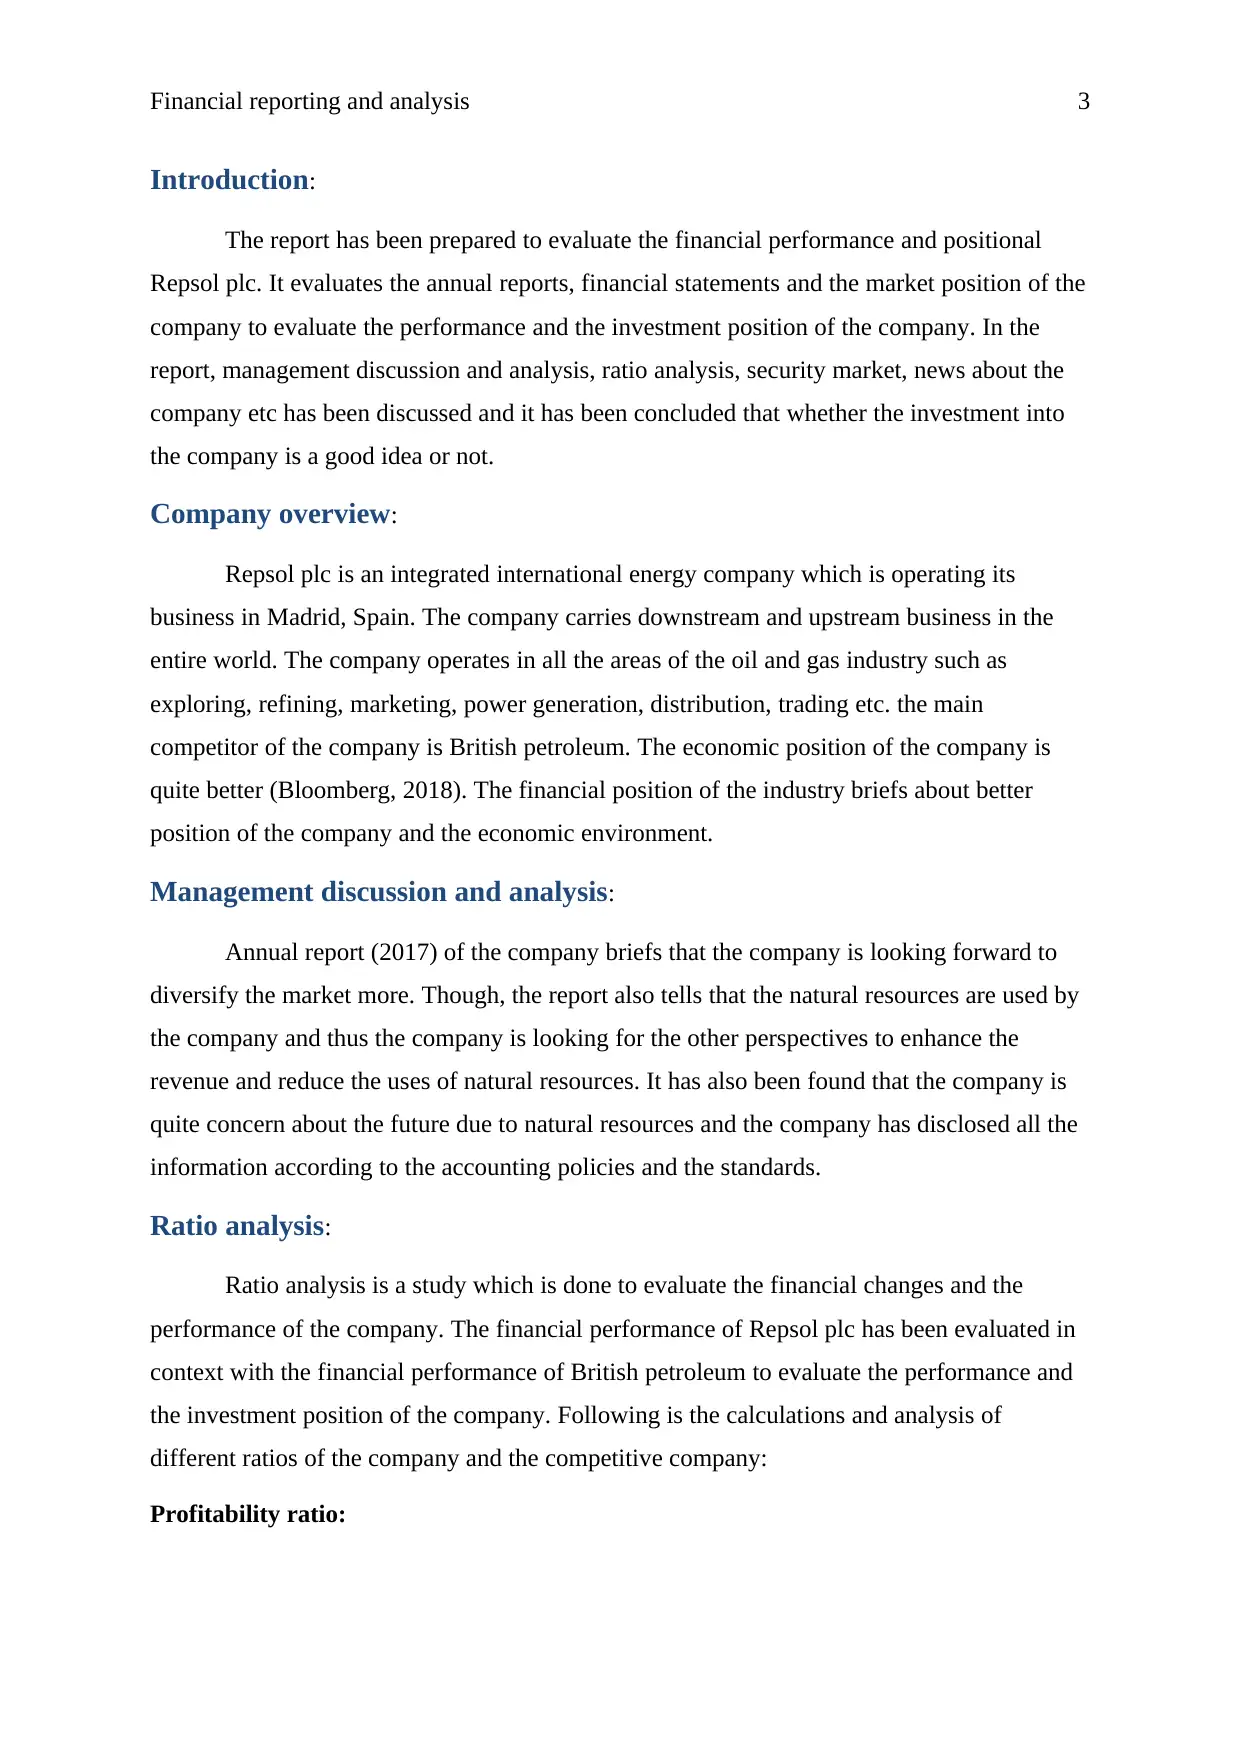
Introduction:
The report has been prepared to evaluate the financial performance and positional
Repsol plc. It evaluates the annual reports, financial statements and the market position of the
company to evaluate the performance and the investment position of the company. In the
report, management discussion and analysis, ratio analysis, security market, news about the
company etc has been discussed and it has been concluded that whether the investment into
the company is a good idea or not.
Company overview:
Repsol plc is an integrated international energy company which is operating its
business in Madrid, Spain. The company carries downstream and upstream business in the
entire world. The company operates in all the areas of the oil and gas industry such as
exploring, refining, marketing, power generation, distribution, trading etc. the main
competitor of the company is British petroleum. The economic position of the company is
quite better (Bloomberg, 2018). The financial position of the industry briefs about better
position of the company and the economic environment.
Management discussion and analysis:
Annual report (2017) of the company briefs that the company is looking forward to
diversify the market more. Though, the report also tells that the natural resources are used by
the company and thus the company is looking for the other perspectives to enhance the
revenue and reduce the uses of natural resources. It has also been found that the company is
quite concern about the future due to natural resources and the company has disclosed all the
information according to the accounting policies and the standards.
Ratio analysis:
Ratio analysis is a study which is done to evaluate the financial changes and the
performance of the company. The financial performance of Repsol plc has been evaluated in
context with the financial performance of British petroleum to evaluate the performance and
the investment position of the company. Following is the calculations and analysis of
different ratios of the company and the competitive company:
Profitability ratio:
⊘ This is a preview!⊘
Do you want full access?
Subscribe today to unlock all pages.
Trusted by 1+ million students worldwide
Financial reporting and analysis 4
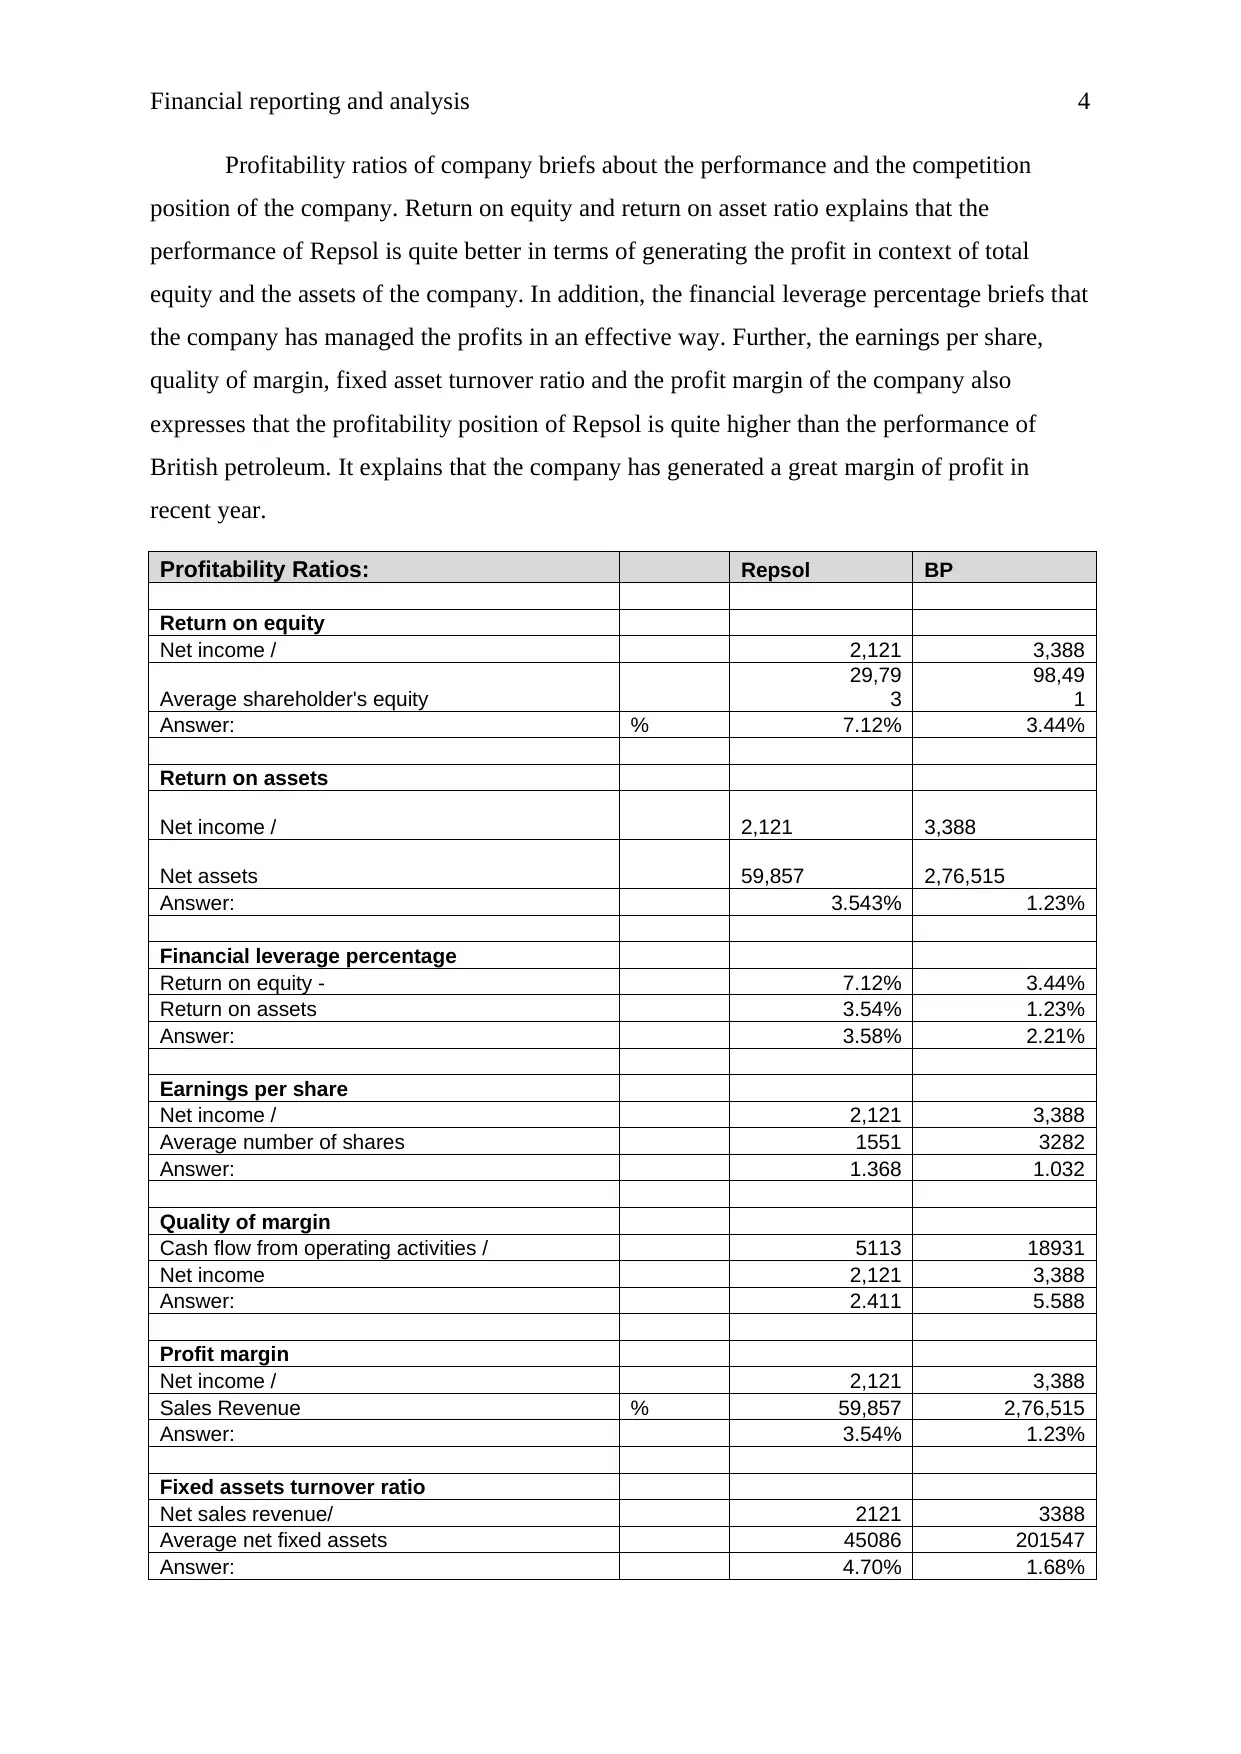
Profitability ratios of company briefs about the performance and the competition
position of the company. Return on equity and return on asset ratio explains that the
performance of Repsol is quite better in terms of generating the profit in context of total
equity and the assets of the company. In addition, the financial leverage percentage briefs that
the company has managed the profits in an effective way. Further, the earnings per share,
quality of margin, fixed asset turnover ratio and the profit margin of the company also
expresses that the profitability position of Repsol is quite higher than the performance of
British petroleum. It explains that the company has generated a great margin of profit in
recent year.
Profitability Ratios: Repsol BP
Return on equity
Net income / 2,121 3,388
Average shareholder's equity
29,79
3
98,49
1
Answer: % 7.12% 3.44%
Return on assets
Net income / 2,121 3,388
Net assets 59,857 2,76,515
Answer: 3.543% 1.23%
Financial leverage percentage
Return on equity - 7.12% 3.44%
Return on assets 3.54% 1.23%
Answer: 3.58% 2.21%
Earnings per share
Net income / 2,121 3,388
Average number of shares 1551 3282
Answer: 1.368 1.032
Quality of margin
Cash flow from operating activities / 5113 18931
Net income 2,121 3,388
Answer: 2.411 5.588
Profit margin
Net income / 2,121 3,388
Sales Revenue % 59,857 2,76,515
Answer: 3.54% 1.23%
Fixed assets turnover ratio
Net sales revenue/ 2121 3388
Average net fixed assets 45086 201547
Answer: 4.70% 1.68%
Paraphrase This Document
Need a fresh take? Get an instant paraphrase of this document with our AI Paraphraser
Financial reporting and analysis 5
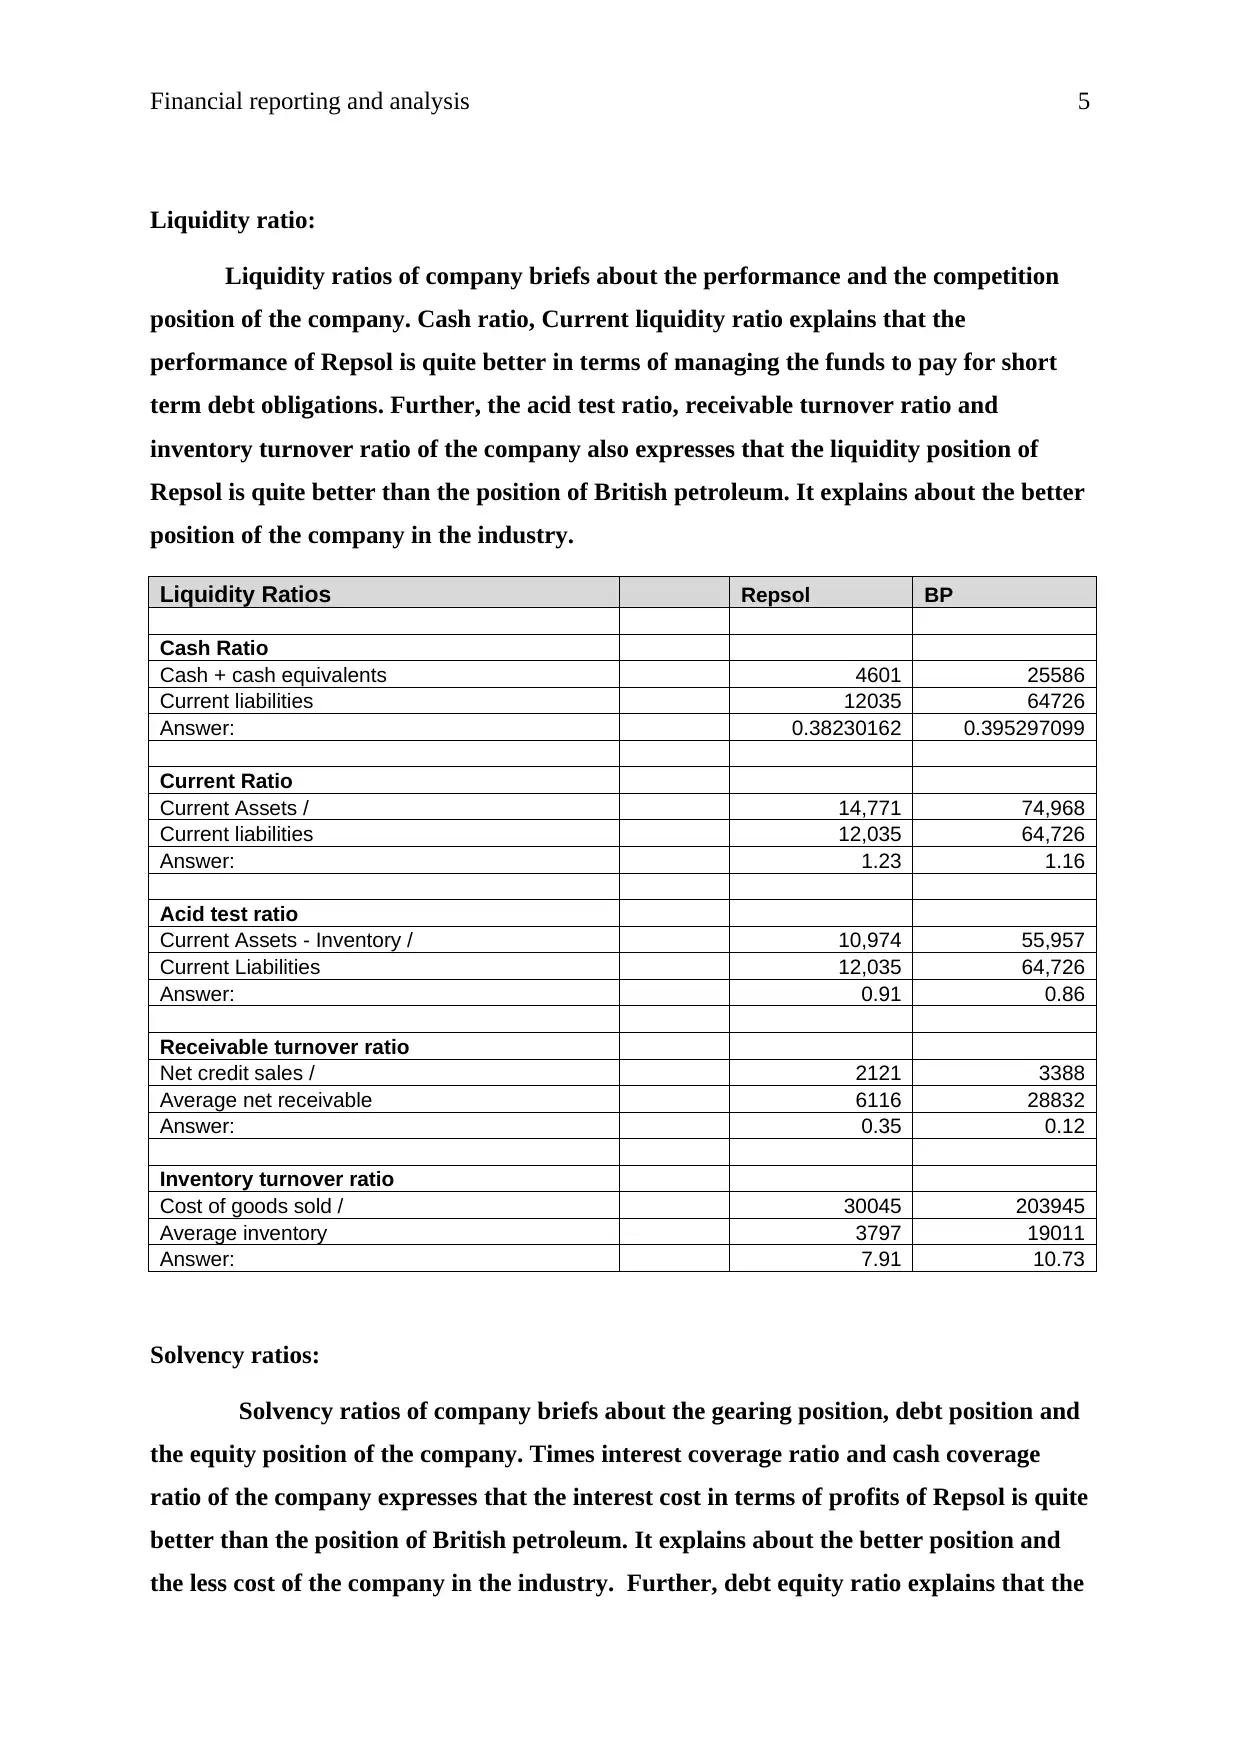
Liquidity ratio:
Liquidity ratios of company briefs about the performance and the competition
position of the company. Cash ratio, Current liquidity ratio explains that the
performance of Repsol is quite better in terms of managing the funds to pay for short
term debt obligations. Further, the acid test ratio, receivable turnover ratio and
inventory turnover ratio of the company also expresses that the liquidity position of
Repsol is quite better than the position of British petroleum. It explains about the better
position of the company in the industry.
Liquidity Ratios Repsol BP
Cash Ratio
Cash + cash equivalents 4601 25586
Current liabilities 12035 64726
Answer: 0.38230162 0.395297099
Current Ratio
Current Assets / 14,771 74,968
Current liabilities 12,035 64,726
Answer: 1.23 1.16
Acid test ratio
Current Assets - Inventory / 10,974 55,957
Current Liabilities 12,035 64,726
Answer: 0.91 0.86
Receivable turnover ratio
Net credit sales / 2121 3388
Average net receivable 6116 28832
Answer: 0.35 0.12
Inventory turnover ratio
Cost of goods sold / 30045 203945
Average inventory 3797 19011
Answer: 7.91 10.73
Solvency ratios:
Solvency ratios of company briefs about the gearing position, debt position and
the equity position of the company. Times interest coverage ratio and cash coverage
ratio of the company expresses that the interest cost in terms of profits of Repsol is quite
better than the position of British petroleum. It explains about the better position and
the less cost of the company in the industry. Further, debt equity ratio explains that the
Liquidity ratio:
Liquidity ratios of company briefs about the performance and the competition
position of the company. Cash ratio, Current liquidity ratio explains that the
performance of Repsol is quite better in terms of managing the funds to pay for short
term debt obligations. Further, the acid test ratio, receivable turnover ratio and
inventory turnover ratio of the company also expresses that the liquidity position of
Repsol is quite better than the position of British petroleum. It explains about the better
position of the company in the industry.
Liquidity Ratios Repsol BP
Cash Ratio
Cash + cash equivalents 4601 25586
Current liabilities 12035 64726
Answer: 0.38230162 0.395297099
Current Ratio
Current Assets / 14,771 74,968
Current liabilities 12,035 64,726
Answer: 1.23 1.16
Acid test ratio
Current Assets - Inventory / 10,974 55,957
Current Liabilities 12,035 64,726
Answer: 0.91 0.86
Receivable turnover ratio
Net credit sales / 2121 3388
Average net receivable 6116 28832
Answer: 0.35 0.12
Inventory turnover ratio
Cost of goods sold / 30045 203945
Average inventory 3797 19011
Answer: 7.91 10.73
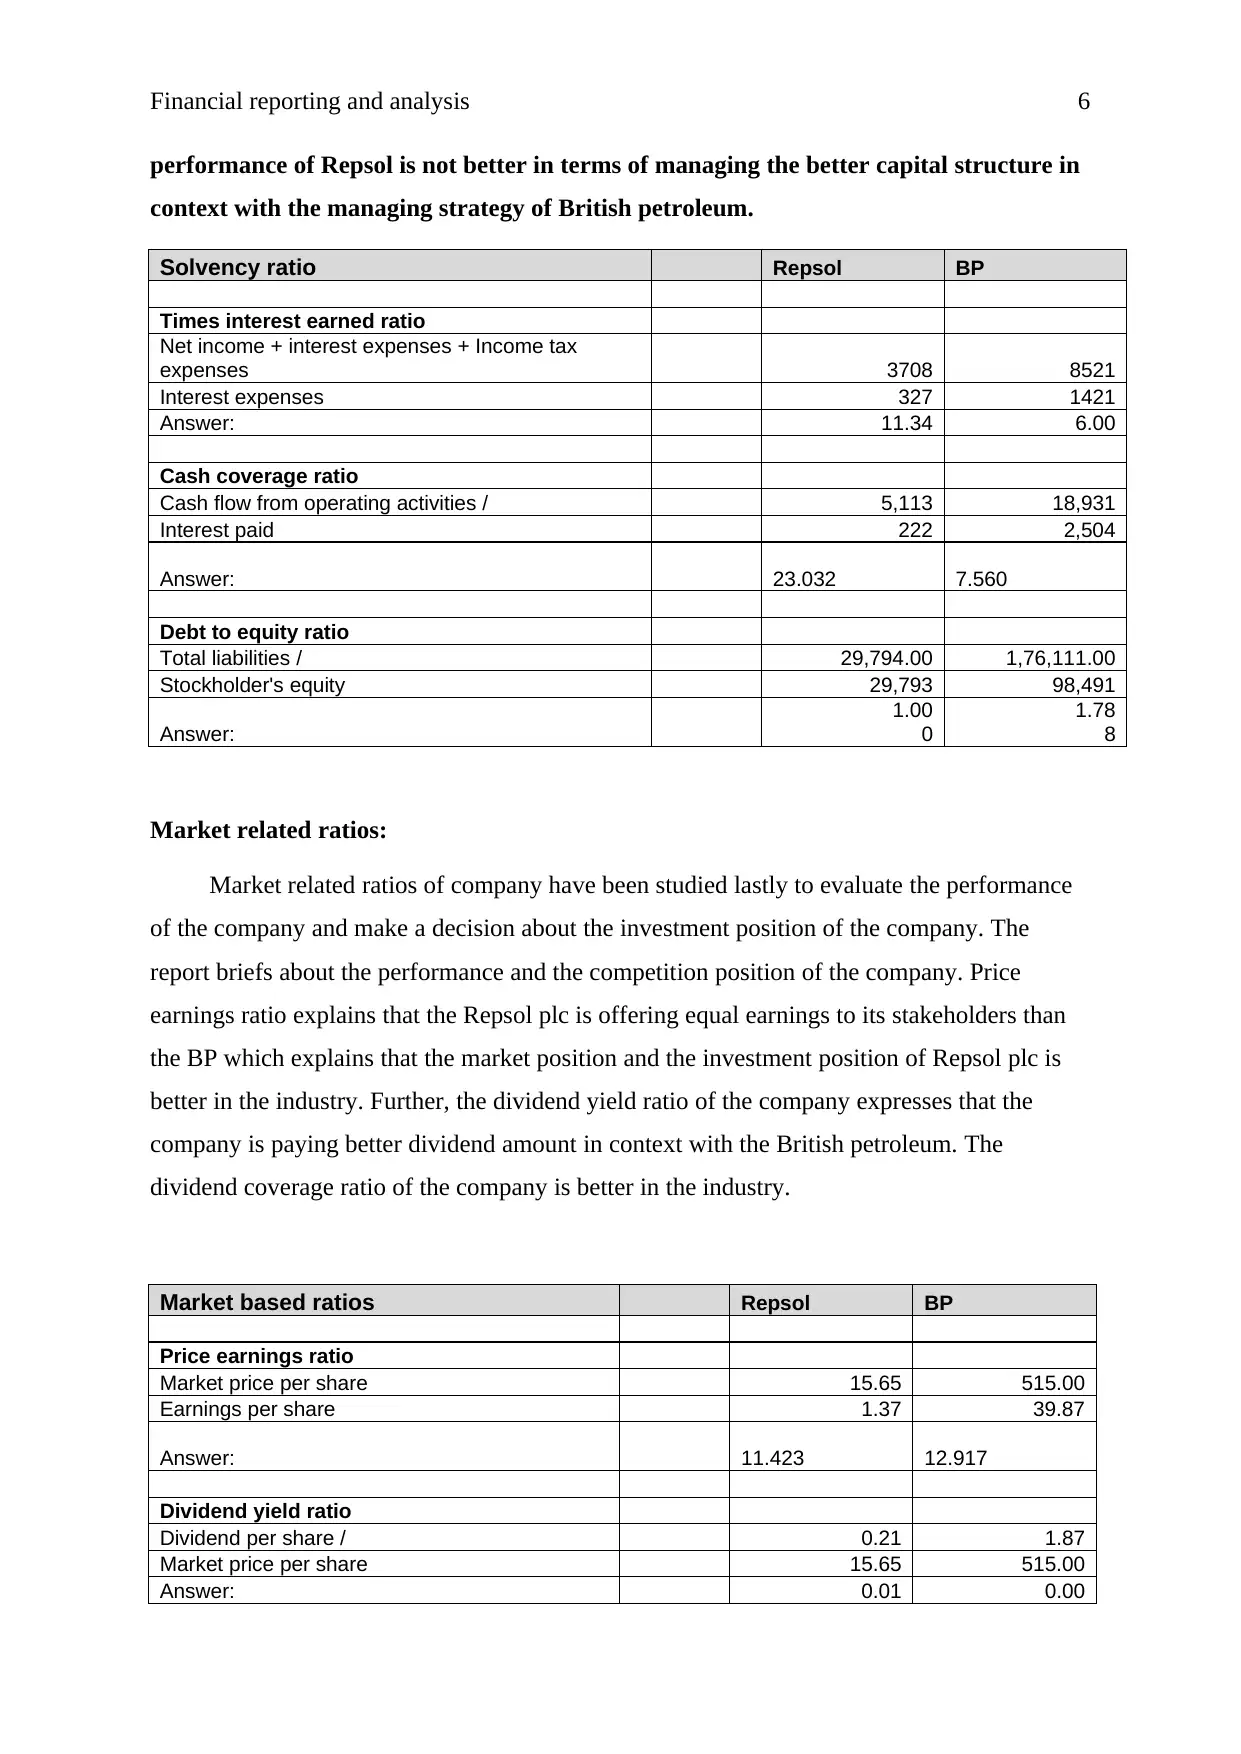
Solvency ratios:
Solvency ratios of company briefs about the gearing position, debt position and
the equity position of the company. Times interest coverage ratio and cash coverage
ratio of the company expresses that the interest cost in terms of profits of Repsol is quite
better than the position of British petroleum. It explains about the better position and
the less cost of the company in the industry. Further, debt equity ratio explains that the
Financial reporting and analysis 6
performance of Repsol is not better in terms of managing the better capital structure in
context with the managing strategy of British petroleum.
Solvency ratio Repsol BP
Times interest earned ratio
Net income + interest expenses + Income tax
expenses 3708 8521
Interest expenses 327 1421
Answer: 11.34 6.00
Cash coverage ratio
Cash flow from operating activities / 5,113 18,931
Interest paid 222 2,504
Answer: 23.032 7.560
Debt to equity ratio
Total liabilities / 29,794.00 1,76,111.00
Stockholder's equity 29,793 98,491
Answer:
1.00
0
1.78
8
Market related ratios:
Market related ratios of company have been studied lastly to evaluate the performance
of the company and make a decision about the investment position of the company. The
report briefs about the performance and the competition position of the company. Price
earnings ratio explains that the Repsol plc is offering equal earnings to its stakeholders than
the BP which explains that the market position and the investment position of Repsol plc is
better in the industry. Further, the dividend yield ratio of the company expresses that the
company is paying better dividend amount in context with the British petroleum. The
dividend coverage ratio of the company is better in the industry.
Market based ratios Repsol BP
Price earnings ratio
Market price per share 15.65 515.00
Earnings per share 1.37 39.87
Answer: 11.423 12.917
Dividend yield ratio
Dividend per share / 0.21 1.87
Market price per share 15.65 515.00
Answer: 0.01 0.00
⊘ This is a preview!⊘
Do you want full access?
Subscribe today to unlock all pages.
Trusted by 1+ million students worldwide
Financial reporting and analysis 7
4 4
(Morningstar, 2018)
Security analysis:
The security position of the company has been evaluated further and it has been found
that the stock price of the company has been enhanced by a huge % after release of the annual
report. Annual report has attracted the investors towards the company (Yahoo Finance,
2018). The annual report contains all the related information about the changes into the
organization, financial and non financial informnation of the organization, future outlook of
the organization and the comparison of the organization with the last year performance of the
company.
Annual report makes it easy for the investors and the financial analyst to evaluate the
financial performance and the position of the company. In case of Repsol plc, the annual
report is quite helpful for the investors (Morningstar, 2018). Investors could get the
information about the financial performance, segment performance, dividends, net profit etc
information of the company on the basis of annual reports.
Press release:
Financial times (2018) has disclosed that the company has generated huge profits and
the current position of the company is quite competitive in the market. The analyst report tells
that the financial performance of the company is quite better in the industry and it suggests
the investors to invest into the company. The Yahoo finance (2018) tells that the corporate
social responsibility policy of the company is quite better. The company is using the natural
resources for its business and for it; the company is paying the society back in terms of
providing job opportunities and launching various new projects for the environment.
Reuters (2018) has also briefed that the comapny has diversified its market into
vertical way. It has launched various subsidiaries to manage the various operations of the
company such as exploring, refining, marketing, power generation, distribution, trading etc.
The economic position of the company is quite better. The financial position of the industry
briefs about better position of the company and the economic environment.
Investment decision:
On the basis of above study on Repsol limited and the British petroleum, it has been
found that the performance of the company is quite better and at the same time, the market
Paraphrase This Document
Need a fresh take? Get an instant paraphrase of this document with our AI Paraphraser
Financial reporting and analysis 8
position of the company is also well. The report explains that the investors should invest into
the organization for short term as well as long term (Bloomberg, 2018). In both the situations,
the investors would be able to get huge return as the stock price of the company briefs about
positive changes as well as the dividends of the company are also attractive.
The report explains that the investors should hold the stock of Repsol plc for now and
at the time of announcing the dividend amount or releasing the annual report, investors
should sold it in the market. It would offer them huge return. Investors could buy the stock
now and hold it for some time to enhance the return,
Conclusion:
To conclude, the financial performance of and the market position of the company is
quite better and briefs about a competitive position in the industry. It expresses that the
investment position of the company are quite better. An investor should invest into the
organization for short term as well as long term to generate the extra profit.
Financial reporting and analysis 9
References:
“Annual Report”. Repsol plc. Web. 18th April 2018. 2018.
<https://www.repsol.com/imagenes/global/en/2017_Integrated_management_report_tcm14-
123306.pdf>
“Bloomberg”. Repsol plc. Web. 18th April 2018. 2018.
<https://www.bloomberg.com/research/stocks/private/snapshot.asp?privcapId=323502>
“Financial Times”. Repsol plc. Web. 18th April 2018. 2018.
<https://markets.ft.com/data/equities/tearsheet/summary?s=REP:MCE>
“Morningstar”. British petroleum. Web. 18th April 2018. 2018.
<http://www.morningstar.com/stocks/XNYS/BP/quote.html>
“Morningstar”. Repsol plc. Web. 18th April 2018. 2018.
<http://financials.morningstar.com/cash-flow/cf.html?
t=XBER:REP®ion=deu&culture=en-US>
“Reuters”. Repsol plc. Web. 18th April 2018. 2018.
<https://www.reuters.com/finance/stocks/overview/REP.MC>
“Yahoo Finance”. Repsol plc. Web. 18th April 2018. 2018.
<https://finance.yahoo.com/quote/REP.MC/>
⊘ This is a preview!⊘
Do you want full access?
Subscribe today to unlock all pages.
Trusted by 1+ million students worldwide
Financial reporting and analysis 10
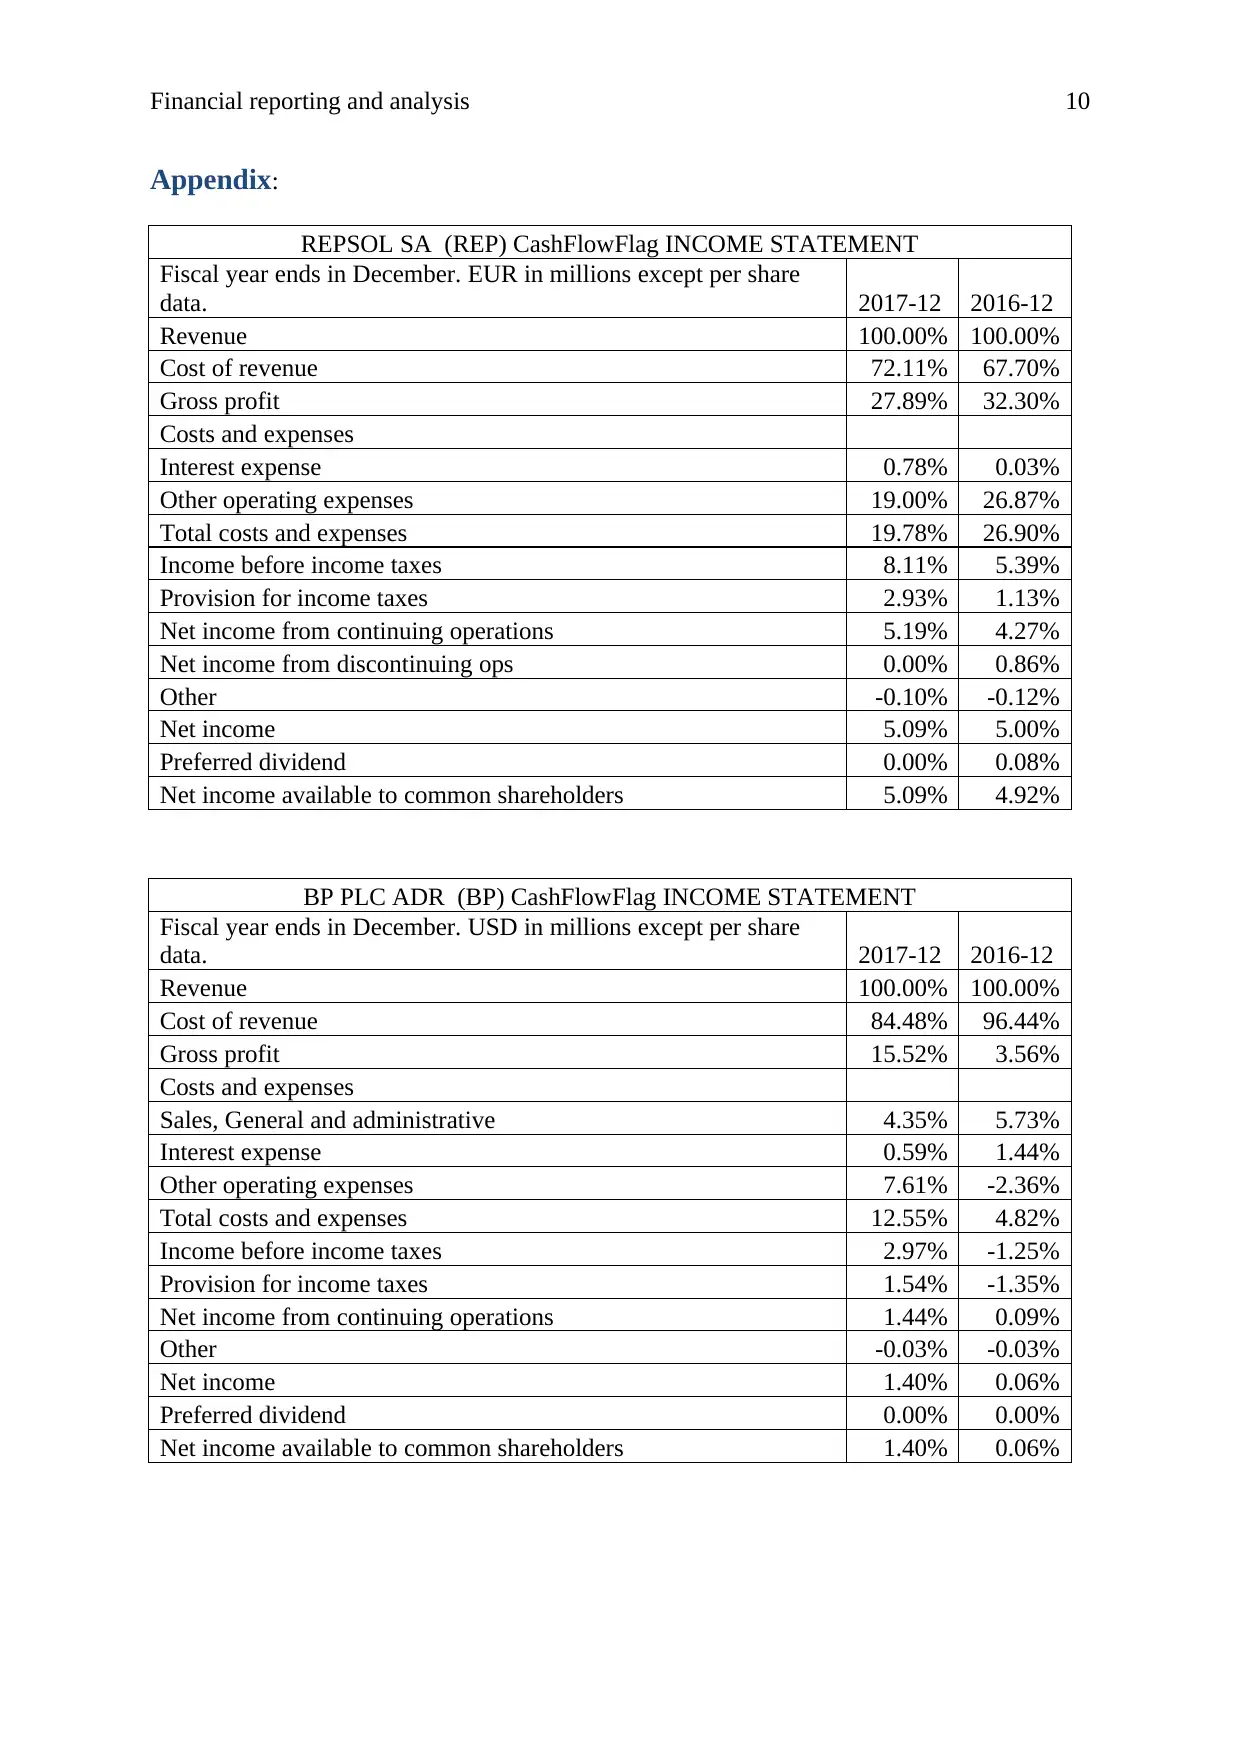
Appendix:
REPSOL SA (REP) CashFlowFlag INCOME STATEMENT
Fiscal year ends in December. EUR in millions except per share
data. 2017-12 2016-12
Revenue 100.00% 100.00%
Cost of revenue 72.11% 67.70%
Gross profit 27.89% 32.30%
Costs and expenses
Interest expense 0.78% 0.03%
Other operating expenses 19.00% 26.87%
Total costs and expenses 19.78% 26.90%
Income before income taxes 8.11% 5.39%
Provision for income taxes 2.93% 1.13%
Net income from continuing operations 5.19% 4.27%
Net income from discontinuing ops 0.00% 0.86%
Other -0.10% -0.12%
Net income 5.09% 5.00%
Preferred dividend 0.00% 0.08%
Net income available to common shareholders 5.09% 4.92%
BP PLC ADR (BP) CashFlowFlag INCOME STATEMENT
Fiscal year ends in December. USD in millions except per share
data. 2017-12 2016-12
Revenue 100.00% 100.00%
Cost of revenue 84.48% 96.44%
Gross profit 15.52% 3.56%
Costs and expenses
Sales, General and administrative 4.35% 5.73%
Interest expense 0.59% 1.44%
Other operating expenses 7.61% -2.36%
Total costs and expenses 12.55% 4.82%
Income before income taxes 2.97% -1.25%
Provision for income taxes 1.54% -1.35%
Net income from continuing operations 1.44% 0.09%
Other -0.03% -0.03%
Net income 1.40% 0.06%
Preferred dividend 0.00% 0.00%
Net income available to common shareholders 1.40% 0.06%
1 out of 10
Related Documents


Your All-in-One AI-Powered Toolkit for Academic Success.
+13062052269
info@desklib.com
Available 24*7 on WhatsApp / Email
![[object Object]](/_next/static/media/star-bottom.7253800d.svg)
Unlock your academic potential
Copyright © 2020–2026 A2Z Services. All Rights Reserved. Developed and managed by ZUCOL.