Data Research & Management: Impact on Business Decision Making

Verified

Added on  2022/12/01

|16
|924
|244
Report
AI Summary
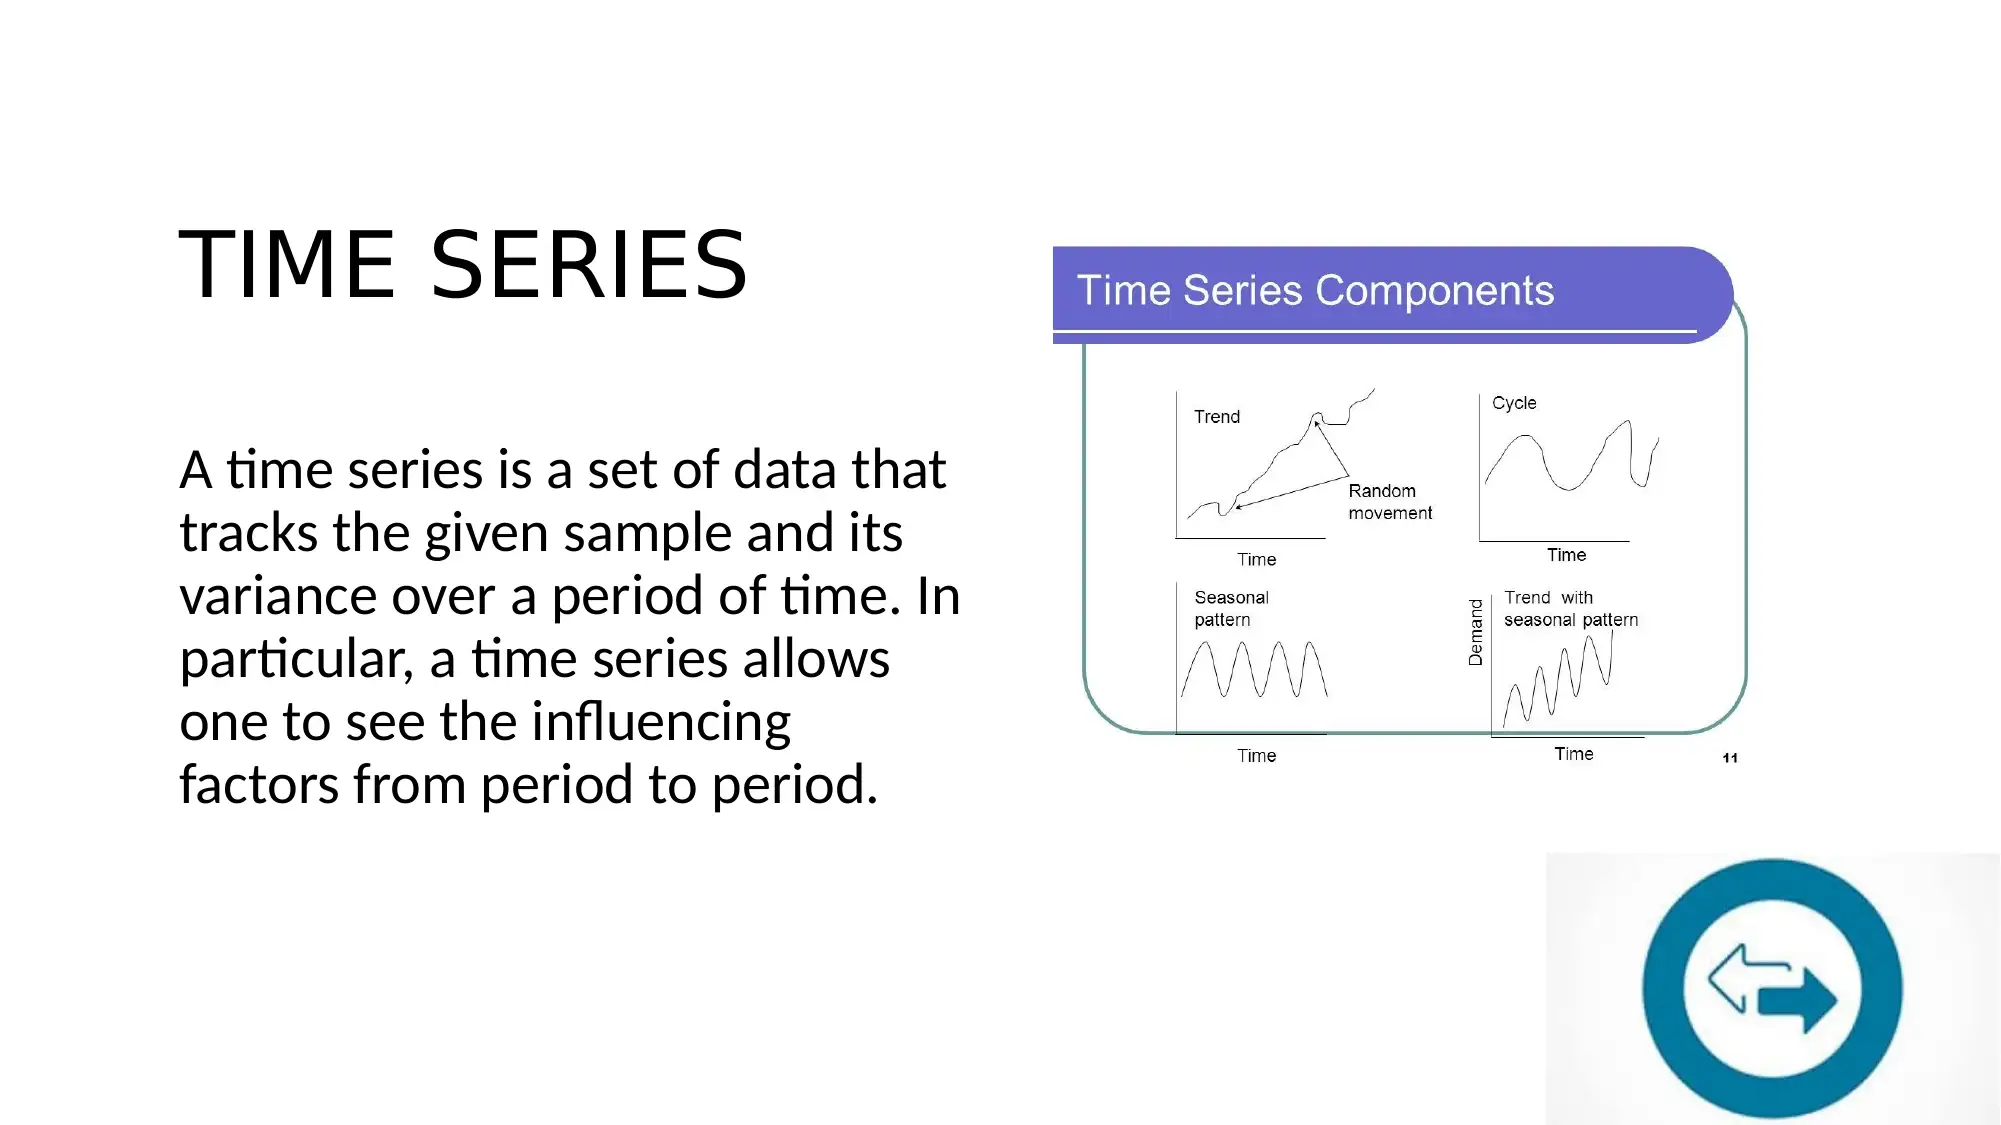
This report provides an overview of qualitative and quantitative research methods, emphasizing their application in business decision-making. It explores the strengths and limitations of both approaches, highlighting the importance of in-depth understanding and statistical analysis. The report also discusses correlation, regression, and time series analysis as tools for interpreting data and identifying trends. It emphasizes how businesses can leverage these analytical techniques to inform strategic decisions by analyzing consumer behavior, market trends, and historical data. The conclusion underscores the necessity of combining qualitative and quantitative insights for reliable data-driven decision-making, referencing academic sources to support the analysis.
Document Page
DATA
RESEARCH
&
MANAGEME
NT
tabler-icon-diamond-filled.svg

Paraphrase This Document

Need a fresh take? Get an instant paraphrase of this document with our AI Paraphraser
Document Page
QUALITATIVE RESEARCH
Qualitative research is used
for collecting, analyzing and
interpreting data by observing
what people do and say. It is
subjective. The nature of the
research is exploratory and
open minded, focuses on
personal in depth interviews
individually and focus groups.
Document Page
This mainly includes questions How, Why and What
Process is very inductive
Meaning can be constructed in a realistic way
socially
In depth meaning can be attained
Full of values
Dependence on context is there
Holistic approach is present
Researcher is part of the process
Document Page
STRENGTHS
Its very detailed and in depth
Not restricted to specific questions
Guided by researcher
Can be quickly revised
Findings can be useful in more than one way
tabler-icon-diamond-filled.svg

Paraphrase This Document

Need a fresh take? Get an instant paraphrase of this document with our AI Paraphraser
Document Page
Limitations of Qualitative Research
Dependent on
individual skills
Difficult to maintain,
assess and
demonstrate
Time consuming
Difficult to
characterize in a
visual way
Document Page
Quantitative Research
Quantitative Research aims to
measure the quantity and with its
comparison to the past tries to project
the future. This is more statistical
method. This gives the relation and
connection between empirical
observation and mathematical
expression of Quantitative
relationships. Used mainly to develop
mathematical models, theories or
hypothesis pertaining to phenomena.
Document Page
Collecting numerical data for a particular outcome or variable to is
Quantitative Research
This is more logical data – statistics based data
This can be easily organized, analyzed and interpreted
It is impartial, unbiased and moreover neutral
Large sample size is present
Analysis is carried out by the four (4) “W” (Who, What, Where and Why)
tabler-icon-diamond-filled.svg

Paraphrase This Document

Need a fresh take? Get an instant paraphrase of this document with our AI Paraphraser
Document Page
IMPORTANCE
Can be used in business to estimate attitudes of consumer and their
behaviors, marketing tactics.
In Medicine to measure clinical and methodological standards, trails
results many more
In economics to evaluate economic behavior and attitudes of citizens
and politicians
Document Page
CORRELATION
Correlation is a statistical comparison tool which tells the extent to
which the given two variables move in relation to each other. And it
doesn’t show the reason for which the variables are changing.
REGRESSION
Regression is a statistical method that tries to valuate the
strength and character of the relationship between one
dependent variable and a series of other variables.
Document Page
TIME SERIES
A time series is a set of data that
tracks the given sample and its
variance over a period of time. In
particular, a time series allows
one to see the influencing
factors from period to period.
tabler-icon-diamond-filled.svg

Paraphrase This Document

Need a fresh take? Get an instant paraphrase of this document with our AI Paraphraser
Document Page
Correlation & Regression
Correlation just gives the values changed in relation with each other
not reveling the influence of each or any external factor on any one of
it
Regression is the variable and the influences acted upon it for its
change but does not reveal the correlation with other variables
By combining these two, we can get the necessary values of research
and give the exact determined value from a research
Document Page
How to take business decisions
based on data research
Whenever the data is collected by
any method either qualitatively or
quantitatively there will be large
data on our tables
This will be further analyzed using
data analysis tools
These are all numbers and pure
statistics
chevron_up_icon
1 out of 16
circle_padding
hide_on_mobile
zoom_out_icon
[object Object]