Clinical Data Mining: An Exploratory Research Report on Data Analysis
VerifiedAdded on 2023/06/03
|21
|3078
|499
Report
AI Summary
This research report explores the analysis of large clinical datasets to discover new relationships and enhance decision-making in the healthcare sector. It details the methodology used in data collection from sources like the DHIS2 platform and university health facilities, emphasizing data anonymity. The report outlines the data pre-processing steps, feature selection and reduction techniques, and the experimental design, including research questions focused on patient demographics and service satisfaction. Implementation details cover the software and tools used for data mining, followed by a presentation and analysis of results, including disease distribution among genders. The study aims to leverage data mining and knowledge discovery to uncover valuable insights from clinical data.

Introduction To Research 1
INTRODUCTION TO RESEARCH
By Name
Course
Instructor
Institution
Location
Date
INTRODUCTION TO RESEARCH
By Name
Course
Instructor
Institution
Location
Date
Paraphrase This Document
Need a fresh take? Get an instant paraphrase of this document with our AI Paraphraser
Introduction To Research 2
Table of Contents
Abstract............................................................................................................................................2
1.0 Introduction................................................................................................................................2
2.0 Methodology..............................................................................................................................3
2.1 Data Sources..........................................................................................................................3
2.2 Collection of Data..................................................................................................................3
2.3 Data storage...........................................................................................................................4
3.0 Design and Implementation.......................................................................................................5
3.1 Data Pre-Processing...............................................................................................................5
3.2 feature Selection and Reduction............................................................................................7
3.3 Experiment Designing...........................................................................................................8
3.3.1 Detailed Design Steps.....................................................................................................8
3.4 Implementation....................................................................................................................10
3.4.1 Software and Tools.......................................................................................................10
4.0 Result and Analysis.................................................................................................................11
4.1 Result...................................................................................................................................12
4.2 Result Summary...................................................................................................................14
5.0 Outline of Experiment and Result Analysis............................................................................15
References......................................................................................................................................16
Introduction To Research 3
List Of Tables
Table 1 Data Storage Matrix............................................................................................................7
Table 2 Feature Selection..............................................................................................................10
Table 3 Research Questions...........................................................................................................13
Table 4 Softwares ans Tools..........................................................................................................14
Table 5 Diseases Distribution........................................................................................................15
List of Figures
Figure 1 Data Pre-Processing..........................................................................................................9
Figure 2 Research Detail Design...................................................................................................12
Figure 3 Hypertension Distribution...............................................................................................16
Figure 4 Diabetes Mellitus distribution.........................................................................................16
Figure 5 HIV/AIDS distribution....................................................................................................17
Figure 6 Bronshitis Distribution....................................................................................................18
⊘ This is a preview!⊘
Do you want full access?
Subscribe today to unlock all pages.
Trusted by 1+ million students worldwide
Introduction To Research 4
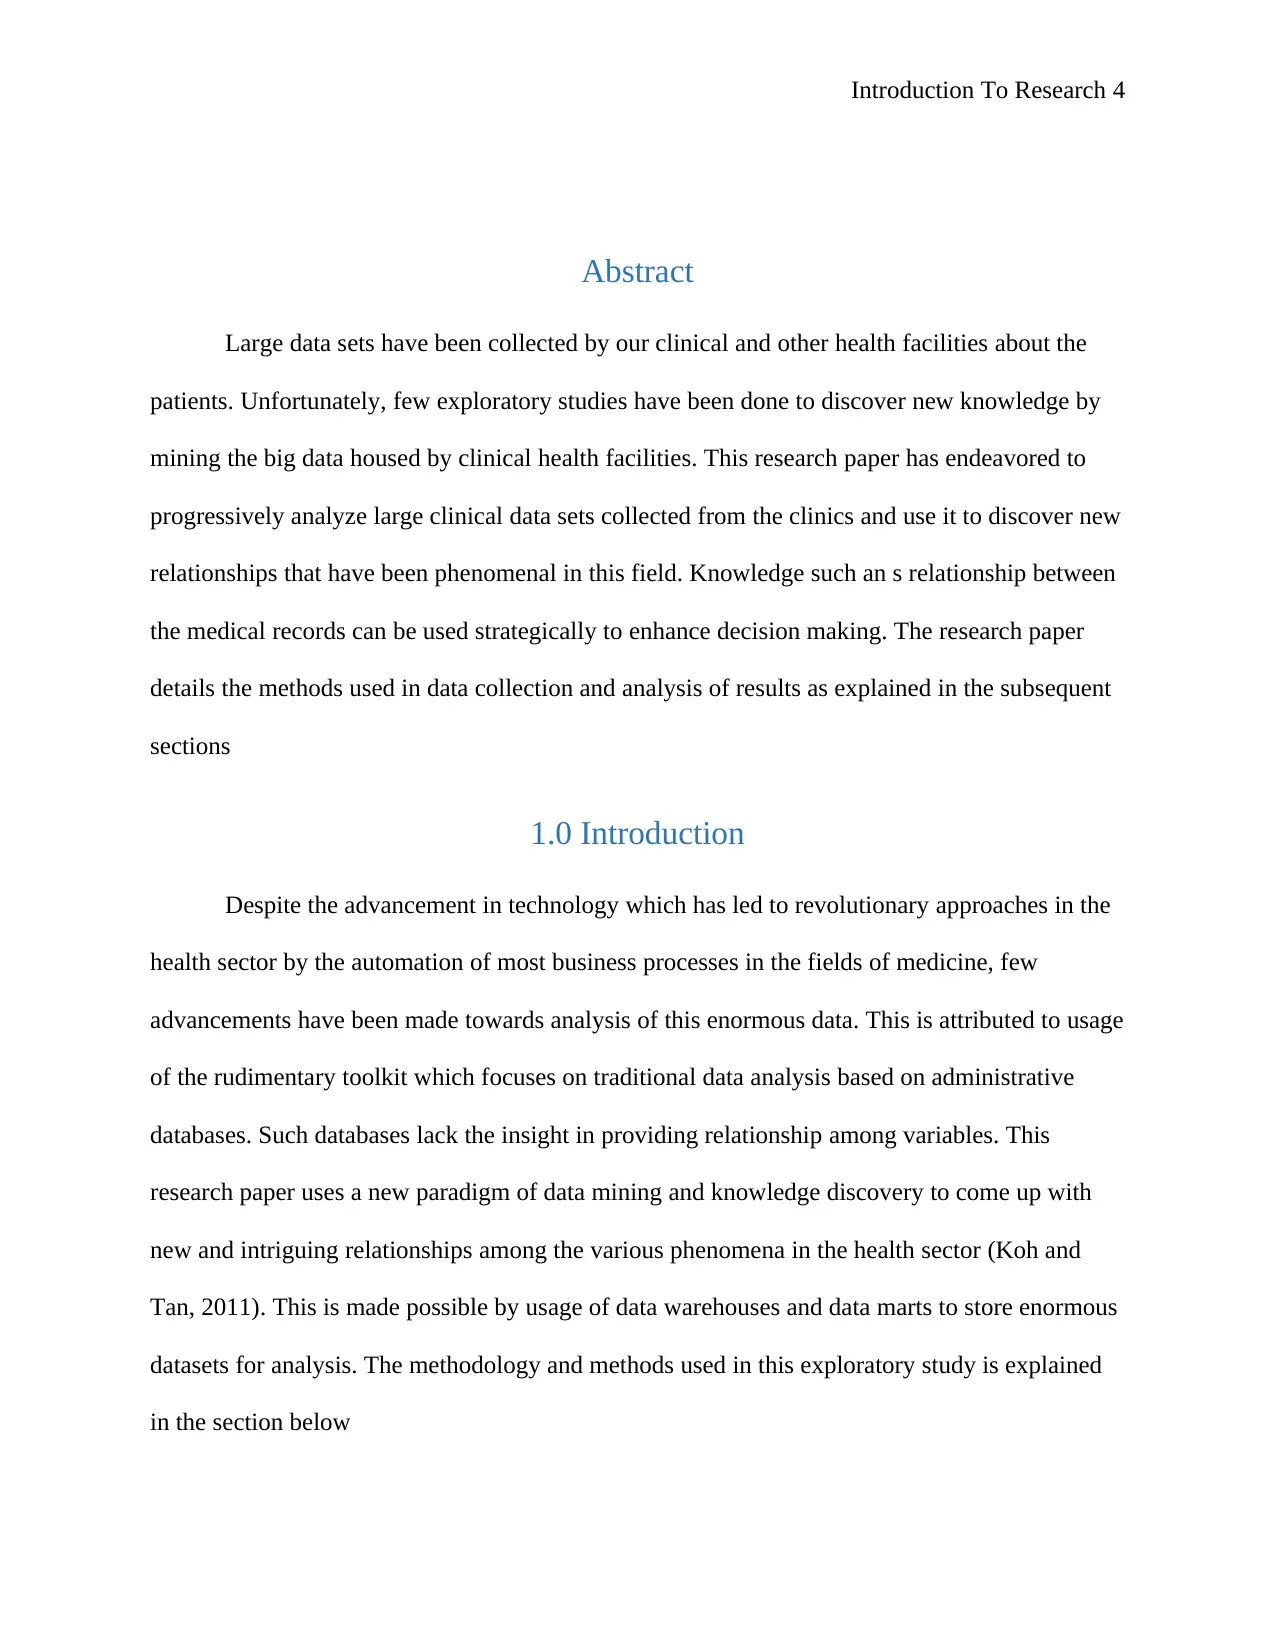
Abstract
Large data sets have been collected by our clinical and other health facilities about the
patients. Unfortunately, few exploratory studies have been done to discover new knowledge by
mining the big data housed by clinical health facilities. This research paper has endeavored to
progressively analyze large clinical data sets collected from the clinics and use it to discover new
relationships that have been phenomenal in this field. Knowledge such an s relationship between
the medical records can be used strategically to enhance decision making. The research paper
details the methods used in data collection and analysis of results as explained in the subsequent
sections
1.0 Introduction
Despite the advancement in technology which has led to revolutionary approaches in the
health sector by the automation of most business processes in the fields of medicine, few
advancements have been made towards analysis of this enormous data. This is attributed to usage
of the rudimentary toolkit which focuses on traditional data analysis based on administrative
databases. Such databases lack the insight in providing relationship among variables. This
research paper uses a new paradigm of data mining and knowledge discovery to come up with
new and intriguing relationships among the various phenomena in the health sector (Koh and
Tan, 2011). This is made possible by usage of data warehouses and data marts to store enormous
datasets for analysis. The methodology and methods used in this exploratory study is explained
in the section below
Paraphrase This Document
Need a fresh take? Get an instant paraphrase of this document with our AI Paraphraser
Introduction To Research 5
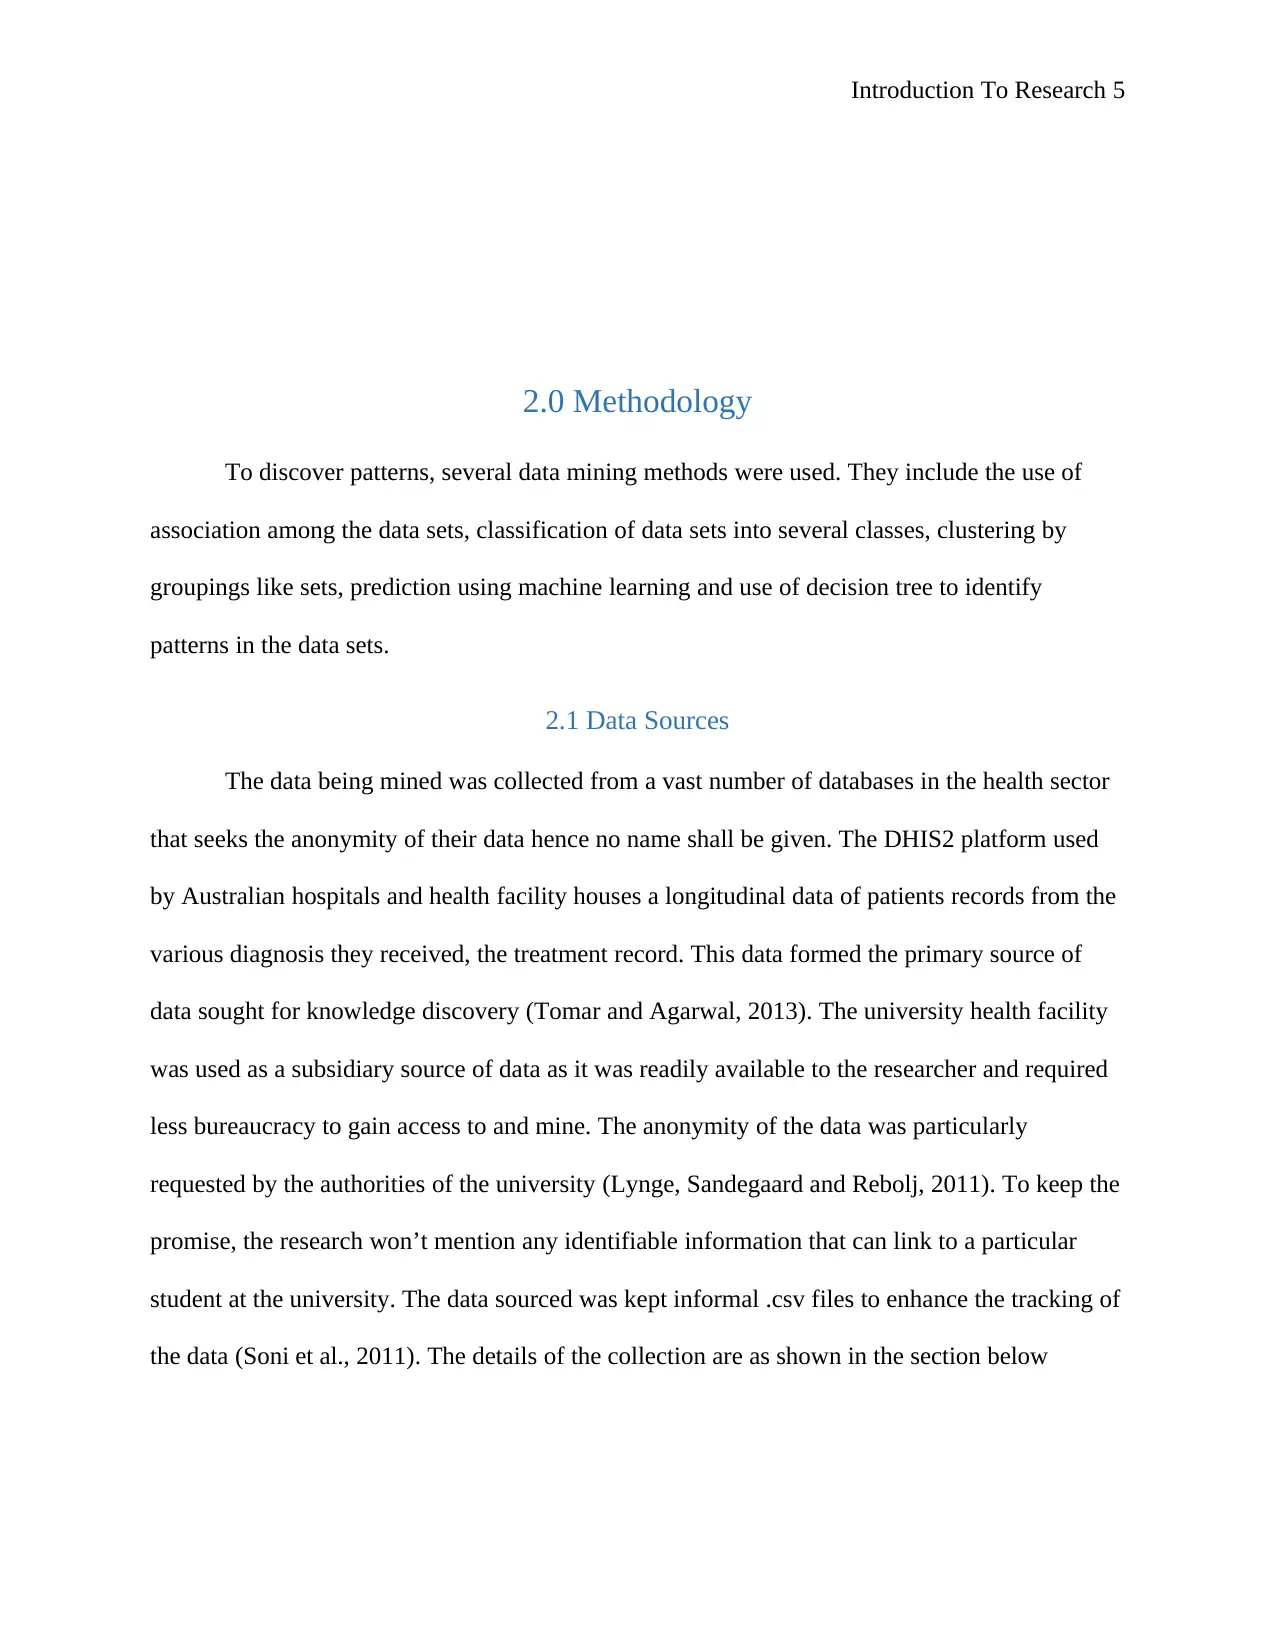
2.0 Methodology
To discover patterns, several data mining methods were used. They include the use of
association among the data sets, classification of data sets into several classes, clustering by
groupings like sets, prediction using machine learning and use of decision tree to identify
patterns in the data sets.
2.1 Data Sources
The data being mined was collected from a vast number of databases in the health sector
that seeks the anonymity of their data hence no name shall be given. The DHIS2 platform used
by Australian hospitals and health facility houses a longitudinal data of patients records from the
various diagnosis they received, the treatment record. This data formed the primary source of
data sought for knowledge discovery (Tomar and Agarwal, 2013). The university health facility
was used as a subsidiary source of data as it was readily available to the researcher and required
less bureaucracy to gain access to and mine. The anonymity of the data was particularly
requested by the authorities of the university (Lynge, Sandegaard and Rebolj, 2011). To keep the
promise, the research won’t mention any identifiable information that can link to a particular
student at the university. The data sourced was kept informal .csv files to enhance the tracking of
the data (Soni et al., 2011). The details of the collection are as shown in the section below
Introduction To Research 6
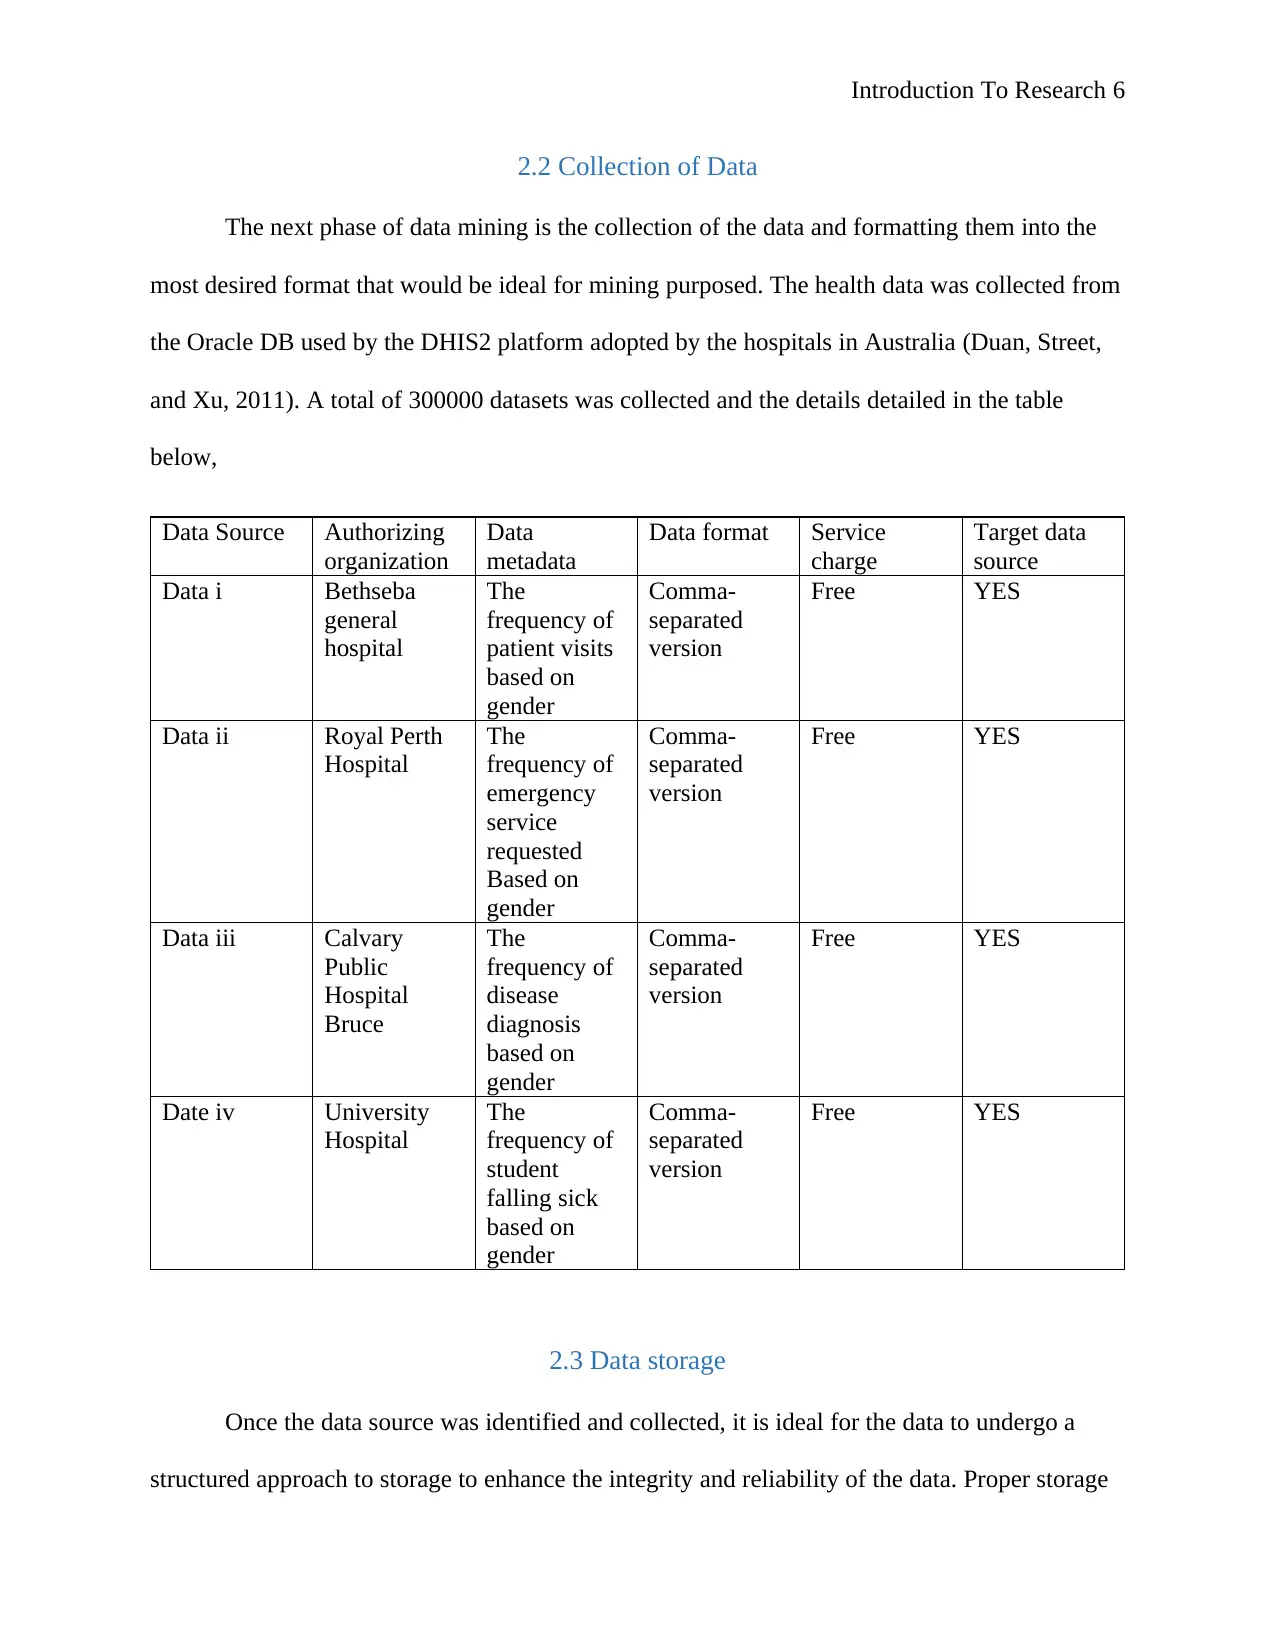
2.2 Collection of Data
The next phase of data mining is the collection of the data and formatting them into the
most desired format that would be ideal for mining purposed. The health data was collected from
the Oracle DB used by the DHIS2 platform adopted by the hospitals in Australia (Duan, Street,
and Xu, 2011). A total of 300000 datasets was collected and the details detailed in the table
below,
Data Source Authorizing
organization
Data
metadata
Data format Service
charge
Target data
source
Data i Bethseba
general
hospital
The
frequency of
patient visits
based on
gender
Comma-
separated
version
Free YES
Data ii Royal Perth
Hospital
The
frequency of
emergency
service
requested
Based on
gender
Comma-
separated
version
Free YES
Data iii Calvary
Public
Hospital
Bruce
The
frequency of
disease
diagnosis
based on
gender
Comma-
separated
version
Free YES
Date iv University
Hospital
The
frequency of
student
falling sick
based on
gender
Comma-
separated
version
Free YES
2.3 Data storage
Once the data source was identified and collected, it is ideal for the data to undergo a
structured approach to storage to enhance the integrity and reliability of the data. Proper storage
⊘ This is a preview!⊘
Do you want full access?
Subscribe today to unlock all pages.
Trusted by 1+ million students worldwide
Introduction To Research 7
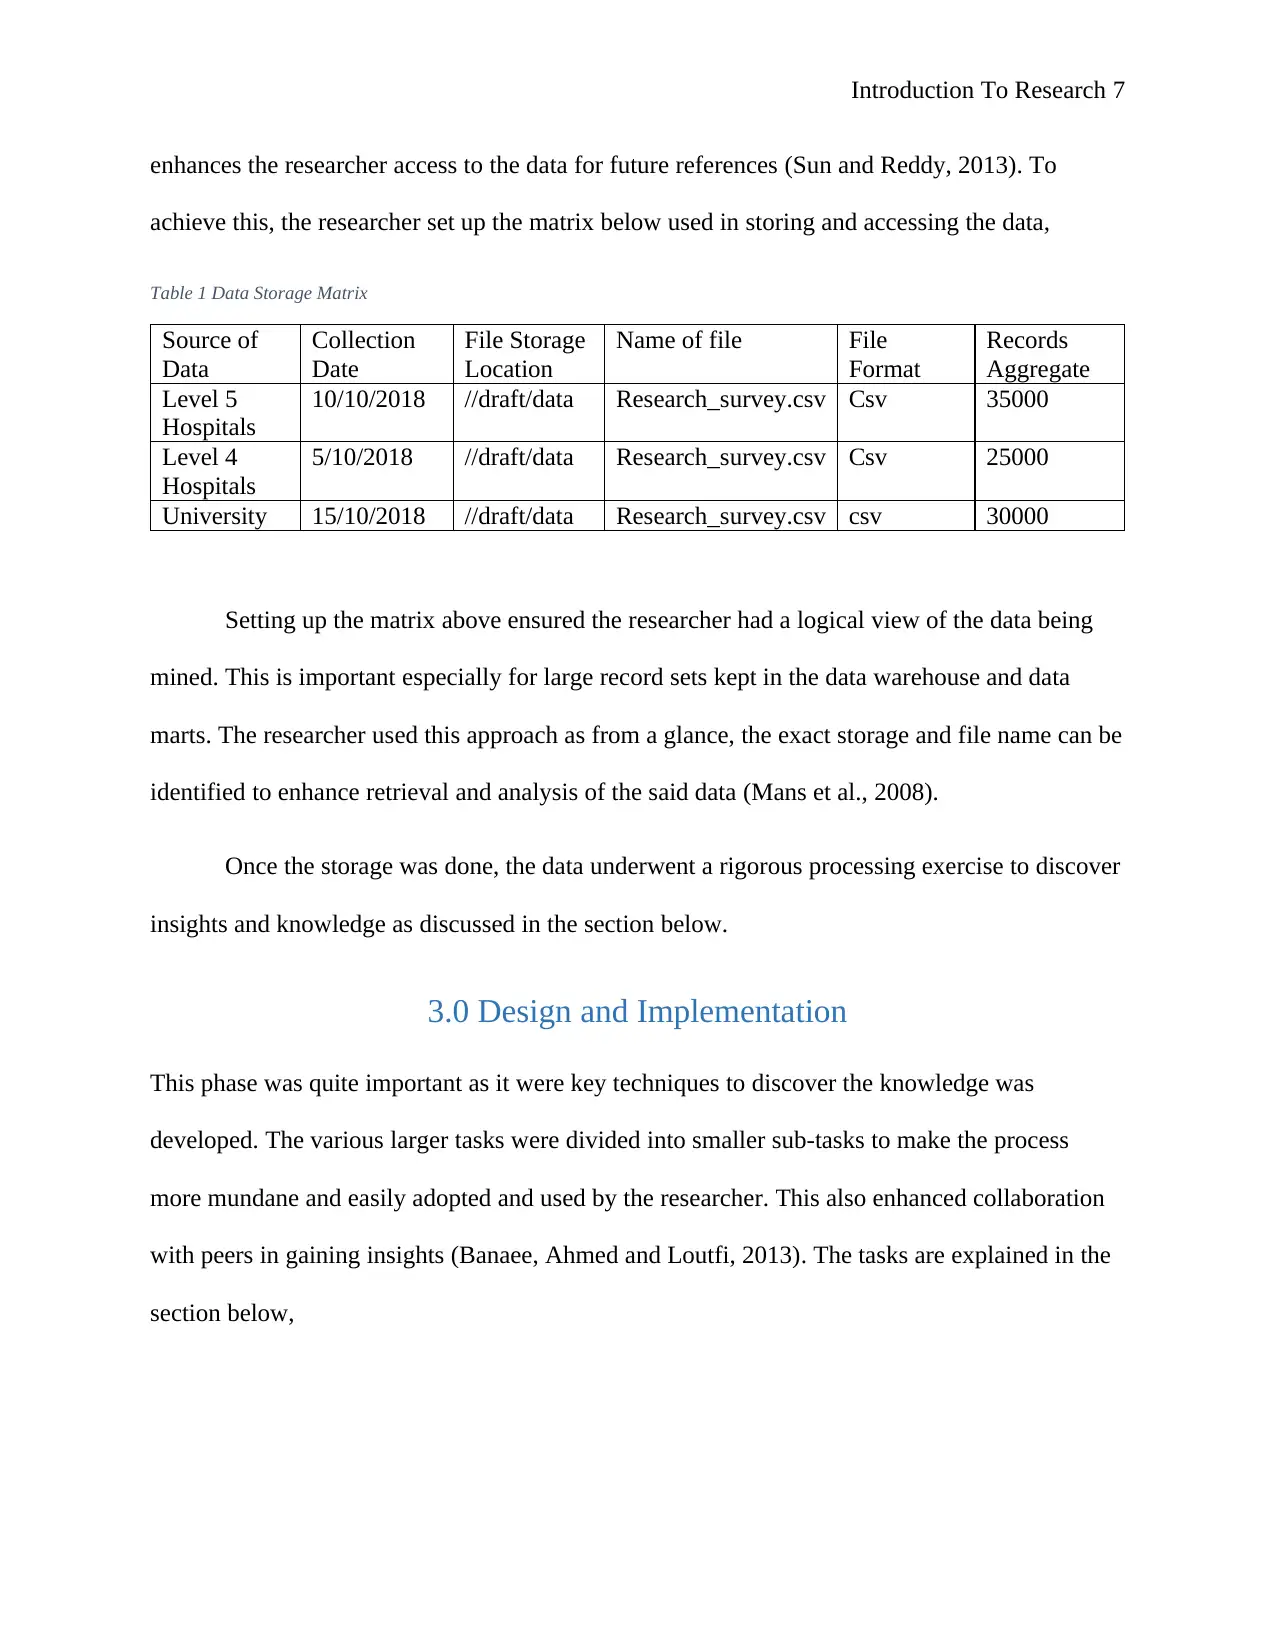
enhances the researcher access to the data for future references (Sun and Reddy, 2013). To
achieve this, the researcher set up the matrix below used in storing and accessing the data,
Table 1 Data Storage Matrix
Source of
Data
Collection
Date
File Storage
Location
Name of file File
Format
Records
Aggregate
Level 5
Hospitals
10/10/2018 //draft/data Research_survey.csv Csv 35000
Level 4
Hospitals
5/10/2018 //draft/data Research_survey.csv Csv 25000
University 15/10/2018 //draft/data Research_survey.csv csv 30000
Setting up the matrix above ensured the researcher had a logical view of the data being
mined. This is important especially for large record sets kept in the data warehouse and data
marts. The researcher used this approach as from a glance, the exact storage and file name can be
identified to enhance retrieval and analysis of the said data (Mans et al., 2008).
Once the storage was done, the data underwent a rigorous processing exercise to discover
insights and knowledge as discussed in the section below.
3.0 Design and Implementation
This phase was quite important as it were key techniques to discover the knowledge was
developed. The various larger tasks were divided into smaller sub-tasks to make the process
more mundane and easily adopted and used by the researcher. This also enhanced collaboration
with peers in gaining insights (Banaee, Ahmed and Loutfi, 2013). The tasks are explained in the
section below,
Paraphrase This Document
Need a fresh take? Get an instant paraphrase of this document with our AI Paraphraser
Introduction To Research 8
3.1 Data Pre-Processing
Before processing starts, it is important to reduce garbage in garbage out phenomena.
This reduces the processing of garbage collected from the field which is a characteristic of most
of the data collection methods. Any inconsistencies and incomplete raw data fetched from the
data source are cleaned to remove such anomalies (Malley, Ramazzotti, and Wu, 2016). Any
duplicate records were removed at this stage to ensure consistencies while incomplete records
were filtered out and remove to ensure the reliability of the data in serving the purpose of mining
and provision of reliable knowledge discovery tool (Chen et al., 2015).
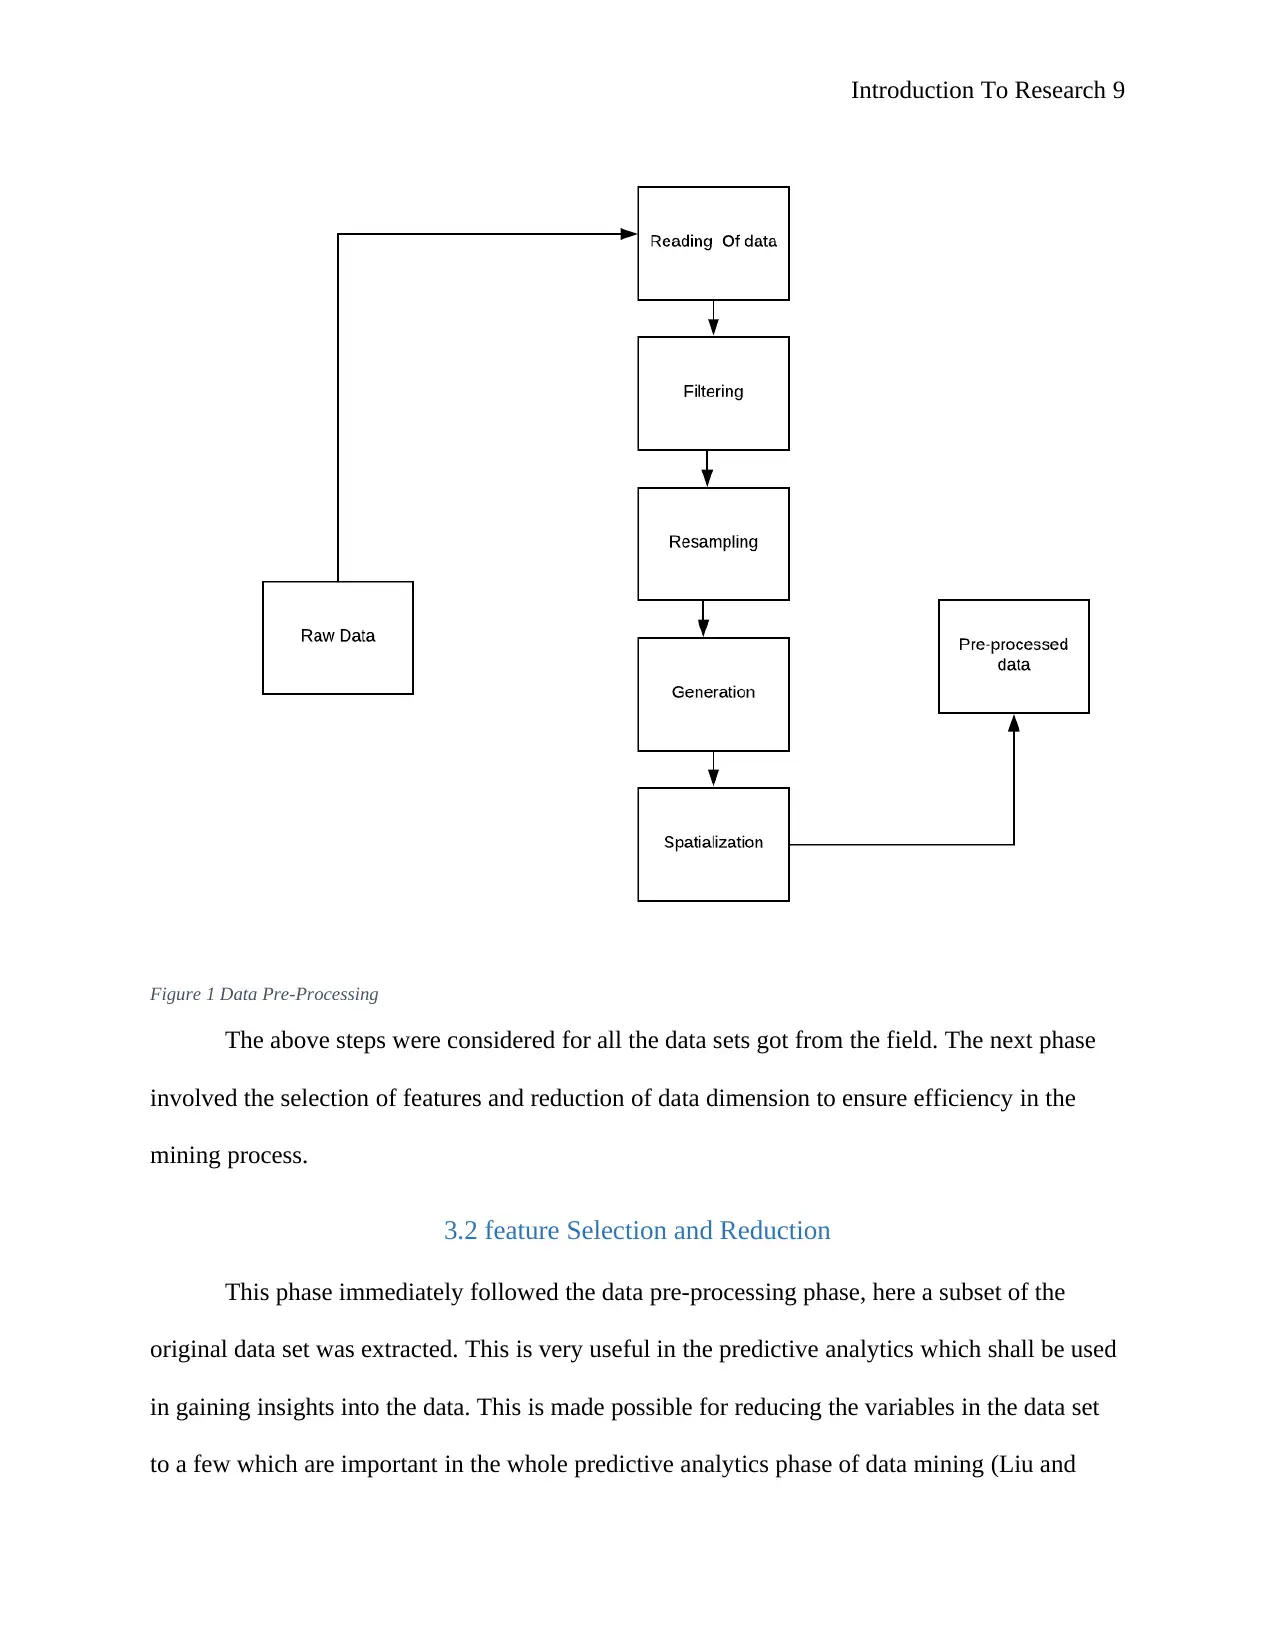
The steps below were used to conduct the data pre-processing is as shown below,
3.1 Data Pre-Processing
Before processing starts, it is important to reduce garbage in garbage out phenomena.
This reduces the processing of garbage collected from the field which is a characteristic of most
of the data collection methods. Any inconsistencies and incomplete raw data fetched from the
data source are cleaned to remove such anomalies (Malley, Ramazzotti, and Wu, 2016). Any
duplicate records were removed at this stage to ensure consistencies while incomplete records
were filtered out and remove to ensure the reliability of the data in serving the purpose of mining
and provision of reliable knowledge discovery tool (Chen et al., 2015).
The steps below were used to conduct the data pre-processing is as shown below,
Introduction To Research 9
Figure 1 Data Pre-Processing
The above steps were considered for all the data sets got from the field. The next phase
involved the selection of features and reduction of data dimension to ensure efficiency in the
mining process.
3.2 feature Selection and Reduction
This phase immediately followed the data pre-processing phase, here a subset of the
original data set was extracted. This is very useful in the predictive analytics which shall be used
in gaining insights into the data. This is made possible for reducing the variables in the data set
to a few which are important in the whole predictive analytics phase of data mining (Liu and
⊘ This is a preview!⊘
Do you want full access?
Subscribe today to unlock all pages.
Trusted by 1+ million students worldwide
Introduction To Research 10
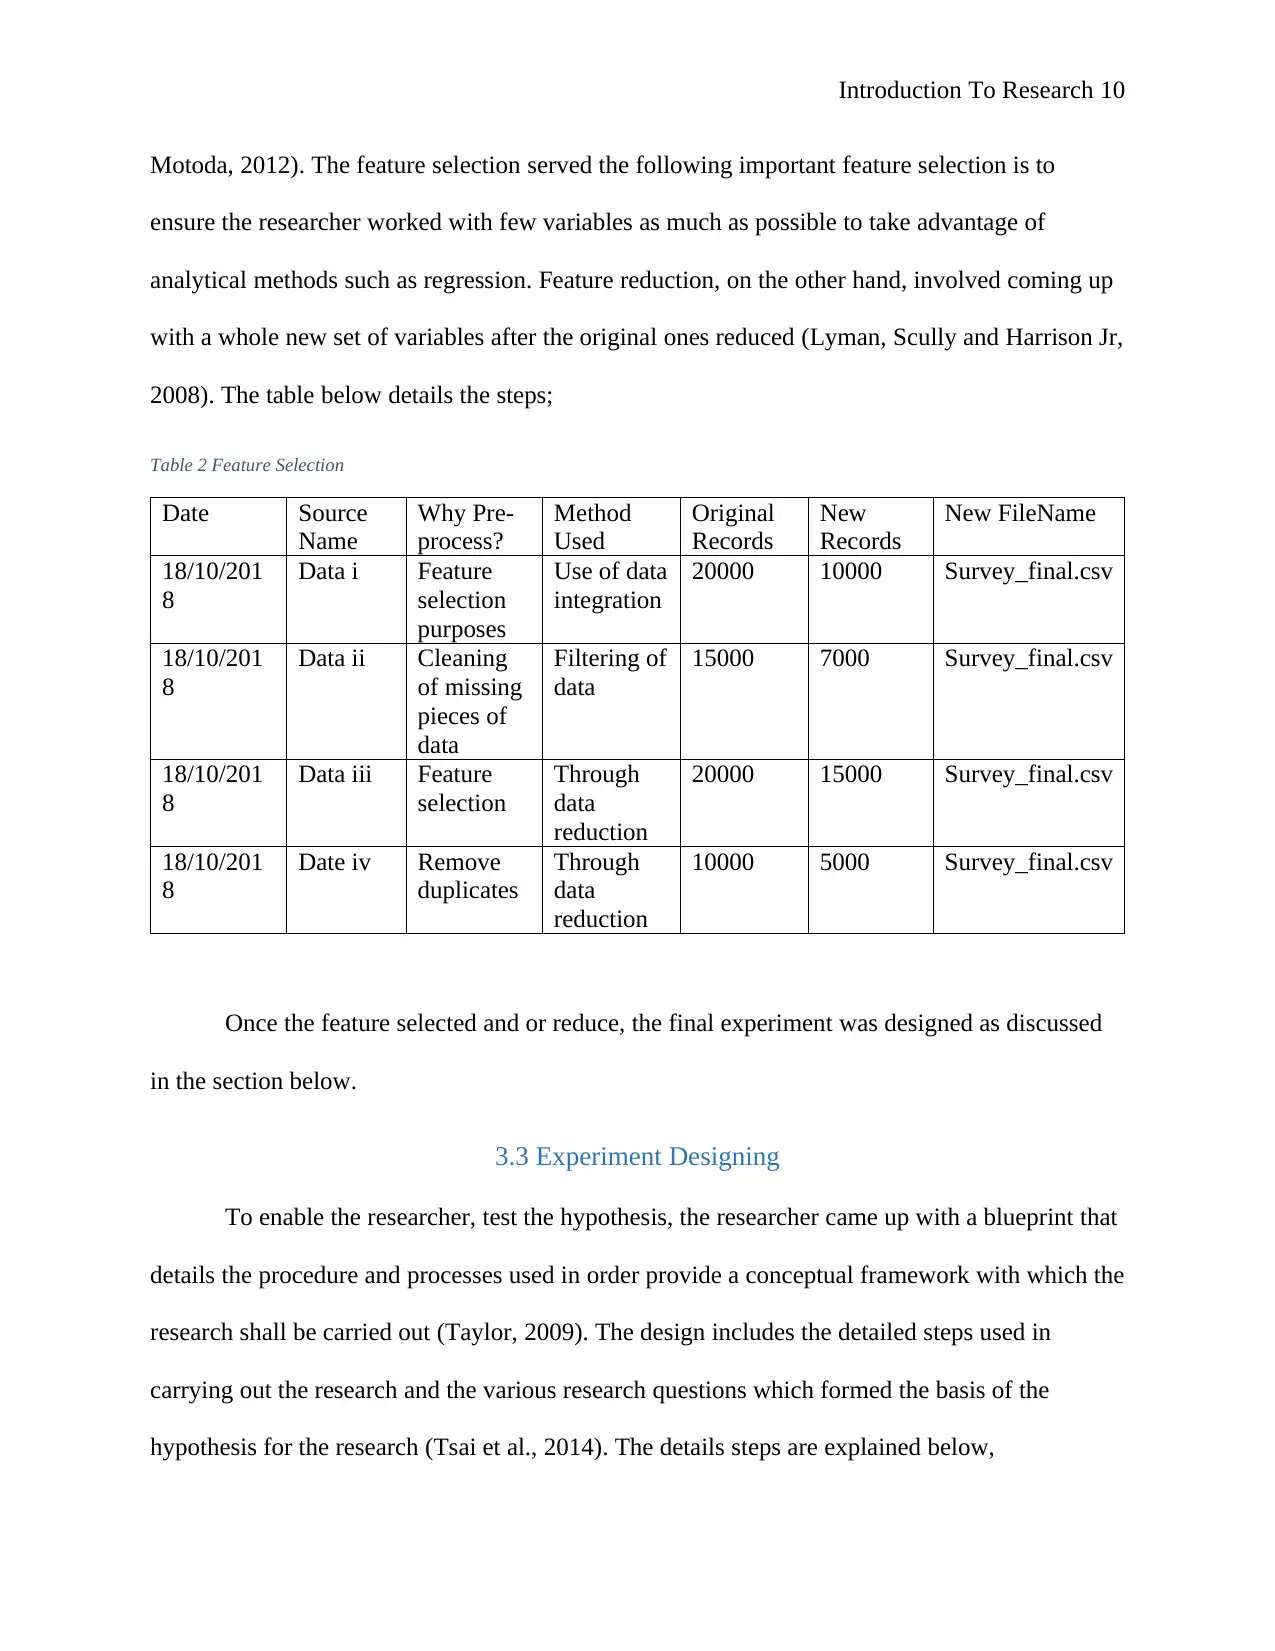
Motoda, 2012). The feature selection served the following important feature selection is to
ensure the researcher worked with few variables as much as possible to take advantage of
analytical methods such as regression. Feature reduction, on the other hand, involved coming up
with a whole new set of variables after the original ones reduced (Lyman, Scully and Harrison Jr,
2008). The table below details the steps;
Table 2 Feature Selection
Date Source
Name
Why Pre-
process?
Method
Used
Original
Records
New
Records
New FileName
18/10/201
8
Data i Feature
selection
purposes
Use of data
integration
20000 10000 Survey_final.csv
18/10/201
8
Data ii Cleaning
of missing
pieces of
data
Filtering of
data
15000 7000 Survey_final.csv
18/10/201
8
Data iii Feature
selection
Through
data
reduction
20000 15000 Survey_final.csv
18/10/201
8
Date iv Remove
duplicates
Through
data
reduction
10000 5000 Survey_final.csv
Once the feature selected and or reduce, the final experiment was designed as discussed
in the section below.
3.3 Experiment Designing
To enable the researcher, test the hypothesis, the researcher came up with a blueprint that
details the procedure and processes used in order provide a conceptual framework with which the
research shall be carried out (Taylor, 2009). The design includes the detailed steps used in
carrying out the research and the various research questions which formed the basis of the
hypothesis for the research (Tsai et al., 2014). The details steps are explained below,
Paraphrase This Document
Need a fresh take? Get an instant paraphrase of this document with our AI Paraphraser

Introduction To Research 11
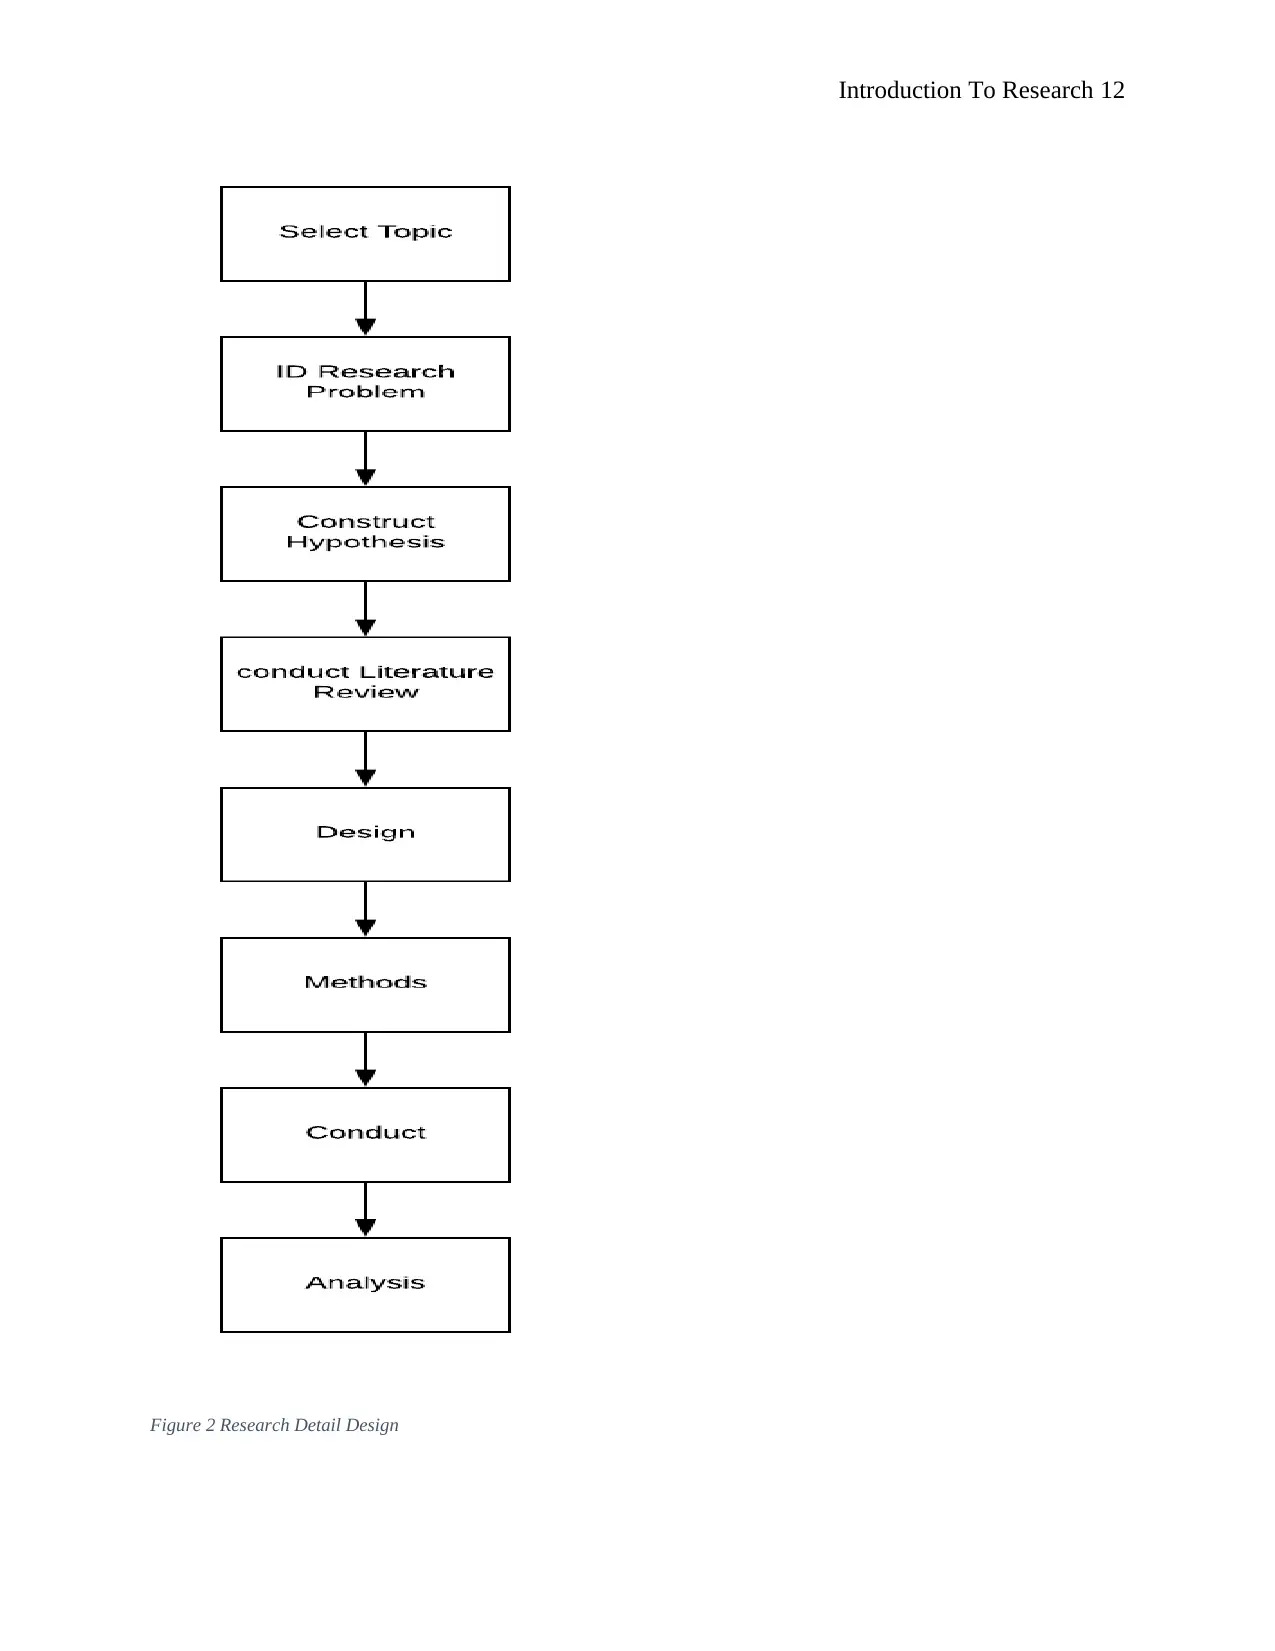
3.3.1 Detailed Design Steps
The research design enhances the researcher’s ability to have a work plan for how the
said research shall be carried out. This enables the researcher to stick to the given schedule used
in executing the research. The details design is as shown below,
3.3.1 Detailed Design Steps
The research design enhances the researcher’s ability to have a work plan for how the
said research shall be carried out. This enables the researcher to stick to the given schedule used
in executing the research. The details design is as shown below,
Introduction To Research 12
Figure 2 Research Detail Design
Figure 2 Research Detail Design
⊘ This is a preview!⊘
Do you want full access?
Subscribe today to unlock all pages.
Trusted by 1+ million students worldwide
1 out of 21
Related Documents


Your All-in-One AI-Powered Toolkit for Academic Success.
+13062052269
info@desklib.com
Available 24*7 on WhatsApp / Email
![[object Object]](/_next/static/media/star-bottom.7253800d.svg)
Unlock your academic potential
Copyright © 2020–2026 A2Z Services. All Rights Reserved. Developed and managed by ZUCOL.