Research Project Part 2: Data Analysis Report on Cultural Diversity

Verified

Added on  2023/01/06

|35
|5750
|44
Report
AI Summary
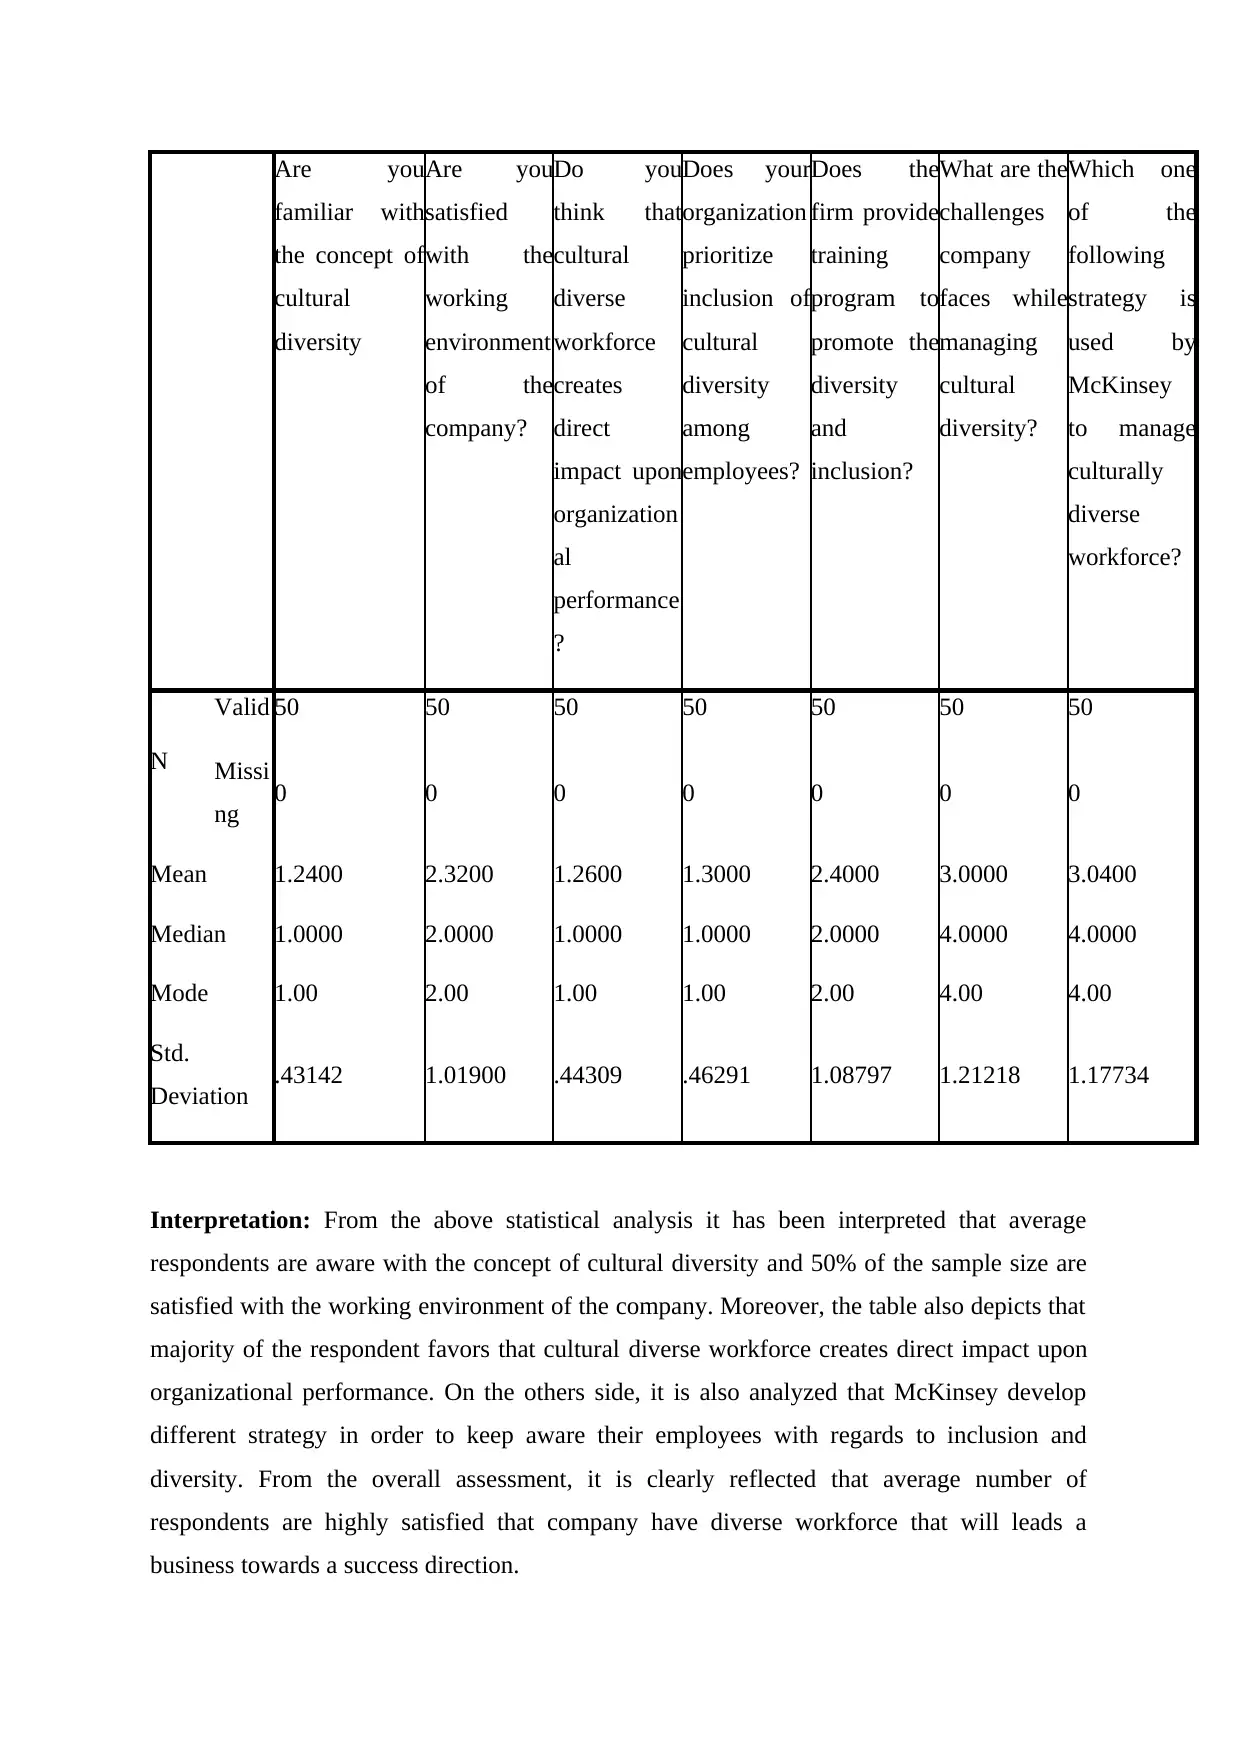
This research project, presented as a report, investigates the impact of cultural diversity on organizational performance. It employs a quantitative research method, utilizing a deductive approach and exploratory design. The study focuses on a sample of 50 respondents, employing random sampling and primary data collection through questionnaires. The data analysis, using thematic analysis, reveals insights into employees' familiarity with cultural diversity, satisfaction with the working environment, and the perceived impact of a diverse workforce on organizational success. The report also examines strategies for promoting inclusion, including training programs, and identifies challenges related to managing cultural diversity, such as employee resistance and communication issues. The findings suggest that a culturally diverse workforce is generally viewed positively, with a majority of respondents acknowledging its beneficial impact on organizational performance and the effectiveness of strategies employed by companies like McKinsey. The research concludes by highlighting the importance of addressing challenges to maximize the benefits of a diverse workplace.
Document Page
Research Project
Part – 2
tabler-icon-diamond-filled.svg

Paraphrase This Document

Need a fresh take? Get an instant paraphrase of this document with our AI Paraphraser
Document Page
Table of Contents
RESEARCH METHODOLOGIES............................................................................................3
Data analysis..............................................................................................................................4
REFERENCES.........................................................................................................................17
Appendix..................................................................................................................................18
Document Page
RESEARCH METHODOLOGIES
Research methods: It is a prominent strategy which is useful in gathering specific set
of data to find valid answers to the research questions. It is sorted into two varied
methodologies which are qualitative and quantitative. Qualitative methods analyses the non-
numerical set of data which is highly significant in understanding key opinions and concepts
(Kumar, 2019). The investigator of the project has selected quantitative method because it
helps in attaining descriptive analytical information which helps in determining the impact
related with the cultural diverse workplace upon the performance of organization.
Research philosophy: It is associated with the key development and nature linked
with the knowledge. It is sorted into two varied philosophy which are interpretivism and
positivism. Interpretivism philosophy is prominent in effectively interpreting key elements
linked with the study. It is shaped by social context and human experience. Positivism
method adheres with the facts and figures which has been gained with the help of
observation. The investigator of the project has selected positivism philosophy which helps in
developing key linkage on impact of cultural diverse workforce and organizational
performance.
Research approach: This is a planned procedure which consist of specific
assumptions to address the research problem. It is sorted into two varied approach which are
inductive and deductive. The investigator of the project has selected deductive approach
because it develops hypothesis and test within the process of research.
Research design: It is a specific strategy which is useful in integrating varied set of
components in a logical manner (Taherdoost, 2016). It is sorted into two varied design which
are exploratory and descriptive. The investigator of the project has selected exploratory
method which is useful in investigating on the specific research problem because it has no
relevant set of past records or information. It is useful for the proper discovering of existing
knowledge and other set of unfamiliar concepts.
Research strategy: This method helps the researcher in addressing the key relevant
objectives of the research project. Appropriate set of questionnaire has been framed where the
quantitative set of information has been collected to manage culturally diverse workforce
with appropriate strategies.
Document Page
Data collection: This is a prominent procedure which measures and effectively
collect data on the key set variables to answer stated set of research questions and also
evaluate the outcomes. It is sorted into two varied sources of collecting data which are
primary and secondary. Moreover, the secondary source is the data which has already been
collected and has been further used for the purpose of investigation (Kumar, 2019). The
investigator of the project has selected primary source of collecting data. Here, the first-hand
information has been gathered by developing a questionnaire.
Sampling: It is useful for the appropriate selection of the sample who has desired set
of features and characteristics from the large set of population. It is sorted into two varied
sampling method which are probabilistic and non- probabilistic. Probabilistic method
generally looks to provide all the respondent an equal chance to get selected in the sample
size (Wang and et.al., 2019). At the same time non probabilistic do not provide an equal
chance for the respondent to get selected in the sample size of the company. In regard to the
current study simple random sampling method has been used to find out the sample size of
the company in long run. The investigator of the project has selected random sampling
method where 50 respondents has been chosen.
Data Analysis: Data collected with the help of data collection tool need to be
analyzed and present in a way that it used to give clear image to the reader of the same. For
the same reason thematic data analysis tool will be used in the research. Under the same data
analysis tool variety of different themes will be made and different outcome will be presented
with the help of the table and graphs in the report in general.
Data analysis
Statistics
tabler-icon-diamond-filled.svg

Paraphrase This Document

Need a fresh take? Get an instant paraphrase of this document with our AI Paraphraser
Document Page
Are you
familiar with
the concept of
cultural
diversity
Are you
satisfied
with the
working
environment
of the
company?
Do you
think that
cultural
diverse
workforce
creates
direct
impact upon
organization
al
performance
?
Does your
organization
prioritize
inclusion of
cultural
diversity
among
employees?
Does the
firm provide
training
program to
promote the
diversity
and
inclusion?
What are the
challenges
company
faces while
managing
cultural
diversity?
Which one
of the
following
strategy is
used by
McKinsey
to manage
culturally
diverse
workforce?
N
Valid 50 50 50 50 50 50 50
Missi
ng 0 0 0 0 0 0 0
Mean 1.2400 2.3200 1.2600 1.3000 2.4000 3.0000 3.0400
Median 1.0000 2.0000 1.0000 1.0000 2.0000 4.0000 4.0000
Mode 1.00 2.00 1.00 1.00 2.00 4.00 4.00
Std.
Deviation .43142 1.01900 .44309 .46291 1.08797 1.21218 1.17734
Interpretation: From the above statistical analysis it has been interpreted that average
respondents are aware with the concept of cultural diversity and 50% of the sample size are
satisfied with the working environment of the company. Moreover, the table also depicts that
majority of the respondent favors that cultural diverse workforce creates direct impact upon
organizational performance. On the others side, it is also analyzed that McKinsey develop
different strategy in order to keep aware their employees with regards to inclusion and
diversity. From the overall assessment, it is clearly reflected that average number of
respondents are highly satisfied that company have diverse workforce that will leads a
business towards a success direction.
Document Page
Theme 1: Concept of cultural diversity
Are you familiar with the concept of cultural diversity
Frequency Percent Valid Percent Cumulative
Percent
Valid
Yes 38 76.0 76.0 76.0
No 12 24.0 24.0 100.0
Total 50 100.0 100.0
Document Page
Interpretation: After going through the variety of different data which was collected with
the help of primary data collection tool, it was clearly understood that there is good sort of
understanding about the cultural diversity in the organization. Collected data shows that out
of the pool of 50 participant, 38 participant has gone with the option of yes in the survey and
only 12 participant has gone with the option of no. Hence, it is very good sign for the
company as if any decision will be taken in regard to maintaining cultural diversity all the
employee will understand the importance of same and will support the management as well.
Theme 2: Respondents are satisfied with the working environment
Are you satisfied with the working environment of the company?
Frequency Percent Valid Percent Cumulative
Percent
Strongly satisfied 7 14.0 14.0 14.0
Satisfied 30 60.0 60.0 74.0
Neutral 6 12.0 12.0 86.0
Dissatisfied 4 8.0 8.0 94.0
Strongly dissatisfied 3 6.0 6.0 100.0
Total 50 100.0 100.0
tabler-icon-diamond-filled.svg

Paraphrase This Document

Need a fresh take? Get an instant paraphrase of this document with our AI Paraphraser
Document Page
Interpretation: Collected data as a form of primary data collection form used to give idea
that there are good number of the respondent in the survey who are happy with the type of
working environment which is maintained in the organization. As collected data shows that
out of pool of 50 participants 30 respondent has gone with the same topic in the research. It is
good sign for the company but on the another flip of coin organization also has to consider
that there are only 7 participants who are strongly agreed. Hence, organization has to take
different decision to manage working environment at workplace.
Theme 3: Cultural diverse workforce creates direct impact upon organizational
performance
Document Page
Do you think that cultural diverse workforce creates direct impact upon
organizational performance?
Frequency Percent Valid Percent Cumulative
Percent
Valid
Yes 37 74.0 74.0 74.0
No 13 26.0 26.0 100.0
Total 50 100.0 100.0
Interpretation: Collected data as a part of data collection section help the research in
understanding and passing on the information that building a cultural diversified workforce
used to bring the impact on the performance of the organization in the long run. Out of total
data collected 37 participant has gone with the option of Yes, whereas remaining 13
Document Page
participant has gone with the option of No. This result was also passed on by the author in
Literature review section that building good culturally diverse workforce used to bring
variety of different sort of negative and positive impact for the company in long run.
Theme 4: Yes, McKinsey prioritize inclusion
Does your organization prioritize inclusion of cultural diversity among
employees?
Frequency Percent Valid Percent Cumulative
Percent
Valid
Yes 35 70.0 70.0 70.0
No 15 30.0 30.0 100.0
Total 50 100.0 100.0
tabler-icon-diamond-filled.svg

Paraphrase This Document

Need a fresh take? Get an instant paraphrase of this document with our AI Paraphraser
Document Page
Interpretation: After understanding the different data which has been collected with the help
of data analysis tool it was understood by the scholar that McKinsey generally used to
include the prioritization of different activity to maintain the cultural diversity among the
employee in organization. As out of pool of 50 participants 35 respondent has gone with the
option of Yes, whereas 15 participants have gone with the option of No in the survey. Hence,
it is very good sign for the company but at the same time organization also has to make sure
that they do not overlook the opinion of 15 participants as 15 participants is not that small
number to be ignored at all.
Theme 5: Cited firm offer range of training programs to their employees for create
awareness
Document Page
Does the firm provide training program to promote the diversity and inclusion?
Frequency Percent Valid Percent Cumulative
Percent
Valid
Strongly agreed 7 14.0 14.0 14.0
Agreed 28 56.0 56.0 70.0
Neutral 7 14.0 14.0 84.0
Disagreed 4 8.0 8.0 92.0
Strongly disagreed 4 8.0 8.0 100.0
Total 50 100.0 100.0
chevron_up_icon
1 out of 35
circle_padding
hide_on_mobile
zoom_out_icon
[object Object]