Research Design, Validity and Reliability of Instruments
VerifiedAdded on 2023/03/31
|16
|3313
|185
Report
AI Summary
This report delves into the critical aspects of research design, validity, and reliability, focusing on the use of instruments like questionnaires in data collection. It explores various research designs such as historical, exploratory, and longitudinal designs, emphasizing the importance of instrument suitability based on factors like participant literacy. The report discusses reliability analysis, including Cronbach's alpha, and its role in assessing internal consistency. It examines the constructs of employee motivation and job satisfaction, presenting findings from reliability tests and suggesting improvements through item deletion. The analysis highlights the significance of ensuring instrument validity and reliability for accurate and meaningful research outcomes, concluding with the unreliability and invalidity of the used instrument based on the results.

Research design, validity and reliability of research instruments
Research design, validity and reliability of research instruments
Author’s name:
University:
Research design, validity and reliability of research instruments
Author’s name:
University:
Paraphrase This Document
Need a fresh take? Get an instant paraphrase of this document with our AI Paraphraser
Research design, validity and reliability of research instruments
Abstract
The major reason of this report was to discuss and investigate the research design, reliability and validity of
research instruments. Instruments used in the data collection process play major roles in boosting the
accuracy of the collected data. One of the major examples of research instruments is the questionnaire that is
widely used by researchers in data collections. Research design is vital in the identification of which
methodology to apply and they include historical, exploratory and longitudinal design among other designs.
The research instruments can be made more suitable by putting into consideration the level of literacy of the
participants and using the simplest language that is understandable to all. Research instrument with internal
consistency measure of (α>=0.7) is considered good and acceptable while those with the internal
consistency of less than 0.7 has poor internal consistency and unreliable which was the case with the
instrument used in this study. From the results all items were invalid from validity test since they never met
the threshold of the Pearson’s coefficient from the table (r=0.7545). The study therefore concluded that the
instrument used was unreliable and invalid as from the results.
Research design, validity and reliability of research instruments
Introduction
Research has been for a long time very fundamental in developing new theories,
supporting the already existing theories and unearthing new ideas shaping the phenomena in
different organizations and institutions around the globe. All the efforts are to identify
appropriate targeted population and to collect data that best suit the subject under investigation.
It has been a bit challenging to come up with suitable primary data since the researcher need to
approach the participants either physically or through other means depending on the method laid
down by the researcher. Data is therefore very vital and they are used to either support or discern
developing thoughts, the earlier developed thoughts, develop new appropriate thoughts and
correcting the flaws in the already existing thoughts for their validity as per that period of time
(Costantini et al, 2015). In that regard, the researcher ought to choose the most suitable data
collection method that will lead to the data that best suit the interest of the subject of study
(Waltman et al, 2012).
Identification, description and history development of data collection instruments
There are variety of data collection methods used by the researchers in the data collection
process. Among the data collection methods are the interviews, questionnaires and surveys,
observations, focus groups, documents and records (Weigold, Weigold, & Russell, 2013).
Surveys are customary ways of data collection applied in the non-experimental events that
describes the reality in investigating the prevalence of a certain condition (Wallace, Kelcey, &
Ruzek, 2016). They are widely used in collecting data concerning the attitudes and behaviours of
the targeted population and it can either be applied in the proportion of the population or the
⊘ This is a preview!⊘
Do you want full access?
Subscribe today to unlock all pages.
Trusted by 1+ million students worldwide
Research design, validity and reliability of research instruments
entire population since it can take any form. There are different types of surveys including;
cross-sectional surveys, longitudinal surveys and explanatory or correlational surveys.
Questionnaires being part of the survey, they are widely used as the data collection
instrument from a large number of people. They need to be well structured so that they can
produce valid and meaningful results. The questions used in structuring the questionnaire need to
be simple to understand by the participants, clear and precise to the point. It is the research
instrument that have been widely used by the researchers in the collection of data.
Research design
Research designs used by the researchers include historical design, exploratory design,
longitudinal design, meta-Analysis design, observational design, experimental design,
descriptive design and cross-sectional design among others. Historical design is one of the
research designs used by the researchers in collecting, verifying and synthesizing the past
evidences to draw facts and either support or refute the hypothesis (Peppas, 2013). For example,
in this case understanding the effects of employees’ motivation and job satisfaction.
Furthermore, this was to base on the history of employees’ motivation and their effects of
performance in an organization and how satisfaction of the employees in their jobs might affect
their performance in an organization. Exploratory design is the type of design used by
researchers in the case where the problem under study has few or no previous studies to be used
for reference that can help in predicting the intended results (Ponelis, 2015). The design is
widely applicable in cases where problems are in their initial stages of investigation. Researchers
use the design more often to understand how to continue studying the problem and make choice
of methodology to be engaged in data collection. Longitudinal design is applied where the same
sample is used over a period of time with the same participants interviewed at regular intervals
Paraphrase This Document
Need a fresh take? Get an instant paraphrase of this document with our AI Paraphraser
Research design, validity and reliability of research instruments
thus enabling the researchers to identify changes and the factors that might be resulting to
changes.
Suitability of data collection instrument
Questionnaire as the data collection instrument will increase its suitability when all the
questions are structured in a good manner. In the process of designing the questionnaire, the
instrument can be made more suitable when the researcher consider the literacy level of the
respondents in order to increase the response rate (Bee & Murdoch-Eaton, 2016). The questions
should be precise and directed towards addressing the subject matter of the research. The design
of questionnaire therefore determines its suitability as the data collection instrument. In some
instances where the researcher is concerned with measuring the attitudes of the respondents, they
tend to design the questionnaires with items with Likert scale stating their level of agreement,
how they are motivated and the level of satisfaction among others.
Reliability analysis
This is the process of ensuring the fact that used scale consistently reflect the construct it
is intended to measure. Split half reliability is a technique that used to be employed by dividing
data into 2 parts. Scores from each participant is computed and the scale compared with the
Pearson’s score and assumed to be equal to the other half. This method was corrupted due to the
fact that there are several ways in which data could be split which would lead to numerous
results.
In overcoming the shortcomings of that method, Cronbach’s alpha was introduced which
measured reliability of the items in the construct more accurately. This measure splits the data
into two halves in all possible ways then proceeds to calculate the correlation coefficients of the
Research design, validity and reliability of research instruments
splits where the average values of the splits are obtained which now represent the value of
Cronbach’s alpha. Not all the value of Cronbach’s alpha are accepted as the best measure of
reliability of the items of a construct but they are chosen depending on the range of scale the
calculated value of Cronbach’s alpha lies. In reliability analysis, Cronbach’s alpha of 0.8 is
considered acceptable in the case of measuring intelligence and 0.7 in the case of measuring
ability of the respondents.
Constructs
In this case, constructs that will be used include employee motivation and job
satisfaction. Most of the organizations had been concerned with how they can optimize the
profits of their business enterprises. In that regard therefore, this report chose the following on
employee motivation and employees’ job satisfaction. The following items were obtained in
regards to employee motivation and employees’ job satisfaction.
Employee motivation
The items included;
1. I feel the sense individual satisfaction when I perform my duties well
2. I feel so bad when I mess up in my duties and roles at work
3. I try to find ways of doing my job in the most effective way
Employee job satisfaction
The items included;
1. My job’s working hours are averagely moderate
2. I receive fair pay for my services at work
⊘ This is a preview!⊘
Do you want full access?
Subscribe today to unlock all pages.
Trusted by 1+ million students worldwide
Research design, validity and reliability of research instruments
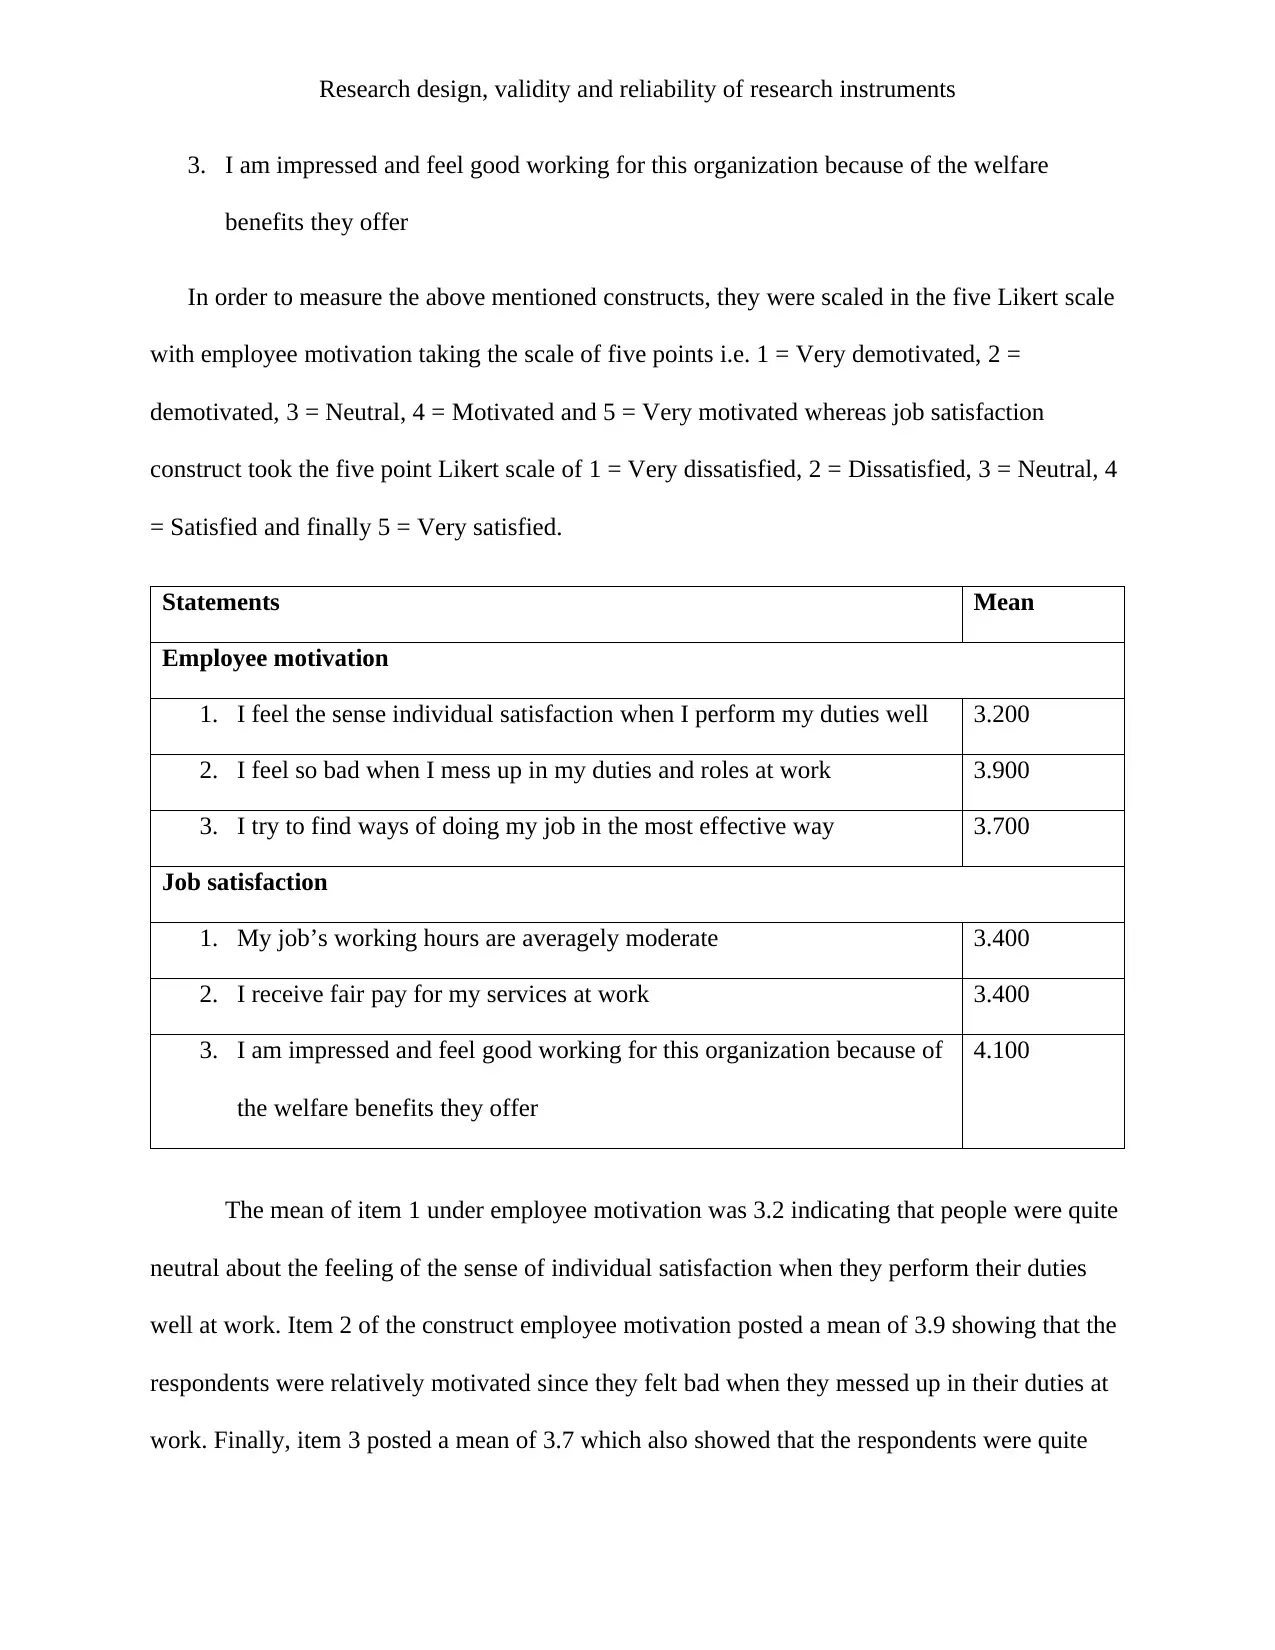
3. I am impressed and feel good working for this organization because of the welfare
benefits they offer
In order to measure the above mentioned constructs, they were scaled in the five Likert scale
with employee motivation taking the scale of five points i.e. 1 = Very demotivated, 2 =
demotivated, 3 = Neutral, 4 = Motivated and 5 = Very motivated whereas job satisfaction
construct took the five point Likert scale of 1 = Very dissatisfied, 2 = Dissatisfied, 3 = Neutral, 4
= Satisfied and finally 5 = Very satisfied.
Statements Mean
Employee motivation
1. I feel the sense individual satisfaction when I perform my duties well 3.200
2. I feel so bad when I mess up in my duties and roles at work 3.900
3. I try to find ways of doing my job in the most effective way 3.700
Job satisfaction
1. My job’s working hours are averagely moderate 3.400
2. I receive fair pay for my services at work 3.400
3. I am impressed and feel good working for this organization because of
the welfare benefits they offer
4.100
The mean of item 1 under employee motivation was 3.2 indicating that people were quite
neutral about the feeling of the sense of individual satisfaction when they perform their duties
well at work. Item 2 of the construct employee motivation posted a mean of 3.9 showing that the
respondents were relatively motivated since they felt bad when they messed up in their duties at
work. Finally, item 3 posted a mean of 3.7 which also showed that the respondents were quite
Paraphrase This Document
Need a fresh take? Get an instant paraphrase of this document with our AI Paraphraser
Research design, validity and reliability of research instruments
motivated since they tried to find ways on doing their jobs in the most effective way. Reliability
test for employee motivation had the Cronbach’s alpha of (α=0.401) which was unacceptable
internal consistency. It would be corrected if item 3 was deleted from the list of items since that
would rise Cronbach’s alpha to (α=0.723) which is within the acceptable scale limit of internal
consistency.
For construct job satisfaction, item 1 posted a mean of 3.4 which showed that the
respondents were neutral about their feelings whether they satisfied with their job working hours
or not. Item 2 posted the mean of 3.4 which also showed that respondents were neutral on their
feelings about whether they were satisfied with the pay they received at work or not and finally,
item 3 posted mean of 4.1 which indicated that respondents were certainly satisfied with the
welfare benefits provided by their organizations. The reliability test of items for job satisfaction
posted the Cronbach’s alpha of (α=0.651) which was unacceptable internal consistency. The
internal consistency and Cronbach’s alpha score would be corrected by deleting item Q2
resulting to Cronbach’s alpha coeffient of (α=0.821) which would be acceptable internal
consistency.
Cronbach’s alpha analysis (reliability) from dummy SPSS file
In this report, the study was assessing the relationship between employees’ motivation
and employees’ job satisfaction. Six items picked from the dummy SPSS file were Q3, Q7, Q8,
Q13, Q17 and Q26. From reliability analysis, the results indicated that the items had reliable
measure of (α=0.548). Internal consistency of the items could be increased if some items were to
be deleted. In that case therefore, further reliability analysis results showed that the results of the
reliability test would be improved if item (Q8) was to be deleted from the list of items. On
Research design, validity and reliability of research instruments
deleting the item (Q8) reliability measure would post Cronbach’s alpha of (α=0.632) unlike
when others would have been deleted. Furthermore, item (Q26) was deleted from the list of
items which further improved the reliability score to (α=0.654) which still fell under the
acceptable limit of internal consistency. From this point, further deletion of any of the items
remaining in the list would negatively affect the reliability score and Cronbach’s alpha since the
score will reduce i.e. (α=0.622) if item (Q7) and (Q3) were deleted. This further confirmed that
the items selected were not reliable and unsuitable for determining the relationship between
employees’ motivation and job satisfaction.
Tabular presentation is the presentation of data in the tabular form where they are laid in rows
and columns. The table of Cronbach’s alpha are provided at the appendix of this report.
Validity of the instrument
Validity measure the extent to which a measurement well corresponds to what is being
measured in the real value world accurately (Rickards, Magee & Artino, 2012). Validity of the
instrument used can be tested using inter-Item correlation matrix where the correlation
coefficients is to be compared with the critical value of Pearson’s correlation coefficient from the
table (Douglas & Purzer, 2015). Correlation matrix is the representation of correlation
coefficients of the variables in rows and columns with the leading diagonal of the matrix taking
the perfect correlation coefficient i.e. (r=1.00) of a variable and itself (Cheung & Lee, 2012).
From the table, the correlation coefficient for a two tailed proportion at significance level of 0.05
and degree of freedom of (df=5, r=0.7545). The correlation coefficients from the correlation
matrix table will be compared with the value of r from the table.
⊘ This is a preview!⊘
Do you want full access?
Subscribe today to unlock all pages.
Trusted by 1+ million students worldwide
Research design, validity and reliability of research instruments
Table 1: Inter-item Correlation matrix
Q3 Q7 Q8 Q13 Q17 Q27 EmployMot
Q3
Pearson Correlation 1 1.000** -.035 -.019 -.019 -.321** .556**
Sig. (2-tailed) .000 .625 .788 .788 .000 .000
N 200 200 199 199 199 199 197
Q7
Pearson Correlation 1.000** 1 -.035 -.019 -.019 -.321** .556**
Sig. (2-tailed) .000 .625 .788 .788 .000 .000
N 200 200 199 199 199 199 197
Q8
Pearson Correlation -.035 -.035 1 -.006 -.006 .415** .593**
Sig. (2-tailed) .625 .625 .938 .938 .000 .000
N 199 199 199 198 198 198 197
Q13
Pearson Correlation -.019 -.019 -.006 1 1.000** .182* .088
Sig. (2-tailed) .788 .788 .938 .000 .010 .222
N 199 199 198 199 199 198 196
Q17
Pearson Correlation -.019 -.019 -.006 1.000** 1 .182* .088
Sig. (2-tailed) .788 .788 .938 .000 .010 .222
N 199 199 198 199 199 198 196
Q27
Pearson Correlation -.321** -.321** .415** .182* .182* 1 .351**
Sig. (2-tailed) .000 .000 .000 .010 .010 .000
N 199 199 198 198 198 199 197
EmployMot
Pearson Correlation .556** .556** .593** .088 .088 .351** 1
Sig. (2-tailed) .000 .000 .000 .222 .222 .000
N 197 197 197 196 196 197 197
**. Correlation is significant at the 0.01 level (2-tailed).
*. Correlation is significant at the 0.05 level (2-tailed).
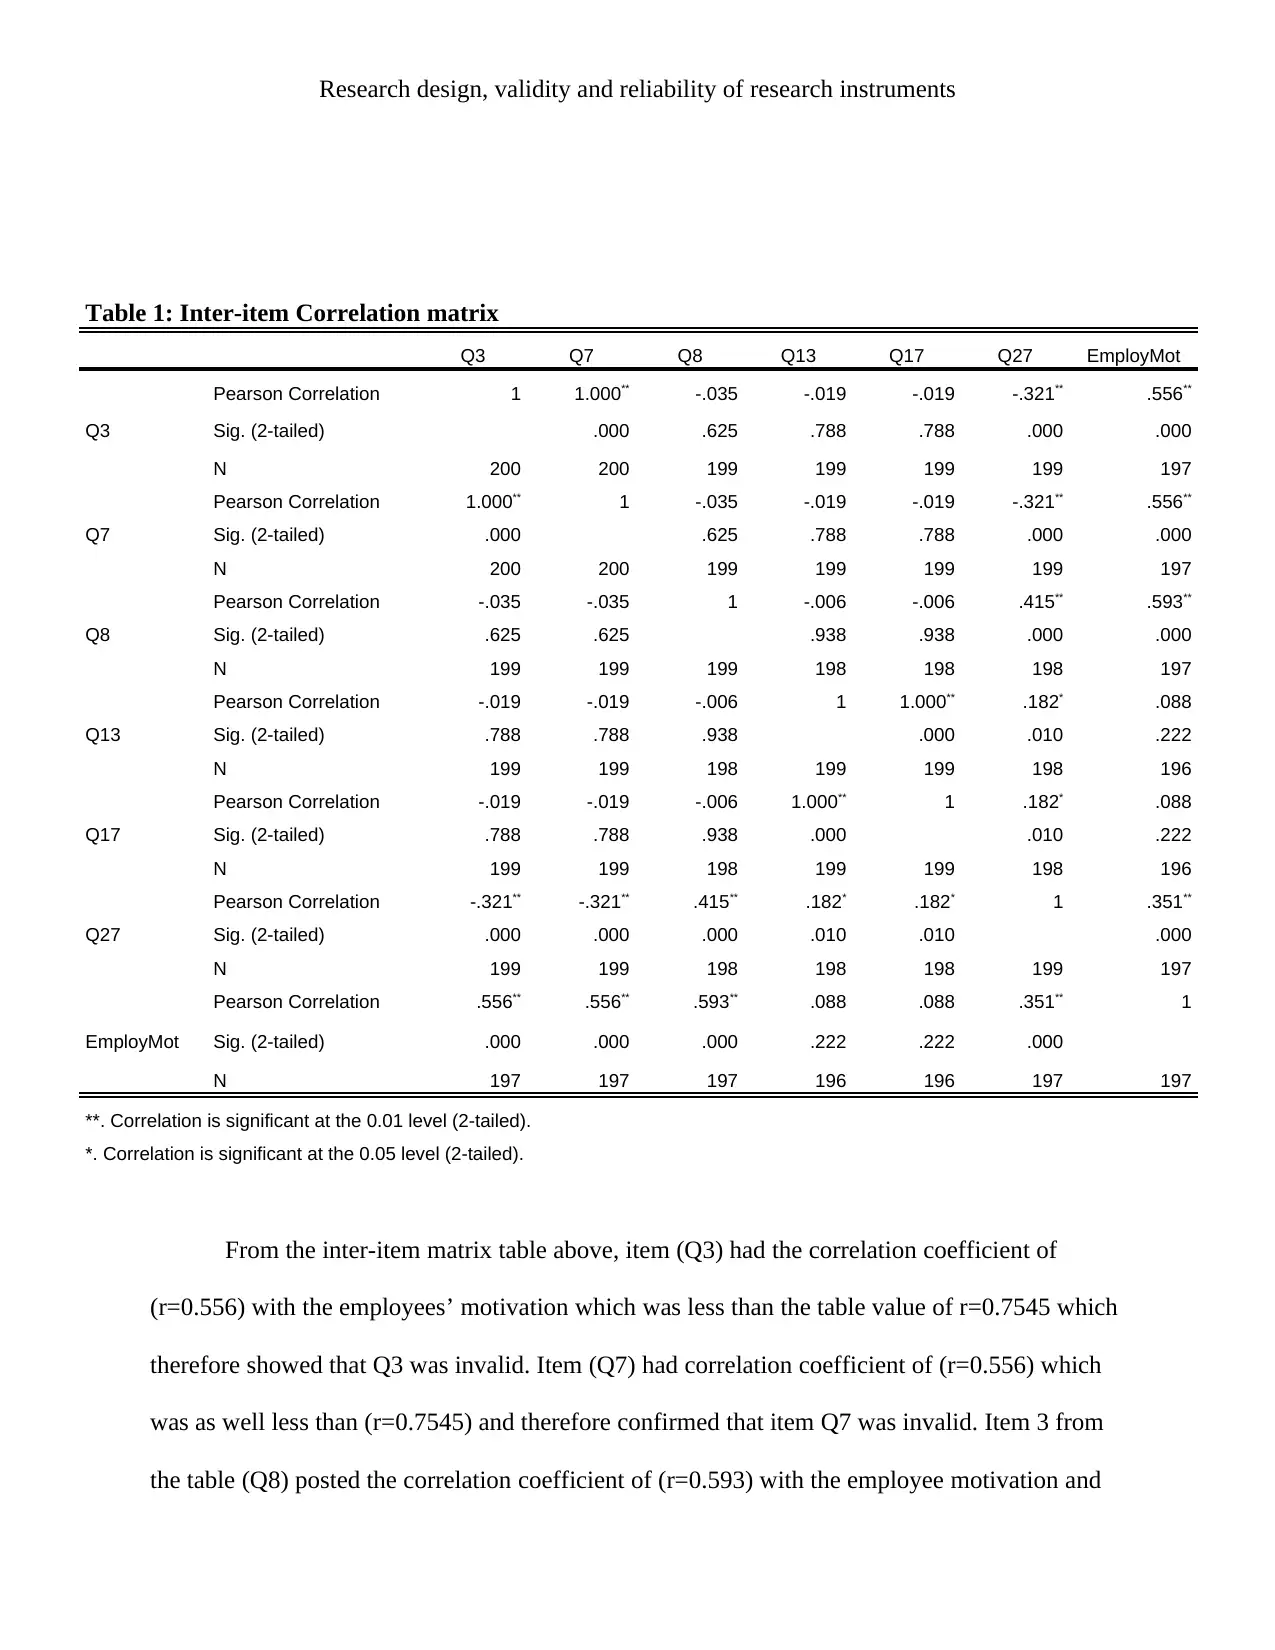
From the inter-item matrix table above, item (Q3) had the correlation coefficient of
(r=0.556) with the employees’ motivation which was less than the table value of r=0.7545 which
therefore showed that Q3 was invalid. Item (Q7) had correlation coefficient of (r=0.556) which
was as well less than (r=0.7545) and therefore confirmed that item Q7 was invalid. Item 3 from
the table (Q8) posted the correlation coefficient of (r=0.593) with the employee motivation and
Table 1: Inter-item Correlation matrix
Q3 Q7 Q8 Q13 Q17 Q27 EmployMot
Q3
Pearson Correlation 1 1.000** -.035 -.019 -.019 -.321** .556**
Sig. (2-tailed) .000 .625 .788 .788 .000 .000
N 200 200 199 199 199 199 197
Q7
Pearson Correlation 1.000** 1 -.035 -.019 -.019 -.321** .556**
Sig. (2-tailed) .000 .625 .788 .788 .000 .000
N 200 200 199 199 199 199 197
Q8
Pearson Correlation -.035 -.035 1 -.006 -.006 .415** .593**
Sig. (2-tailed) .625 .625 .938 .938 .000 .000
N 199 199 199 198 198 198 197
Q13
Pearson Correlation -.019 -.019 -.006 1 1.000** .182* .088
Sig. (2-tailed) .788 .788 .938 .000 .010 .222
N 199 199 198 199 199 198 196
Q17
Pearson Correlation -.019 -.019 -.006 1.000** 1 .182* .088
Sig. (2-tailed) .788 .788 .938 .000 .010 .222
N 199 199 198 199 199 198 196
Q27
Pearson Correlation -.321** -.321** .415** .182* .182* 1 .351**
Sig. (2-tailed) .000 .000 .000 .010 .010 .000
N 199 199 198 198 198 199 197
EmployMot
Pearson Correlation .556** .556** .593** .088 .088 .351** 1
Sig. (2-tailed) .000 .000 .000 .222 .222 .000
N 197 197 197 196 196 197 197
**. Correlation is significant at the 0.01 level (2-tailed).
*. Correlation is significant at the 0.05 level (2-tailed).
From the inter-item matrix table above, item (Q3) had the correlation coefficient of
(r=0.556) with the employees’ motivation which was less than the table value of r=0.7545 which
therefore showed that Q3 was invalid. Item (Q7) had correlation coefficient of (r=0.556) which
was as well less than (r=0.7545) and therefore confirmed that item Q7 was invalid. Item 3 from
the table (Q8) posted the correlation coefficient of (r=0.593) with the employee motivation and
Paraphrase This Document
Need a fresh take? Get an instant paraphrase of this document with our AI Paraphraser
Research design, validity and reliability of research instruments
job satisfaction which was less than (r=0.7545) thus making the item invalid as well. Item (Q13)
had the correlation coefficient of (r=0.088) making it invalid since it was less than the table value
of Pearson’s correlation coefficient (r=0.7545). Item (Q17) had the correlation coefficient of
(r=0.088) with the employees’ motivation and job satisfaction which also made it invalid since
its correlation coefficient was less than (r=0.7545). Lastly, item (Q27) had the Pearson’s
correlation coefficient of (r=0.351) with the employee motivation and job satisfaction which was
as well less than the Pearson’s table value (r=0.7545) thus making the item invalid.
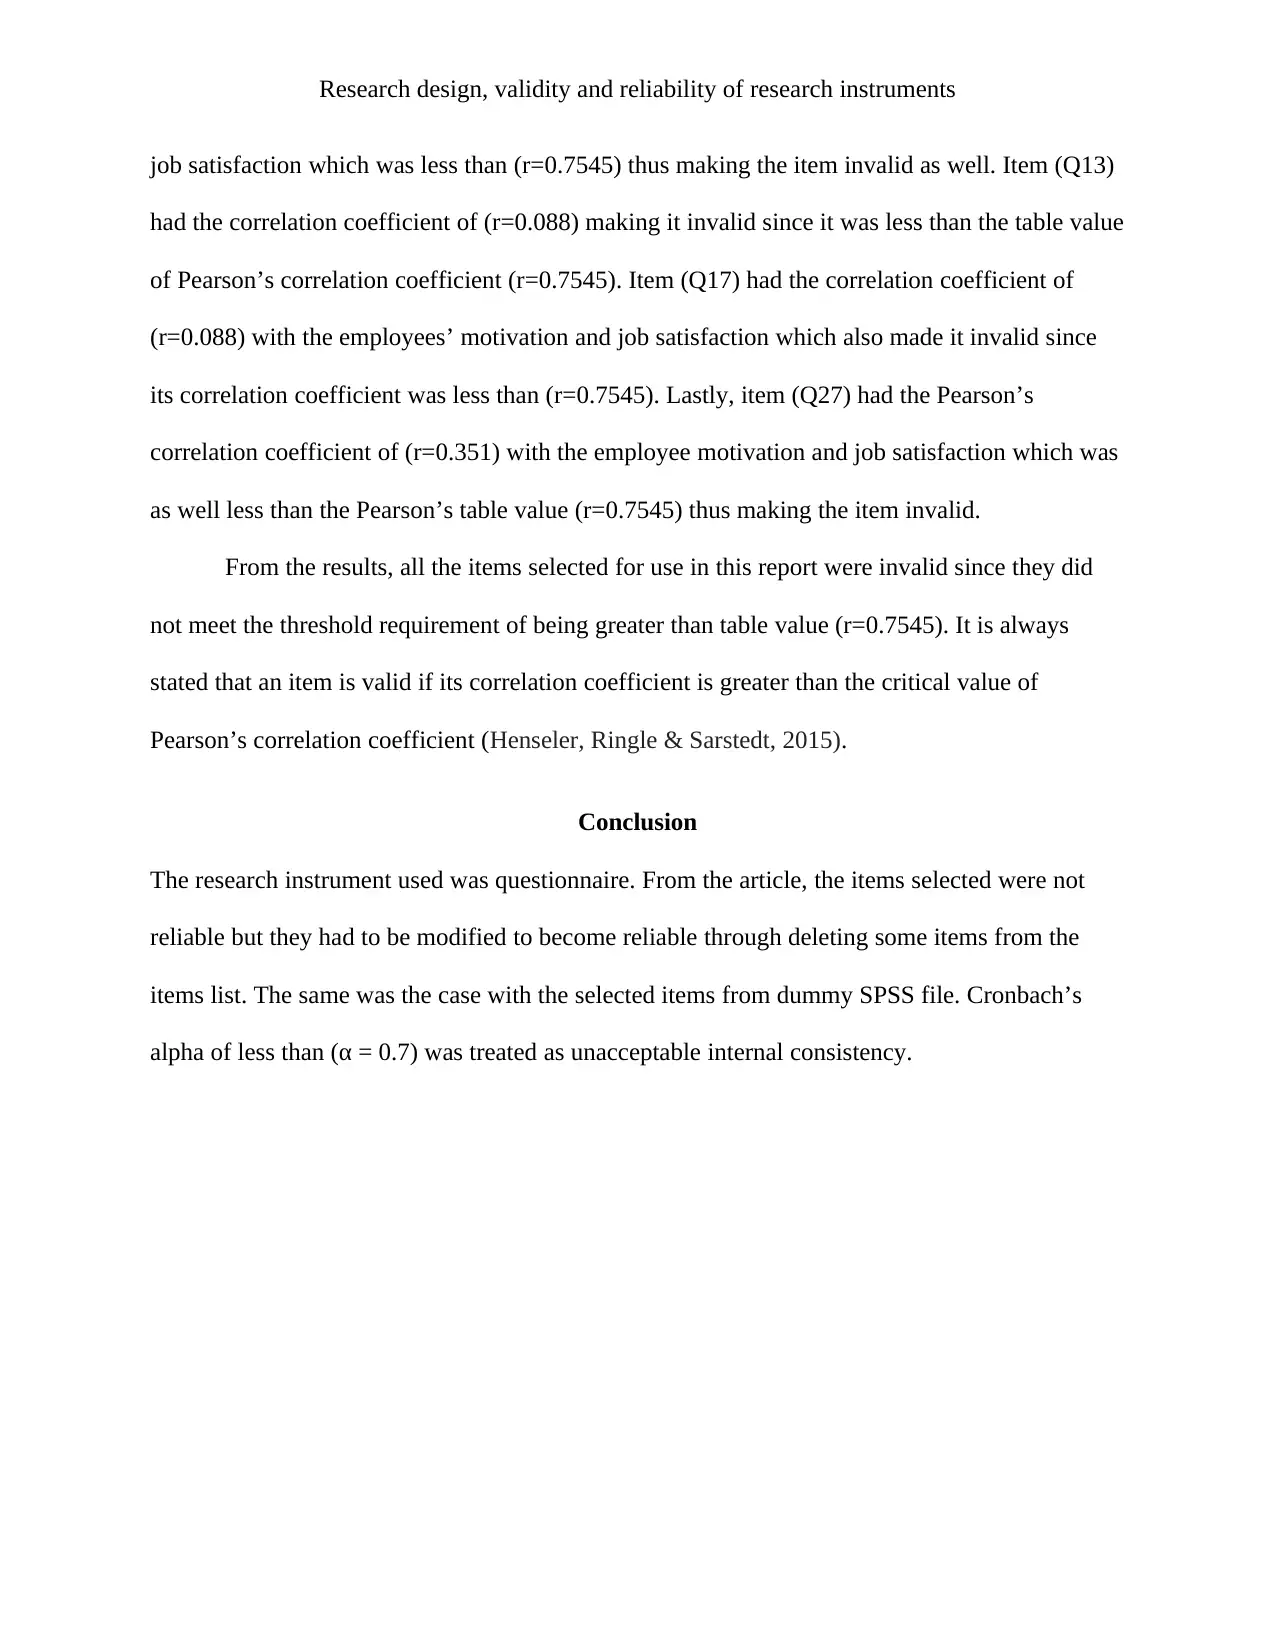
From the results, all the items selected for use in this report were invalid since they did
not meet the threshold requirement of being greater than table value (r=0.7545). It is always
stated that an item is valid if its correlation coefficient is greater than the critical value of
Pearson’s correlation coefficient (Henseler, Ringle & Sarstedt, 2015).
Conclusion
The research instrument used was questionnaire. From the article, the items selected were not
reliable but they had to be modified to become reliable through deleting some items from the
items list. The same was the case with the selected items from dummy SPSS file. Cronbach’s
alpha of less than (α = 0.7) was treated as unacceptable internal consistency.
job satisfaction which was less than (r=0.7545) thus making the item invalid as well. Item (Q13)
had the correlation coefficient of (r=0.088) making it invalid since it was less than the table value
of Pearson’s correlation coefficient (r=0.7545). Item (Q17) had the correlation coefficient of
(r=0.088) with the employees’ motivation and job satisfaction which also made it invalid since
its correlation coefficient was less than (r=0.7545). Lastly, item (Q27) had the Pearson’s
correlation coefficient of (r=0.351) with the employee motivation and job satisfaction which was
as well less than the Pearson’s table value (r=0.7545) thus making the item invalid.
From the results, all the items selected for use in this report were invalid since they did
not meet the threshold requirement of being greater than table value (r=0.7545). It is always
stated that an item is valid if its correlation coefficient is greater than the critical value of
Pearson’s correlation coefficient (Henseler, Ringle & Sarstedt, 2015).
Conclusion
The research instrument used was questionnaire. From the article, the items selected were not
reliable but they had to be modified to become reliable through deleting some items from the
items list. The same was the case with the selected items from dummy SPSS file. Cronbach’s
alpha of less than (α = 0.7) was treated as unacceptable internal consistency.
Research design, validity and reliability of research instruments
References
Al-Abri, R., & Al-Balushi, A. (2014). Patient satisfaction survey as a tool towards quality
improvement. Oman medical journal, 29(1), 3.
Bee, D. T., & Murdoch-Eaton, D. (2016). Questionnaire design: the good, the bad and the
pitfalls. Archives of Disease in Childhood-Education and Practice, 101(4), 210-212.
Cheung, C. M., & Lee, M. K. (2012). What drives consumers to spread electronic word of mouth
in online consumer-opinion platforms. Decision support systems, 53(1), 218-225.
Costantini, G., Epskamp, S., Borsboom, D., Perugini, M., Mõttus, R., Waldorp, L. J., & Cramer,
A. O. (2015). State of the aRt personality research: A tutorial on network analysis of
personality data in R. Journal of Research in Personality, 54, 13-29.
Douglas, K. A., & Purzer, Ş. (2015). Validity: Meaning and relevancy in assessment for
engineering education research. Journal of Engineering Education, 104(2), 108-118.
Henseler, J., Ringle, C. M., & Sarstedt, M. (2015). A new criterion for assessing discriminant
validity in variance-based structural equation modeling. Journal of the academy of
marketing science, 43(1), 115-135.
Peppas, N. A. (2013). Historical perspective on advanced drug delivery: How engineering design
and mathematical modeling helped the field mature. Advanced drug delivery
reviews, 65(1), 5-9.
Ponelis, S. R. (2015). Using interpretive qualitative case studies for exploratory research in
doctoral studies: A case of Information Systems research in small and medium
enterprises. International Journal of Doctoral Studies, 10(1), 535-550.
⊘ This is a preview!⊘
Do you want full access?
Subscribe today to unlock all pages.
Trusted by 1+ million students worldwide
1 out of 16
Related Documents


Your All-in-One AI-Powered Toolkit for Academic Success.
+13062052269
info@desklib.com
Available 24*7 on WhatsApp / Email
![[object Object]](/_next/static/media/star-bottom.7253800d.svg)
Unlock your academic potential
Copyright © 2020–2026 A2Z Services. All Rights Reserved. Developed and managed by ZUCOL.