Associations between Job Insecurity and Well-being: Research Proposal
VerifiedAdded on 2022/10/06
|6
|2493
|110
Report
AI Summary
This report provides an analysis of a research proposal investigating the associations between quantitative and qualitative job insecurity and employee well-being within the Belgian banking sector. The research, based on a survey of 15,000 employees, explores the impact of job insecurity on job satisfaction, psychological distress, and other well-being indicators. The report examines the sampling methodology, highlighting the use of random sampling, and evaluates the sample size determination. It also assesses the reliability and validity of the measures, including Cronbach's alpha values for various measures. Furthermore, the report discusses the use of demographic data and the correlation research design employed in the study. The findings indicate the importance of considering both quantitative and qualitative aspects of job insecurity in understanding employee well-being and provides insights into the strengths and limitations of the research design.

Business Research Method; Research Proposal
Paraphrase This Document
Need a fresh take? Get an instant paraphrase of this document with our AI Paraphraser
Business Research Method; Research Proposal
Question One
The sample size refers to the total number of observations that make up the sample
selected from the population for a study (Biggs & August, 2013). Once the target population has
been selected, the collection of sample observations follows. The determination of the sample
size to be used in a study is a very important aspect of the study; this is because the sample size
has to be representative of the population size of the target population.
The ideal sample size for any study would be a situation of complete enumeration.
Complete enumeration refers to a study property in which the entire target population is
considered and used (O'Neil, 2011). That is, the sample size for the case of complete
enumeration equals the population size of the target population. Complete enumeration, such as
in the case of the census, is advantageous since it is completely representative of the population
size. Hence the findings from a study that has applied complete enumeration can be described as
conclusive and highly accurate. However, conducting complete enumeration is an expensive
exercise and therefore most studies prefer using sample observations instead of using the entire
population (Lenca & Ferretti, 2018).
This then implies that in the selection of the sample size for a study, two general criteria
must be met simultaneously. The sample size must be large enough to be considered as
representative of the population size but still small enough to be within the budget for the study.
Other criteria considered for the determination of the sample size are; desired confidence level,
desired precision level and degree of attribute variability.
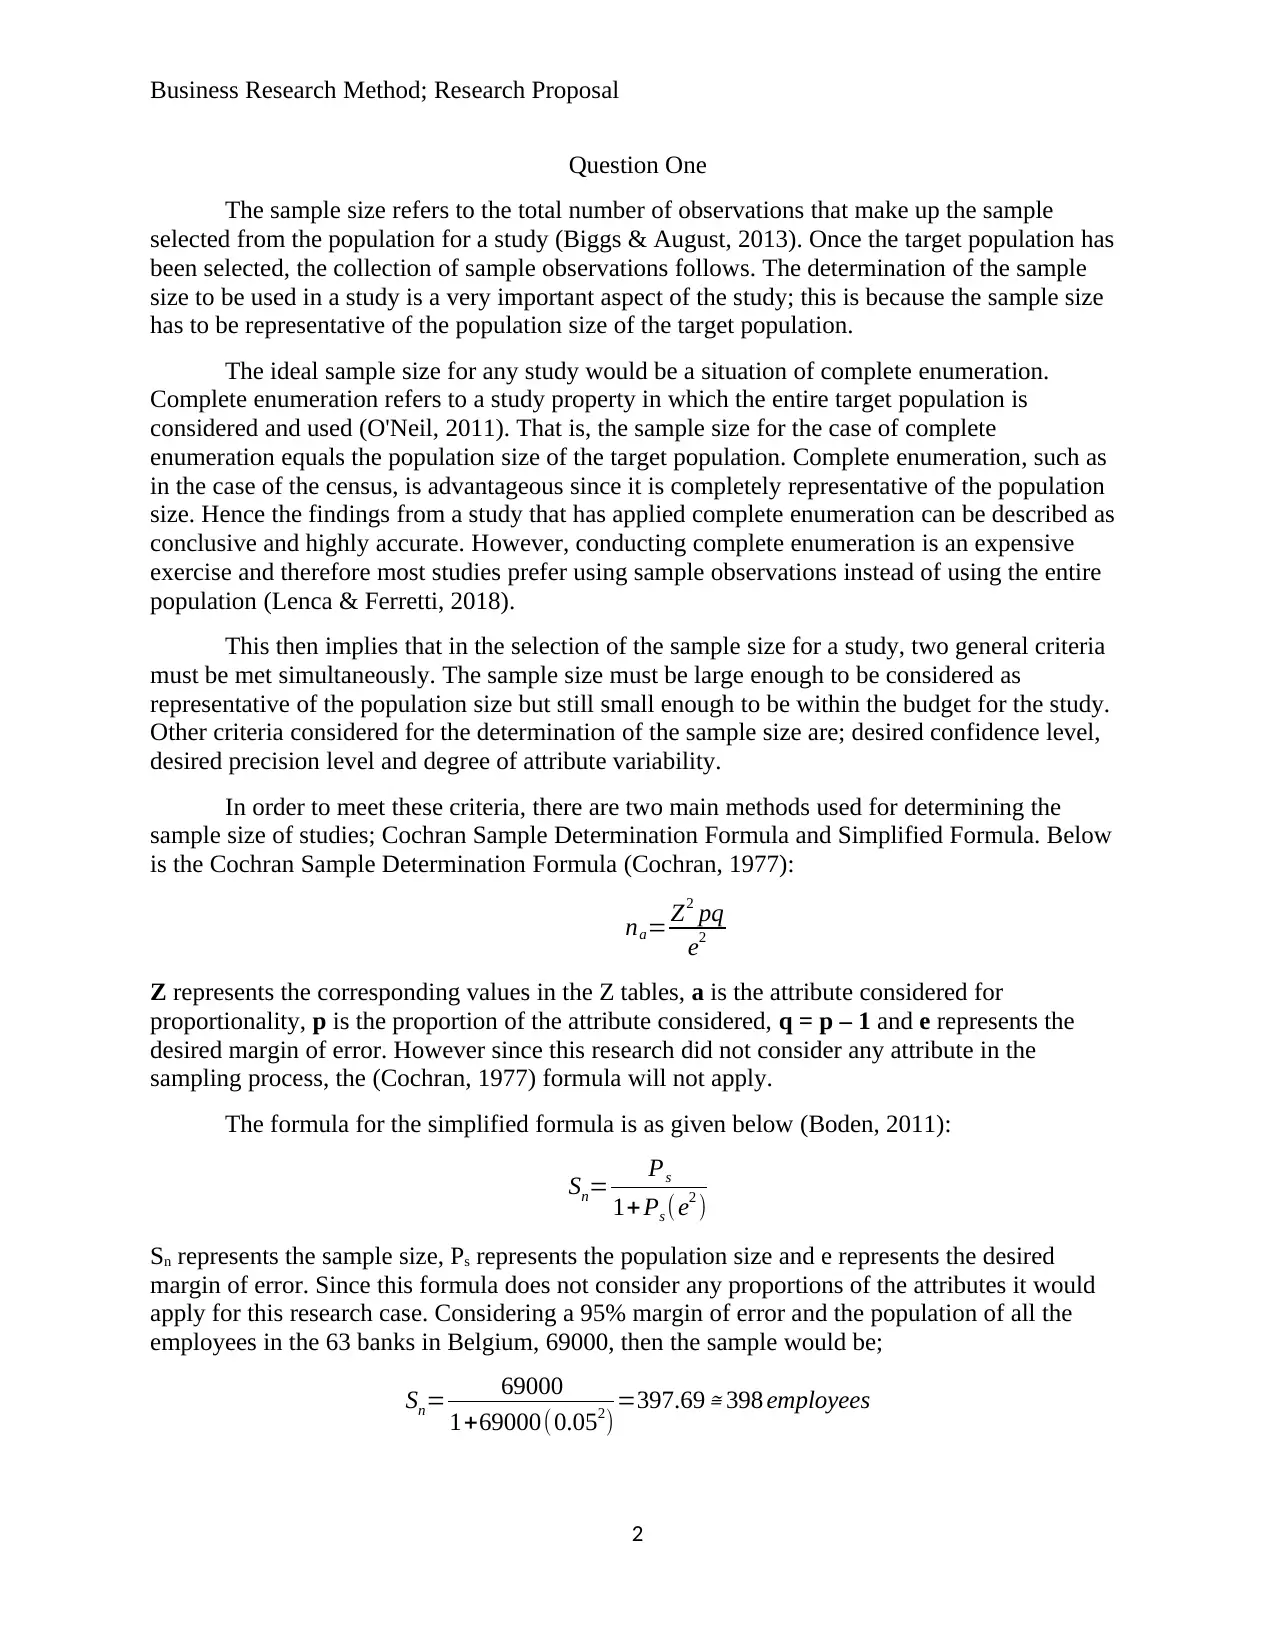
In order to meet these criteria, there are two main methods used for determining the
sample size of studies; Cochran Sample Determination Formula and Simplified Formula. Below
is the Cochran Sample Determination Formula (Cochran, 1977):
na= Z2 pq
e2
Z represents the corresponding values in the Z tables, a is the attribute considered for
proportionality, p is the proportion of the attribute considered, q = p – 1 and e represents the
desired margin of error. However since this research did not consider any attribute in the
sampling process, the (Cochran, 1977) formula will not apply.
The formula for the simplified formula is as given below (Boden, 2011):
Sn= Ps
1+Ps ( e2 )
Sn represents the sample size, Ps represents the population size and e represents the desired
margin of error. Since this formula does not consider any proportions of the attributes it would
apply for this research case. Considering a 95% margin of error and the population of all the
employees in the 63 banks in Belgium, 69000, then the sample would be;
Sn= 69000
1+69000(0.052) =397.69 ≅ 398 employees
2
Question One
The sample size refers to the total number of observations that make up the sample
selected from the population for a study (Biggs & August, 2013). Once the target population has
been selected, the collection of sample observations follows. The determination of the sample
size to be used in a study is a very important aspect of the study; this is because the sample size
has to be representative of the population size of the target population.
The ideal sample size for any study would be a situation of complete enumeration.
Complete enumeration refers to a study property in which the entire target population is
considered and used (O'Neil, 2011). That is, the sample size for the case of complete
enumeration equals the population size of the target population. Complete enumeration, such as
in the case of the census, is advantageous since it is completely representative of the population
size. Hence the findings from a study that has applied complete enumeration can be described as
conclusive and highly accurate. However, conducting complete enumeration is an expensive
exercise and therefore most studies prefer using sample observations instead of using the entire
population (Lenca & Ferretti, 2018).
This then implies that in the selection of the sample size for a study, two general criteria
must be met simultaneously. The sample size must be large enough to be considered as
representative of the population size but still small enough to be within the budget for the study.
Other criteria considered for the determination of the sample size are; desired confidence level,
desired precision level and degree of attribute variability.
In order to meet these criteria, there are two main methods used for determining the
sample size of studies; Cochran Sample Determination Formula and Simplified Formula. Below
is the Cochran Sample Determination Formula (Cochran, 1977):
na= Z2 pq
e2
Z represents the corresponding values in the Z tables, a is the attribute considered for
proportionality, p is the proportion of the attribute considered, q = p – 1 and e represents the
desired margin of error. However since this research did not consider any attribute in the
sampling process, the (Cochran, 1977) formula will not apply.
The formula for the simplified formula is as given below (Boden, 2011):
Sn= Ps
1+Ps ( e2 )
Sn represents the sample size, Ps represents the population size and e represents the desired
margin of error. Since this formula does not consider any proportions of the attributes it would
apply for this research case. Considering a 95% margin of error and the population of all the
employees in the 63 banks in Belgium, 69000, then the sample would be;
Sn= 69000
1+69000(0.052) =397.69 ≅ 398 employees
2
Business Research Method; Research Proposal
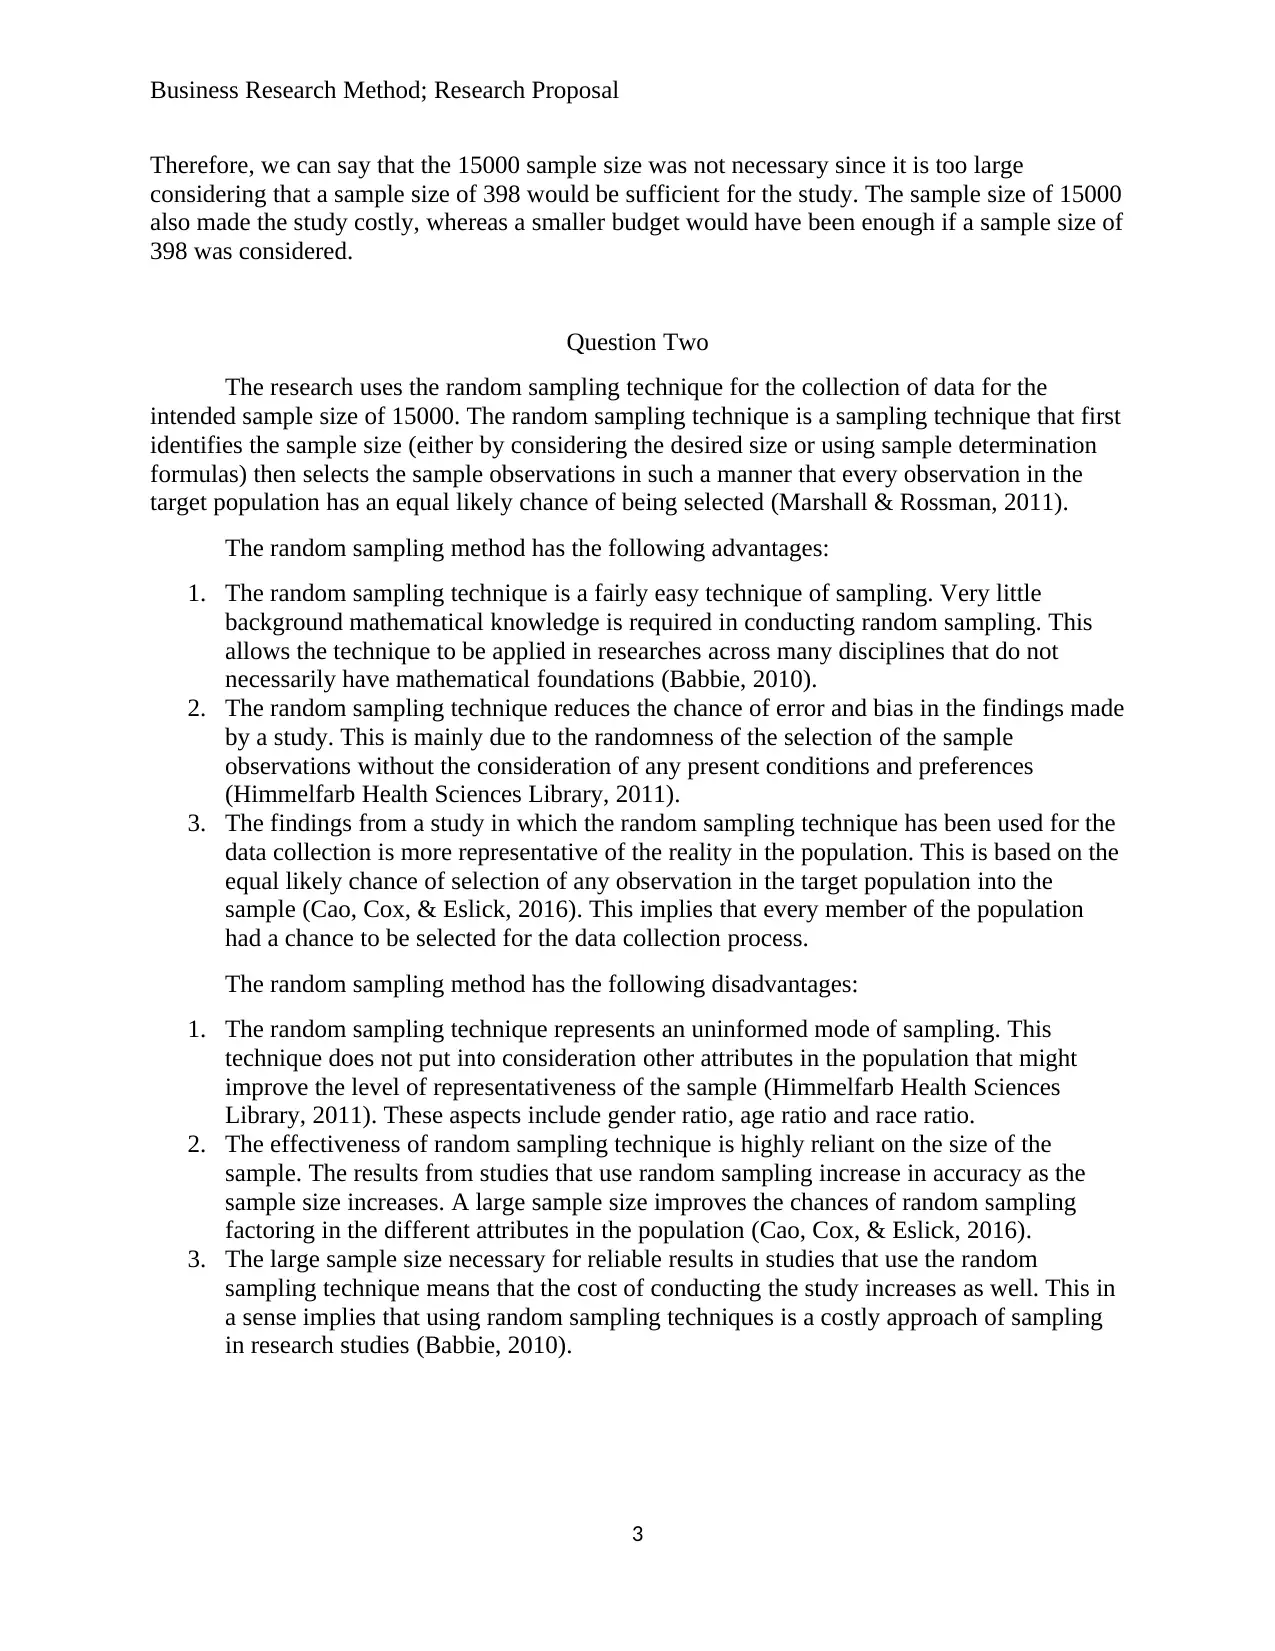
Therefore, we can say that the 15000 sample size was not necessary since it is too large
considering that a sample size of 398 would be sufficient for the study. The sample size of 15000
also made the study costly, whereas a smaller budget would have been enough if a sample size of
398 was considered.
Question Two
The research uses the random sampling technique for the collection of data for the
intended sample size of 15000. The random sampling technique is a sampling technique that first
identifies the sample size (either by considering the desired size or using sample determination
formulas) then selects the sample observations in such a manner that every observation in the
target population has an equal likely chance of being selected (Marshall & Rossman, 2011).
The random sampling method has the following advantages:
1. The random sampling technique is a fairly easy technique of sampling. Very little
background mathematical knowledge is required in conducting random sampling. This
allows the technique to be applied in researches across many disciplines that do not
necessarily have mathematical foundations (Babbie, 2010).
2. The random sampling technique reduces the chance of error and bias in the findings made
by a study. This is mainly due to the randomness of the selection of the sample
observations without the consideration of any present conditions and preferences
(Himmelfarb Health Sciences Library, 2011).
3. The findings from a study in which the random sampling technique has been used for the
data collection is more representative of the reality in the population. This is based on the
equal likely chance of selection of any observation in the target population into the
sample (Cao, Cox, & Eslick, 2016). This implies that every member of the population
had a chance to be selected for the data collection process.
The random sampling method has the following disadvantages:
1. The random sampling technique represents an uninformed mode of sampling. This
technique does not put into consideration other attributes in the population that might
improve the level of representativeness of the sample (Himmelfarb Health Sciences
Library, 2011). These aspects include gender ratio, age ratio and race ratio.
2. The effectiveness of random sampling technique is highly reliant on the size of the
sample. The results from studies that use random sampling increase in accuracy as the
sample size increases. A large sample size improves the chances of random sampling
factoring in the different attributes in the population (Cao, Cox, & Eslick, 2016).
3. The large sample size necessary for reliable results in studies that use the random
sampling technique means that the cost of conducting the study increases as well. This in
a sense implies that using random sampling techniques is a costly approach of sampling
in research studies (Babbie, 2010).
3
⊘ This is a preview!⊘
Do you want full access?
Subscribe today to unlock all pages.
Trusted by 1+ million students worldwide
Business Research Method; Research Proposal
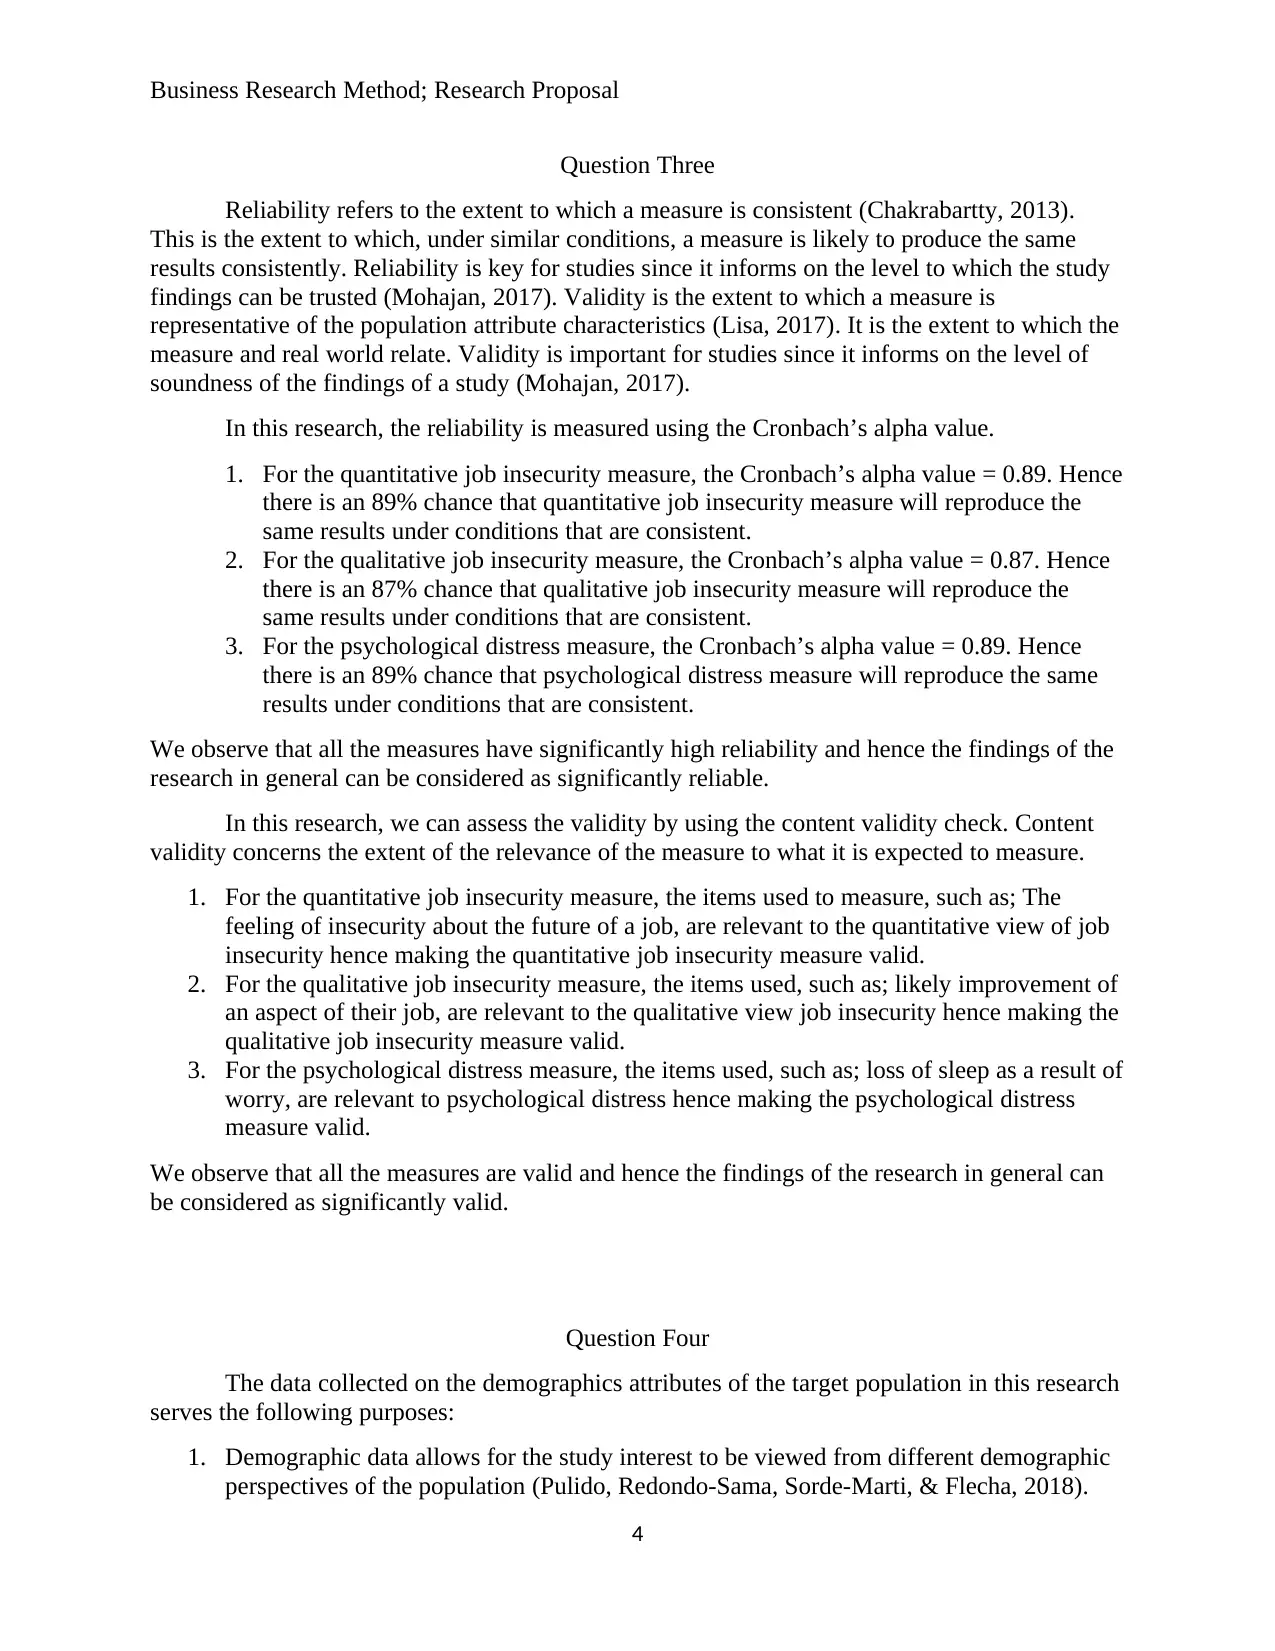
Question Three
Reliability refers to the extent to which a measure is consistent (Chakrabartty, 2013).
This is the extent to which, under similar conditions, a measure is likely to produce the same
results consistently. Reliability is key for studies since it informs on the level to which the study
findings can be trusted (Mohajan, 2017). Validity is the extent to which a measure is
representative of the population attribute characteristics (Lisa, 2017). It is the extent to which the
measure and real world relate. Validity is important for studies since it informs on the level of
soundness of the findings of a study (Mohajan, 2017).
In this research, the reliability is measured using the Cronbach’s alpha value.
1. For the quantitative job insecurity measure, the Cronbach’s alpha value = 0.89. Hence
there is an 89% chance that quantitative job insecurity measure will reproduce the
same results under conditions that are consistent.
2. For the qualitative job insecurity measure, the Cronbach’s alpha value = 0.87. Hence
there is an 87% chance that qualitative job insecurity measure will reproduce the
same results under conditions that are consistent.
3. For the psychological distress measure, the Cronbach’s alpha value = 0.89. Hence
there is an 89% chance that psychological distress measure will reproduce the same
results under conditions that are consistent.
We observe that all the measures have significantly high reliability and hence the findings of the
research in general can be considered as significantly reliable.
In this research, we can assess the validity by using the content validity check. Content
validity concerns the extent of the relevance of the measure to what it is expected to measure.
1. For the quantitative job insecurity measure, the items used to measure, such as; The
feeling of insecurity about the future of a job, are relevant to the quantitative view of job
insecurity hence making the quantitative job insecurity measure valid.
2. For the qualitative job insecurity measure, the items used, such as; likely improvement of
an aspect of their job, are relevant to the qualitative view job insecurity hence making the
qualitative job insecurity measure valid.
3. For the psychological distress measure, the items used, such as; loss of sleep as a result of
worry, are relevant to psychological distress hence making the psychological distress
measure valid.
We observe that all the measures are valid and hence the findings of the research in general can
be considered as significantly valid.
Question Four
The data collected on the demographics attributes of the target population in this research
serves the following purposes:
1. Demographic data allows for the study interest to be viewed from different demographic
perspectives of the population (Pulido, Redondo-Sama, Sorde-Marti, & Flecha, 2018).
4
Paraphrase This Document
Need a fresh take? Get an instant paraphrase of this document with our AI Paraphraser
Business Research Method; Research Proposal
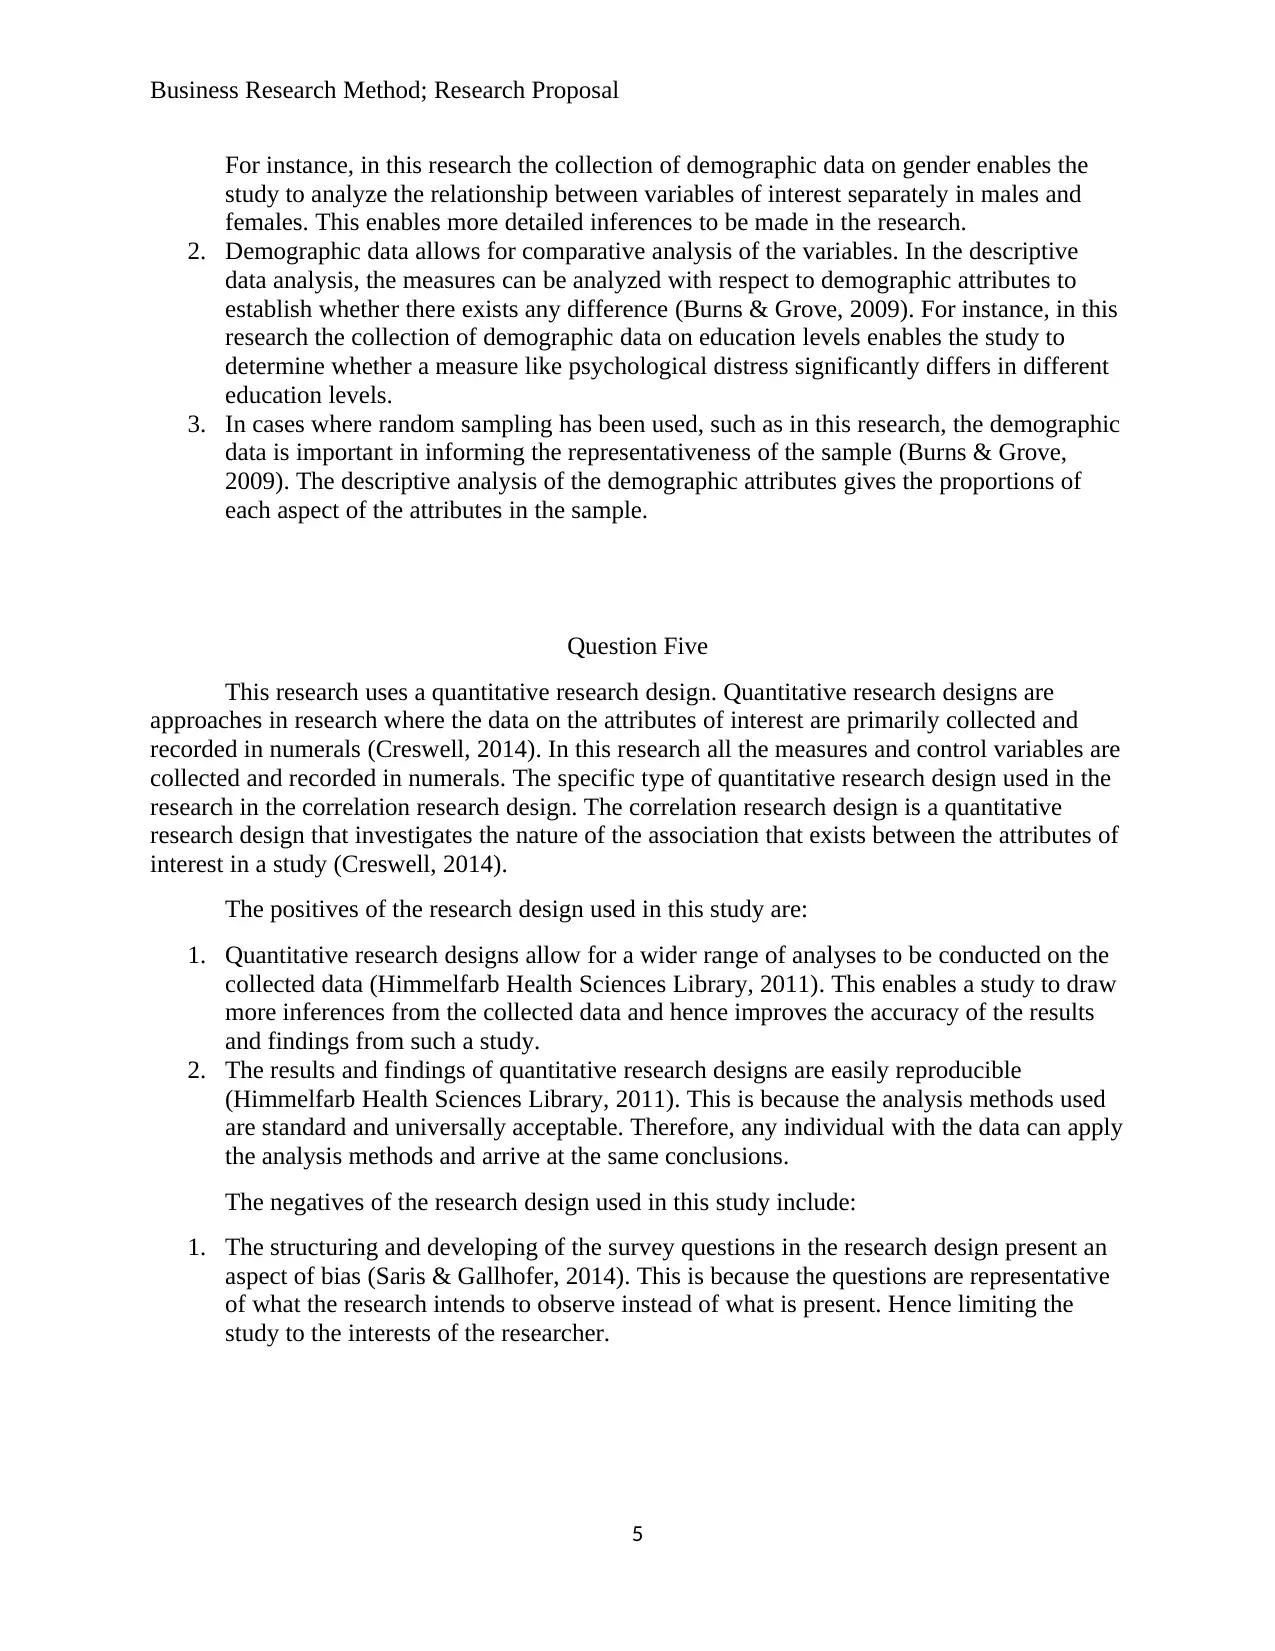
For instance, in this research the collection of demographic data on gender enables the
study to analyze the relationship between variables of interest separately in males and
females. This enables more detailed inferences to be made in the research.
2. Demographic data allows for comparative analysis of the variables. In the descriptive
data analysis, the measures can be analyzed with respect to demographic attributes to
establish whether there exists any difference (Burns & Grove, 2009). For instance, in this
research the collection of demographic data on education levels enables the study to
determine whether a measure like psychological distress significantly differs in different
education levels.
3. In cases where random sampling has been used, such as in this research, the demographic
data is important in informing the representativeness of the sample (Burns & Grove,
2009). The descriptive analysis of the demographic attributes gives the proportions of
each aspect of the attributes in the sample.
Question Five
This research uses a quantitative research design. Quantitative research designs are
approaches in research where the data on the attributes of interest are primarily collected and
recorded in numerals (Creswell, 2014). In this research all the measures and control variables are
collected and recorded in numerals. The specific type of quantitative research design used in the
research in the correlation research design. The correlation research design is a quantitative
research design that investigates the nature of the association that exists between the attributes of
interest in a study (Creswell, 2014).
The positives of the research design used in this study are:
1. Quantitative research designs allow for a wider range of analyses to be conducted on the
collected data (Himmelfarb Health Sciences Library, 2011). This enables a study to draw
more inferences from the collected data and hence improves the accuracy of the results
and findings from such a study.
2. The results and findings of quantitative research designs are easily reproducible
(Himmelfarb Health Sciences Library, 2011). This is because the analysis methods used
are standard and universally acceptable. Therefore, any individual with the data can apply
the analysis methods and arrive at the same conclusions.
The negatives of the research design used in this study include:
1. The structuring and developing of the survey questions in the research design present an
aspect of bias (Saris & Gallhofer, 2014). This is because the questions are representative
of what the research intends to observe instead of what is present. Hence limiting the
study to the interests of the researcher.
5
Business Research Method; Research Proposal
References
Babbie, E. R. (2010). The Practice of Social Research 12th edition (1st ed.). Belmont, CA:
Wadsworth Cengage.
Biggs, J. S., & August, M. (2013). Rebuilding a Research Ethics Committee . Journal of
Research Administration, 44(1), 1-3.
Boden, G. T. (2011). Retention and Graduation Rates: Insights from an Extended Longitudinal
View. Journal of College Student Retention: Research. Theory and Practice, 3(4), 15-19.
Burns, N., & Grove, S. K. (2009). The Practice of Nursing Research: Appraisal, Synthesis and
Generation of Evidence. 6th Edition. St Louis, MO: Saunders Elsevier.
Cao, A. M., Cox, M. R., & Eslick, G. D. (2016). Study Design in Evidence-Based Surgery. What
is The Role of Case-Control Studies? World Journal of Methodology. 6(1)., 101-104.
Chakrabartty, S. N. (2013). Best Split-Half and Maximum Reliability. IOSR Journal of Research
and Method in Education, 3(1), 1-8.
Cochran, W. G. (1977). Sampling Techniques (3rd ed.). New York: John Wiley & Sons.
Creswell, J. W. (2014). Research Design: Qualitative, Quantitative and Mixed Approaches (4th
ed.). Michigan: SAGE Publications, Inc.
Himmelfarb Health Sciences Library. (2011, November 1). Study Design 101. Retrieved from
Himmelfarb: https://himmelfarb.gwu.edu/tutorials/studydesign101/cohorts.html
Lenca, M., & Ferretti, A. (2018). Considerations for Ethics Review of Big Data Health Research:
A Scoping Review. PLoS ONE, 13(10), 23-25.
Lisa, M. P. (2017). A Framework for Determining Research Credibility. Crimson Publishers,
1(1), 1-4.
Marshall, C., & Rossman, G. B. (2011). Designing Qualitative Research (5th ed.). Los Angeles:
SAGE Publications.
Mohajan, H. (2017). Two Criteria for Good Measurements In Research: Validity and Reliability.
Annals of Spiru Haret University, 17(3), 58-82.
O'Neil, P. (2011). The Evolution of Research Ethics in Canada; Current Developments.
Canadian Psycology, 52(3), 2-9.
Pulido, C. M., Redondo-Sama, G., Sorde-Marti, T., & Flecha, R. (2018). Social Impact in Social
Media: A New Method to Evaluate the Social Impact of Research. PLoS One, 1-7. 13(8).
Saris, W. E., & Gallhofer, I. N. (2014). Design, Evaluation and Analysis of Questionnnaires for
Survey Research. Hoboken: Wiley.
6
⊘ This is a preview!⊘
Do you want full access?
Subscribe today to unlock all pages.
Trusted by 1+ million students worldwide
1 out of 6
Related Documents


Your All-in-One AI-Powered Toolkit for Academic Success.
+13062052269
info@desklib.com
Available 24*7 on WhatsApp / Email
![[object Object]](/_next/static/media/star-bottom.7253800d.svg)
Unlock your academic potential
Copyright © 2020–2026 A2Z Services. All Rights Reserved. Developed and managed by ZUCOL.