Research Methods Report: Measurement, Statistics, and Interpretation

Verified

Added on  2023/01/11

|8
|1312
|72
Report
AI Summary
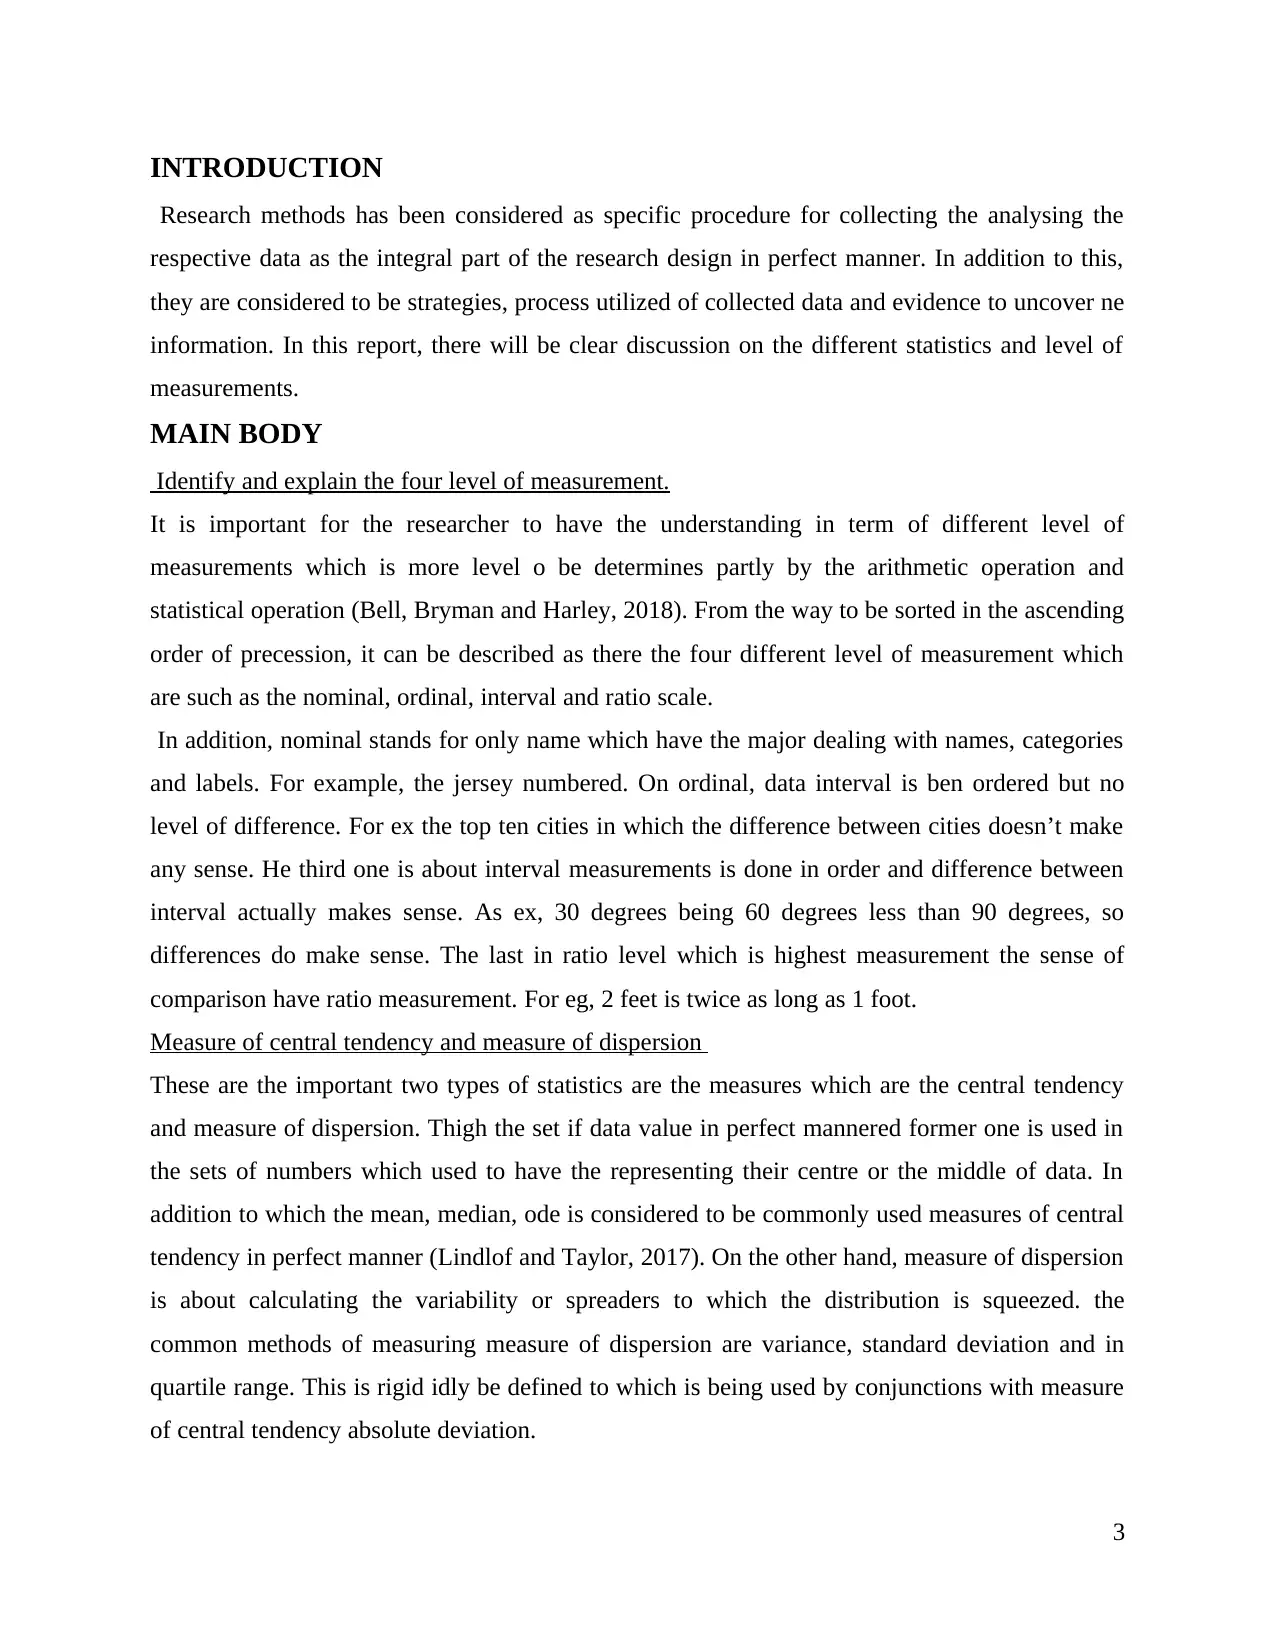
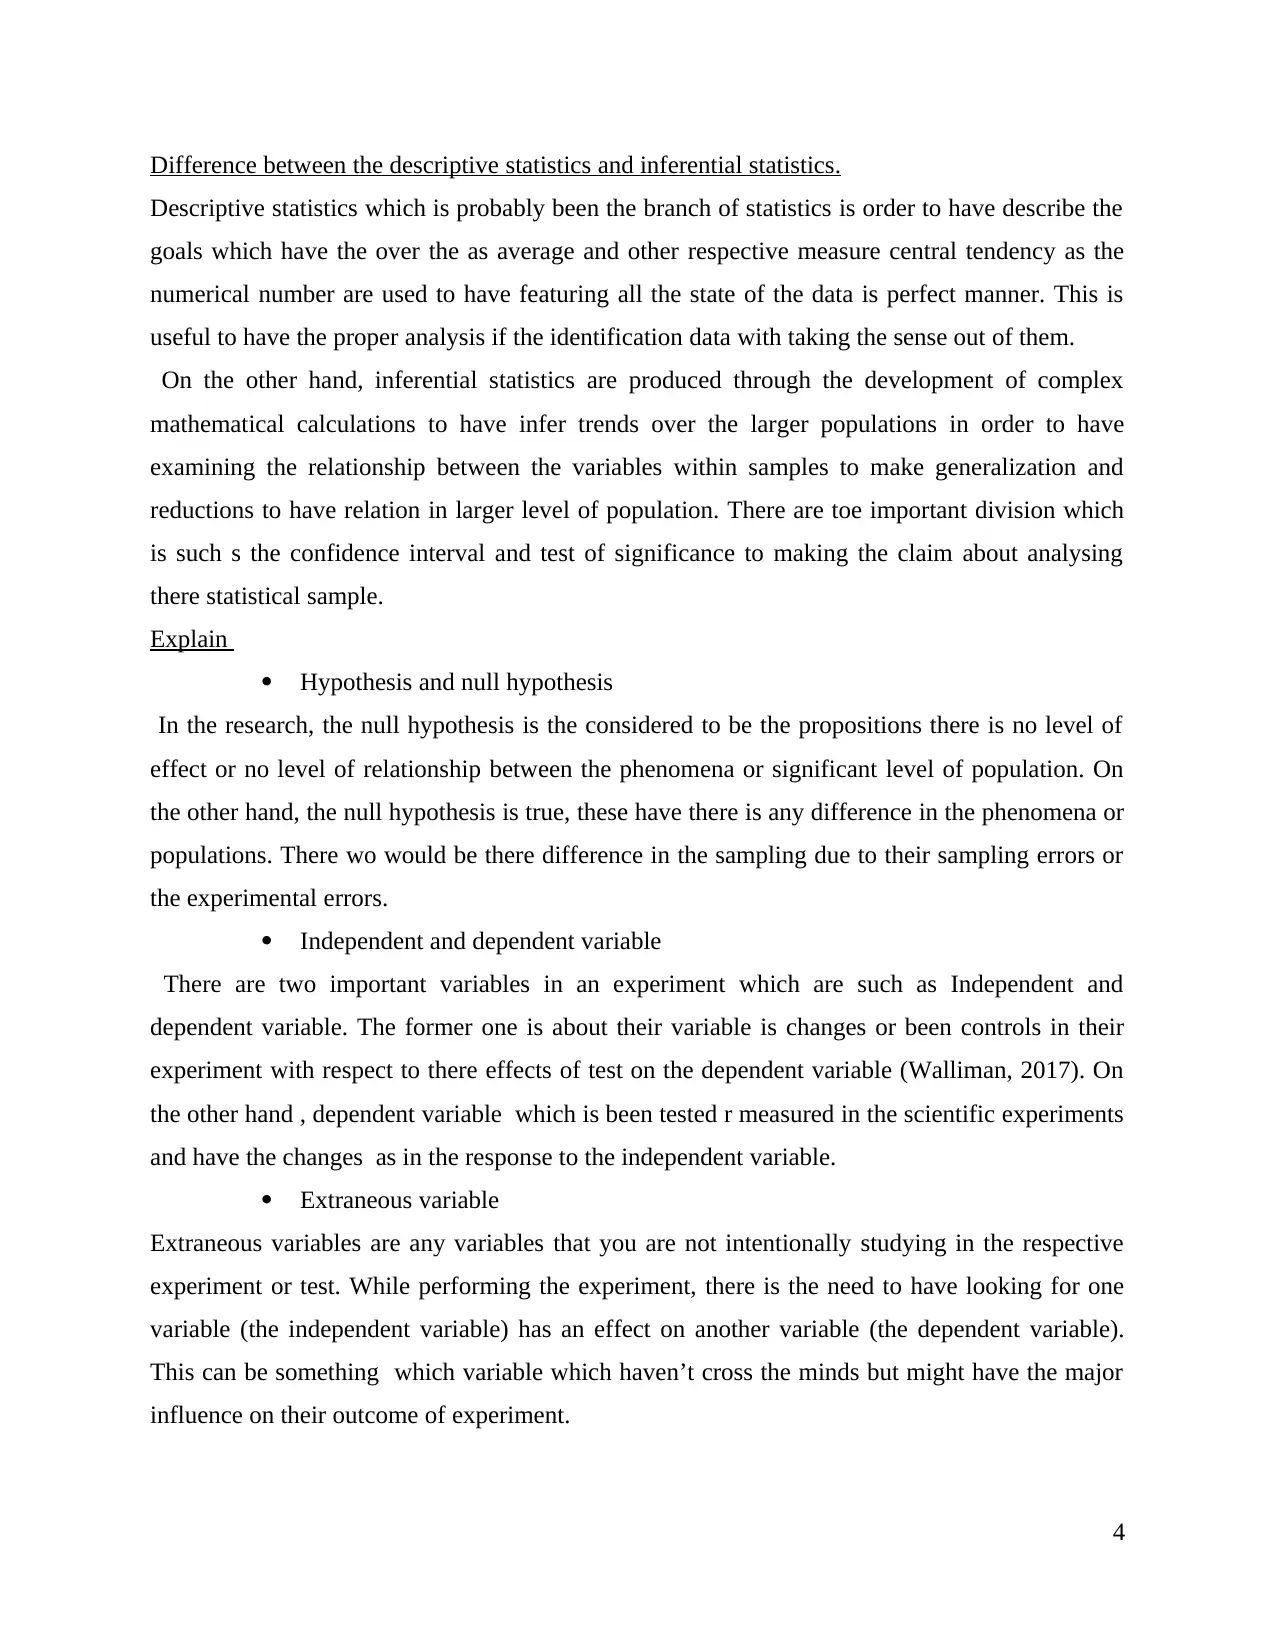
This report provides a comprehensive overview of research methods, starting with an introduction to the subject and its significance. The main body of the report delves into the four levels of measurement (nominal, ordinal, interval, and ratio), explaining their characteristics and providing examples. It then differentiates between measures of central tendency and dispersion, highlighting their roles in data analysis. Furthermore, the report contrasts descriptive and inferential statistics, explaining their distinct purposes and applications. Key concepts such as hypothesis and null hypothesis, independent and dependent variables, and extraneous variables are defined and explained. The report also includes interpretations of frequency tables, cross-tabulations, chi-square results, and symmetric measures like Phi and Cramer's V, demonstrating how to analyze and draw conclusions from data. The report concludes with a summary of the key findings and a list of relevant references, providing a solid foundation in research methodology.
Document Page
Research methods
tabler-icon-diamond-filled.svg

Paraphrase This Document

Need a fresh take? Get an instant paraphrase of this document with our AI Paraphraser
Document Page
Contents
INTRODUCTION...........................................................................................................................3
MAIN BODY..................................................................................................................................3
Identify and explain the four level of measurement....................................................................3
Measure of central tendency and measure of dispersion.............................................................3
Difference between the descriptive statistics and inferential statistics........................................4
Explain.........................................................................................................................................4
Interpretation................................................................................................................................5
CONCLUSION................................................................................................................................5
REFERENCES................................................................................................................................6
Document Page
INTRODUCTION
Research methods has been considered as specific procedure for collecting the analysing the
respective data as the integral part of the research design in perfect manner. In addition to this,
they are considered to be strategies, process utilized of collected data and evidence to uncover ne
information. In this report, there will be clear discussion on the different statistics and level of
measurements.
MAIN BODY
Identify and explain the four level of measurement.
It is important for the researcher to have the understanding in term of different level of
measurements which is more level o be determines partly by the arithmetic operation and
statistical operation (Bell, Bryman and Harley, 2018). From the way to be sorted in the ascending
order of precession, it can be described as there the four different level of measurement which
are such as the nominal, ordinal, interval and ratio scale.
In addition, nominal stands for only name which have the major dealing with names, categories
and labels. For example, the jersey numbered. On ordinal, data interval is ben ordered but no
level of difference. For ex the top ten cities in which the difference between cities doesn’t make
any sense. He third one is about interval measurements is done in order and difference between
interval actually makes sense. As ex, 30 degrees being 60 degrees less than 90 degrees, so
differences do make sense. The last in ratio level which is highest measurement the sense of
comparison have ratio measurement. For eg, 2 feet is twice as long as 1 foot.
Measure of central tendency and measure of dispersion
These are the important two types of statistics are the measures which are the central tendency
and measure of dispersion. Thigh the set if data value in perfect mannered former one is used in
the sets of numbers which used to have the representing their centre or the middle of data. In
addition to which the mean, median, ode is considered to be commonly used measures of central
tendency in perfect manner (Lindlof and Taylor, 2017). On the other hand, measure of dispersion
is about calculating the variability or spreaders to which the distribution is squeezed. the
common methods of measuring measure of dispersion are variance, standard deviation and in
quartile range. This is rigid idly be defined to which is being used by conjunctions with measure
of central tendency absolute deviation.
3
Document Page
Difference between the descriptive statistics and inferential statistics.
Descriptive statistics which is probably been the branch of statistics is order to have describe the
goals which have the over the as average and other respective measure central tendency as the
numerical number are used to have featuring all the state of the data is perfect manner. This is
useful to have the proper analysis if the identification data with taking the sense out of them.
On the other hand, inferential statistics are produced through the development of complex
mathematical calculations to have infer trends over the larger populations in order to have
examining the relationship between the variables within samples to make generalization and
reductions to have relation in larger level of population. There are toe important division which
is such s the confidence interval and test of significance to making the claim about analysing
there statistical sample.
Explain
Hypothesis and null hypothesis
In the research, the null hypothesis is the considered to be the propositions there is no level of
effect or no level of relationship between the phenomena or significant level of population. On
the other hand, the null hypothesis is true, these have there is any difference in the phenomena or
populations. There wo would be there difference in the sampling due to their sampling errors or
the experimental errors.
Independent and dependent variable
There are two important variables in an experiment which are such as Independent and
dependent variable. The former one is about their variable is changes or been controls in their
experiment with respect to there effects of test on the dependent variable (Walliman, 2017). On
the other hand , dependent variable which is been tested r measured in the scientific experiments
and have the changes as in the response to the independent variable.
Extraneous variable
Extraneous variables are any variables that you are not intentionally studying in the respective
experiment or test. While performing the experiment, there is the need to have looking for one
variable (the independent variable) has an effect on another variable (the dependent variable).
This can be something which variable which haven’t cross the minds but might have the major
influence on their outcome of experiment.
4
tabler-icon-diamond-filled.svg

Paraphrase This Document

Need a fresh take? Get an instant paraphrase of this document with our AI Paraphraser
Document Page
Interpretation
Frequency tables
As per the frequency, it can be interpreted that’s their noisy neighbourhoods and considered to
be not at all common because as per the data 52% and favouring this point. In the follow up thee
not very common of less common have the 35% of the participants who thinks about this concept
in such as way.
Cross tabulation
As per the cross tabulation, it can be interpreted as there as the young adult are more contributing
ain all categories such as the 40.7% and 41.2% which are not very common. this interpretation is
being followed by their adults grouped in more respective manner.
Chi- square result
In these results, the Pearson chi-square statistic is 91.182 and the p-value = 0.000. The likelihood
chi-square statistic is 93.437 and the p-value = 0.000. Therefore, at a significance level of 0.05,
you can conclude that there is no level of association between the variables is statistically
significant.
Symmetric measure
Phi
In 2-b-2 tables, phi can be interpreted as the more level of symmetric percent difference,
measuring the percent of concentration of cases on the diagonal, phi is identical to the
correlation coefficient.
Cramer’s
Have the defining of the effect level of relationship as one is predictive and ordered
monotonies by defining the null level of relationships as the statistical level of
impendence.
CONCLUSION
From the above file it can be concluded as Research methods has been process utilized of
collected data by having the four different level of measurement which are such as the nominal,
ordinal, interval and ratio scale (Veal, 2017). There are toe important division which is such s the
confidence interval and test of significance dependent variable which is been tested r measured
in the scientific experiments and have the changes as in the response to the independent variable.
5
Document Page
REFERENCES
Books and Journals
Online
Bell, E., Bryman, A. and Harley, B., 2018. Business research methods. Oxford university press.
Lindlof, T.R. and Taylor, B.C., 2017. Qualitative communication research methods. Sage
publications.
Walliman, N., 2017. Research methods: The basics. Routledge.
Veal, A.J., 2017. Research methods for leisure and tourism. Pearson UK.
6
Document Page
7
tabler-icon-diamond-filled.svg

Paraphrase This Document

Need a fresh take? Get an instant paraphrase of this document with our AI Paraphraser
Document Page
8
chevron_up_icon
1 out of 8
circle_padding
hide_on_mobile
zoom_out_icon
[object Object]