Psychology: Research Methods and Academic Skills Assignment Analysis
VerifiedAdded on 2020/10/22
|16
|1636
|117
Homework Assignment
AI Summary
This document presents a comprehensive analysis of a psychology research assignment, focusing on research methods and academic skills. The assignment explores the impact of alcohol consumption on the perception of fearful emotional faces, employing statistical tools such as descriptive statistics, regression analysis, and ANOVA. The analysis includes hypothesis testing, calculation of means and standard deviations, and interpretation of statistical results. The document investigates the significance of overall effects, changes in perception after alcohol intake, and the influence of thirst conditions. It also addresses the assumption of homogeneity of variance and provides relevant references. The assignment provides insights into the application of various statistical methods in psychological research, including the interpretation of R-squared, p-values, and F-statistics, offering a detailed breakdown of the results and their implications.

RESEARCH METHODS AND
ACADEMIC SKILLS-
PSYCHOLOGY
ACADEMIC SKILLS-
PSYCHOLOGY
Paraphrase This Document
Need a fresh take? Get an instant paraphrase of this document with our AI Paraphraser
TABLE OF CONTENTS
QUESTION 1..................................................................................................................................1
A. Null hypothesis.......................................................................................................................1
B. Suitable statistical test.............................................................................................................1
C. Mean and standard deviation for rating before alcohol..........................................................1
D. Mean and standard deviation of rating after 2 units alcohol...................................................1
E. Statistical results......................................................................................................................1
F. Interpretation...........................................................................................................................3
G..................................................................................................................................................3
H. Suitable statistical test for data...............................................................................................3
I. Significance of overall effects on the drinking alcohol perceptions........................................4
J. Significant changes in the perception after drinking 2 units....................................................4
K. Significant changes in the perception after drinking 2 more units.........................................4
L. Evidences................................................................................................................................4
M. Interpretation..........................................................................................................................5
N. Accurate deception of plot......................................................................................................5
QUESTION 2..................................................................................................................................5
A..................................................................................................................................................5
B...................................................................................................................................................5
C...................................................................................................................................................5
D..................................................................................................................................................5
E...................................................................................................................................................6
F...................................................................................................................................................6
G..................................................................................................................................................6
H..................................................................................................................................................6
I....................................................................................................................................................6
J....................................................................................................................................................6
K..................................................................................................................................................6
L...................................................................................................................................................6
M..................................................................................................................................................6
N..................................................................................................................................................6
O..................................................................................................................................................6
P...................................................................................................................................................6
Q..................................................................................................................................................6
R...................................................................................................................................................6
S...................................................................................................................................................6
QUESTION 3..................................................................................................................................7
A. Running an ANOVA analysis.................................................................................................7
B. Repeated measure factor.........................................................................................................7
C. determining the larger significant factor...............................................................................11
D. Estimated marginal means of large size factor.....................................................................11
E. Estimated marginal means of small size factor.....................................................................11
F. Significant interaction...........................................................................................................11
G. Interpretation.........................................................................................................................11
H. Assumption of homogeneity of variance violated................................................................12
REFERENCES..............................................................................................................................13
⊘ This is a preview!⊘
Do you want full access?
Subscribe today to unlock all pages.
Trusted by 1+ million students worldwide
QUESTION 1
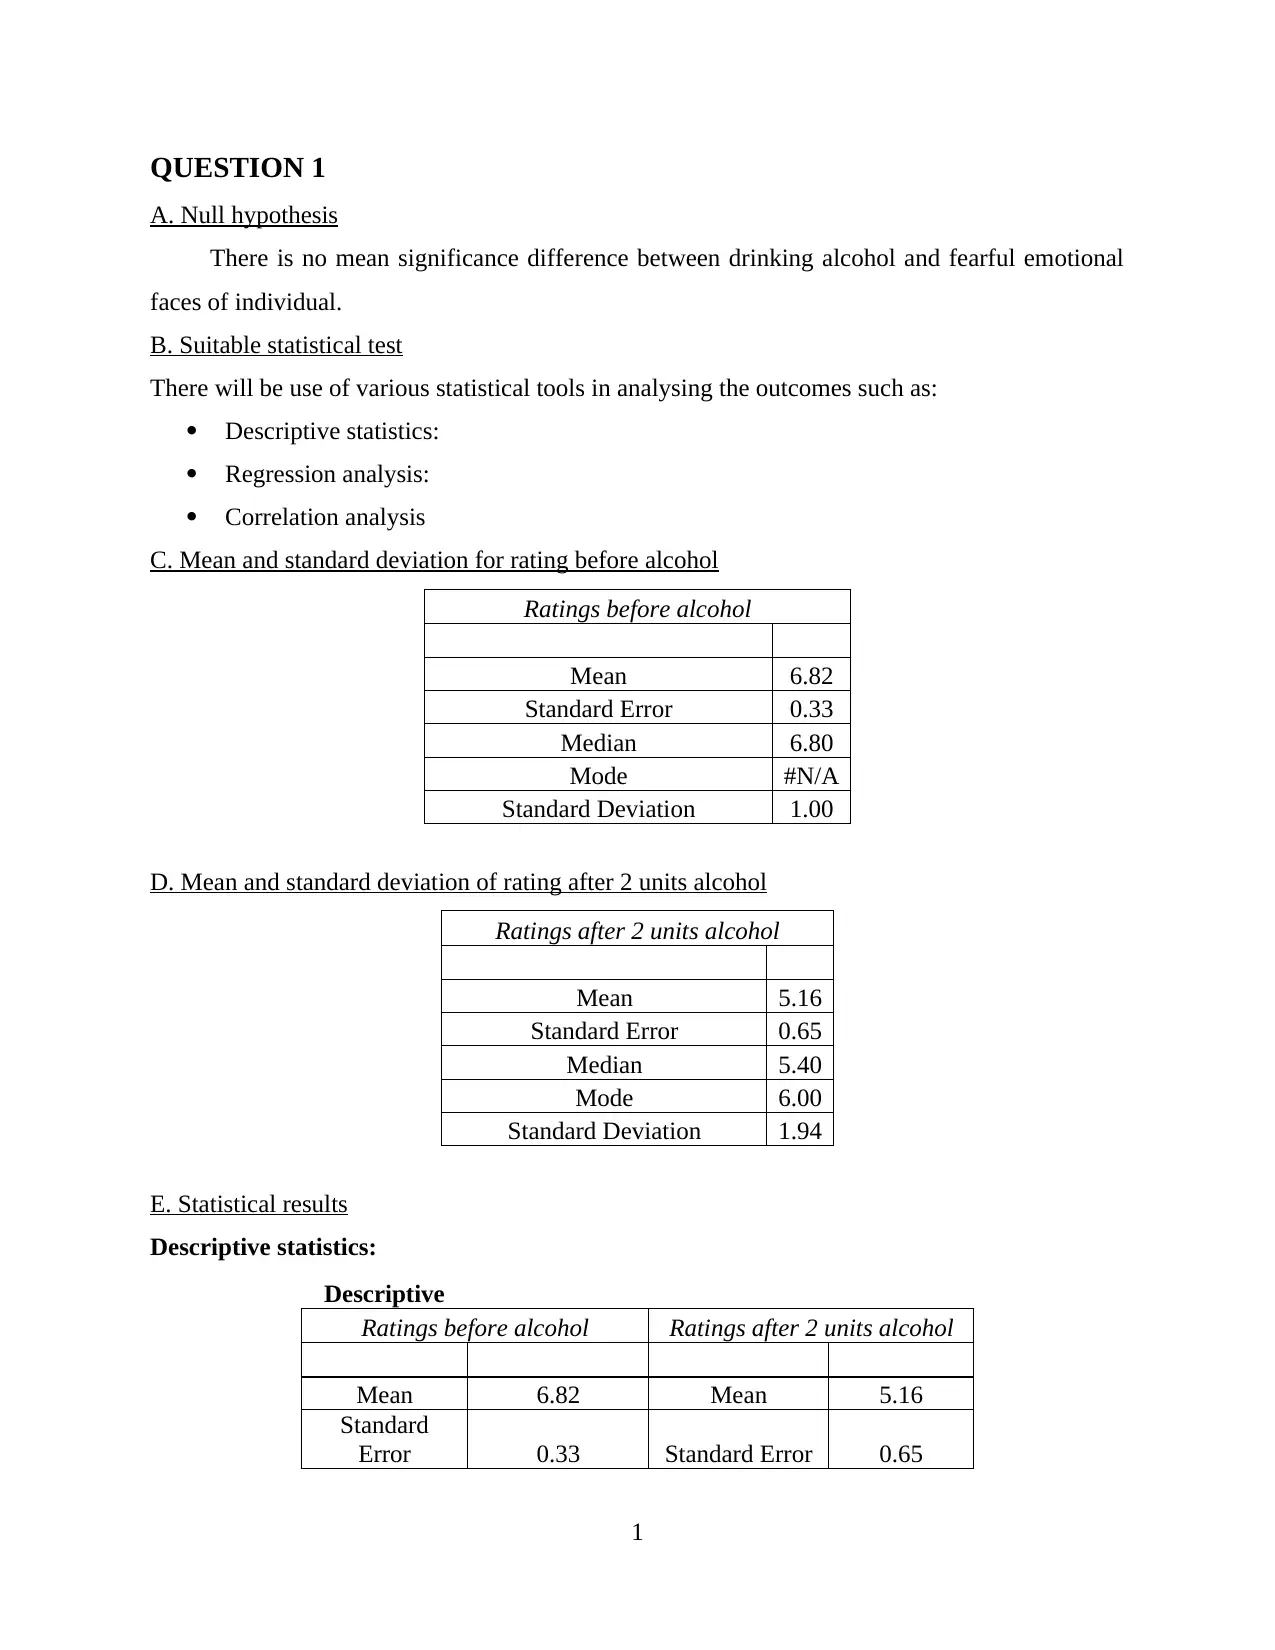
A. Null hypothesis
There is no mean significance difference between drinking alcohol and fearful emotional
faces of individual.
B. Suitable statistical test
There will be use of various statistical tools in analysing the outcomes such as:
Descriptive statistics:
Regression analysis:
Correlation analysis
C. Mean and standard deviation for rating before alcohol
Ratings before alcohol
Mean 6.82
Standard Error 0.33
Median 6.80
Mode #N/A
Standard Deviation 1.00
D. Mean and standard deviation of rating after 2 units alcohol
Ratings after 2 units alcohol
Mean 5.16
Standard Error 0.65
Median 5.40
Mode 6.00
Standard Deviation 1.94
E. Statistical results
Descriptive statistics:
Descriptive
Ratings before alcohol Ratings after 2 units alcohol
Mean 6.82 Mean 5.16
Standard
Error 0.33 Standard Error 0.65
1
Paraphrase This Document
Need a fresh take? Get an instant paraphrase of this document with our AI Paraphraser
Median 6.80 Median 5.40
Mode #N/A Mode 6.00
Standard
Deviation 1.00
Standard
Deviation 1.94
Sample
Variance 1.00
Sample
Variance 3.78
Kurtosis -0.69 Kurtosis -0.59
Skewness -0.08 Skewness -0.43
Range 3.10 Range 5.80
Minimum 5.20 Minimum 1.90
Maximum 8.30 Maximum 7.70
Sum 61.40 Sum 46.40
Count 9.00 Count 9.00
Largest(1) 8.30 Largest(1) 7.70
Smallest(1) 5.20 Smallest(1) 1.90
Confidence
Level(95.0%) 0.77
Confidence
Level(95.0%) 1.50
Regression analysis:
SUMMARY
OUTPUT
Regression
Statistics
Multiple R 0.928
R Square 0.862
Adjusted R
Square 0.737
Standard
Error 2.718
Observations 9
ANOVA
df SS MS F
Significance
F
Regression 1 367.742 367.742 49.764 0.0002
Residual 8 59.118 7.390
Total 9 426.860
Coefficient
s
Standard
Error
t Stat P-
value
Lower
95%
Upper
95%
Lower
95.0%
Upper
95.0
2
%
Intercept 0 #N/A #N/A #N/A #N/A #N/A #N/A #N/A
Ratings
after 2
units
alcohol 1.168 0.166 7.054 0.000 0.786 1.550 0.786 1.550
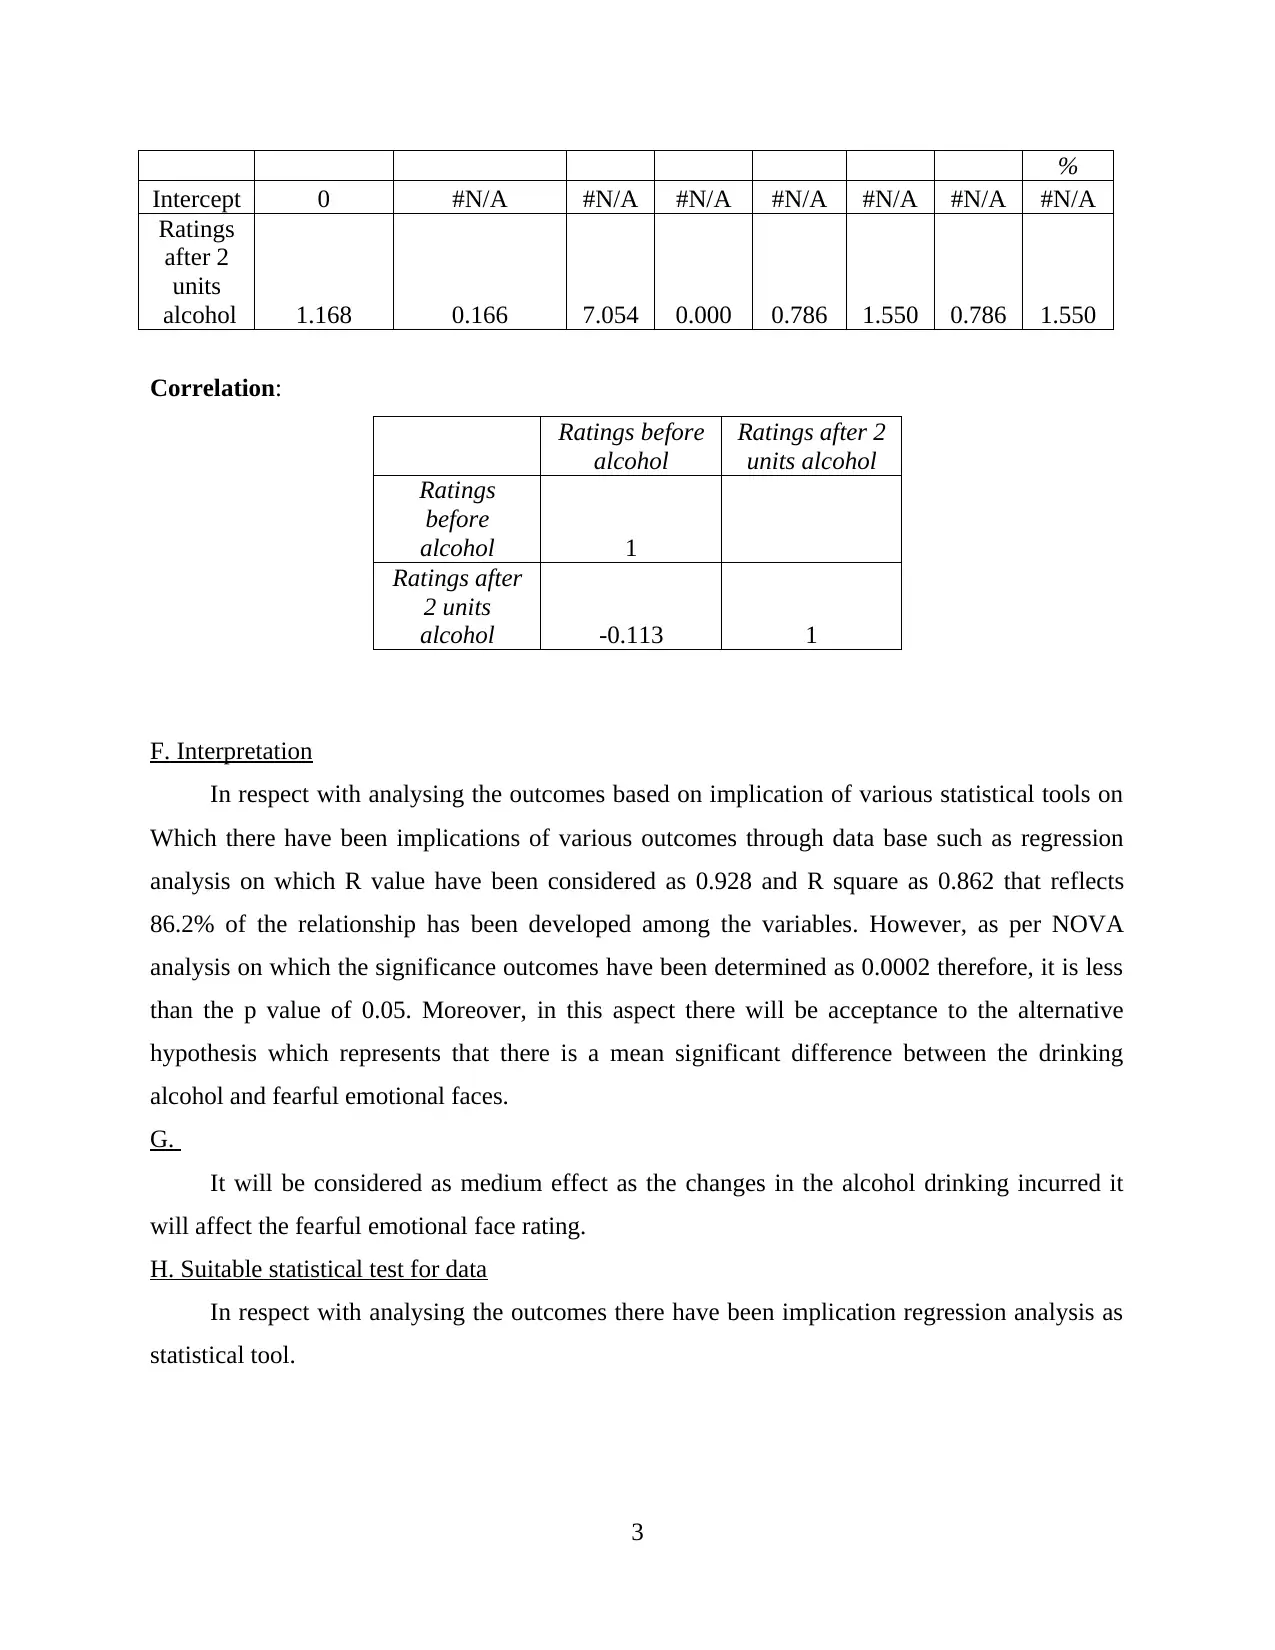
Correlation:
Ratings before
alcohol
Ratings after 2
units alcohol
Ratings
before
alcohol 1
Ratings after
2 units
alcohol -0.113 1
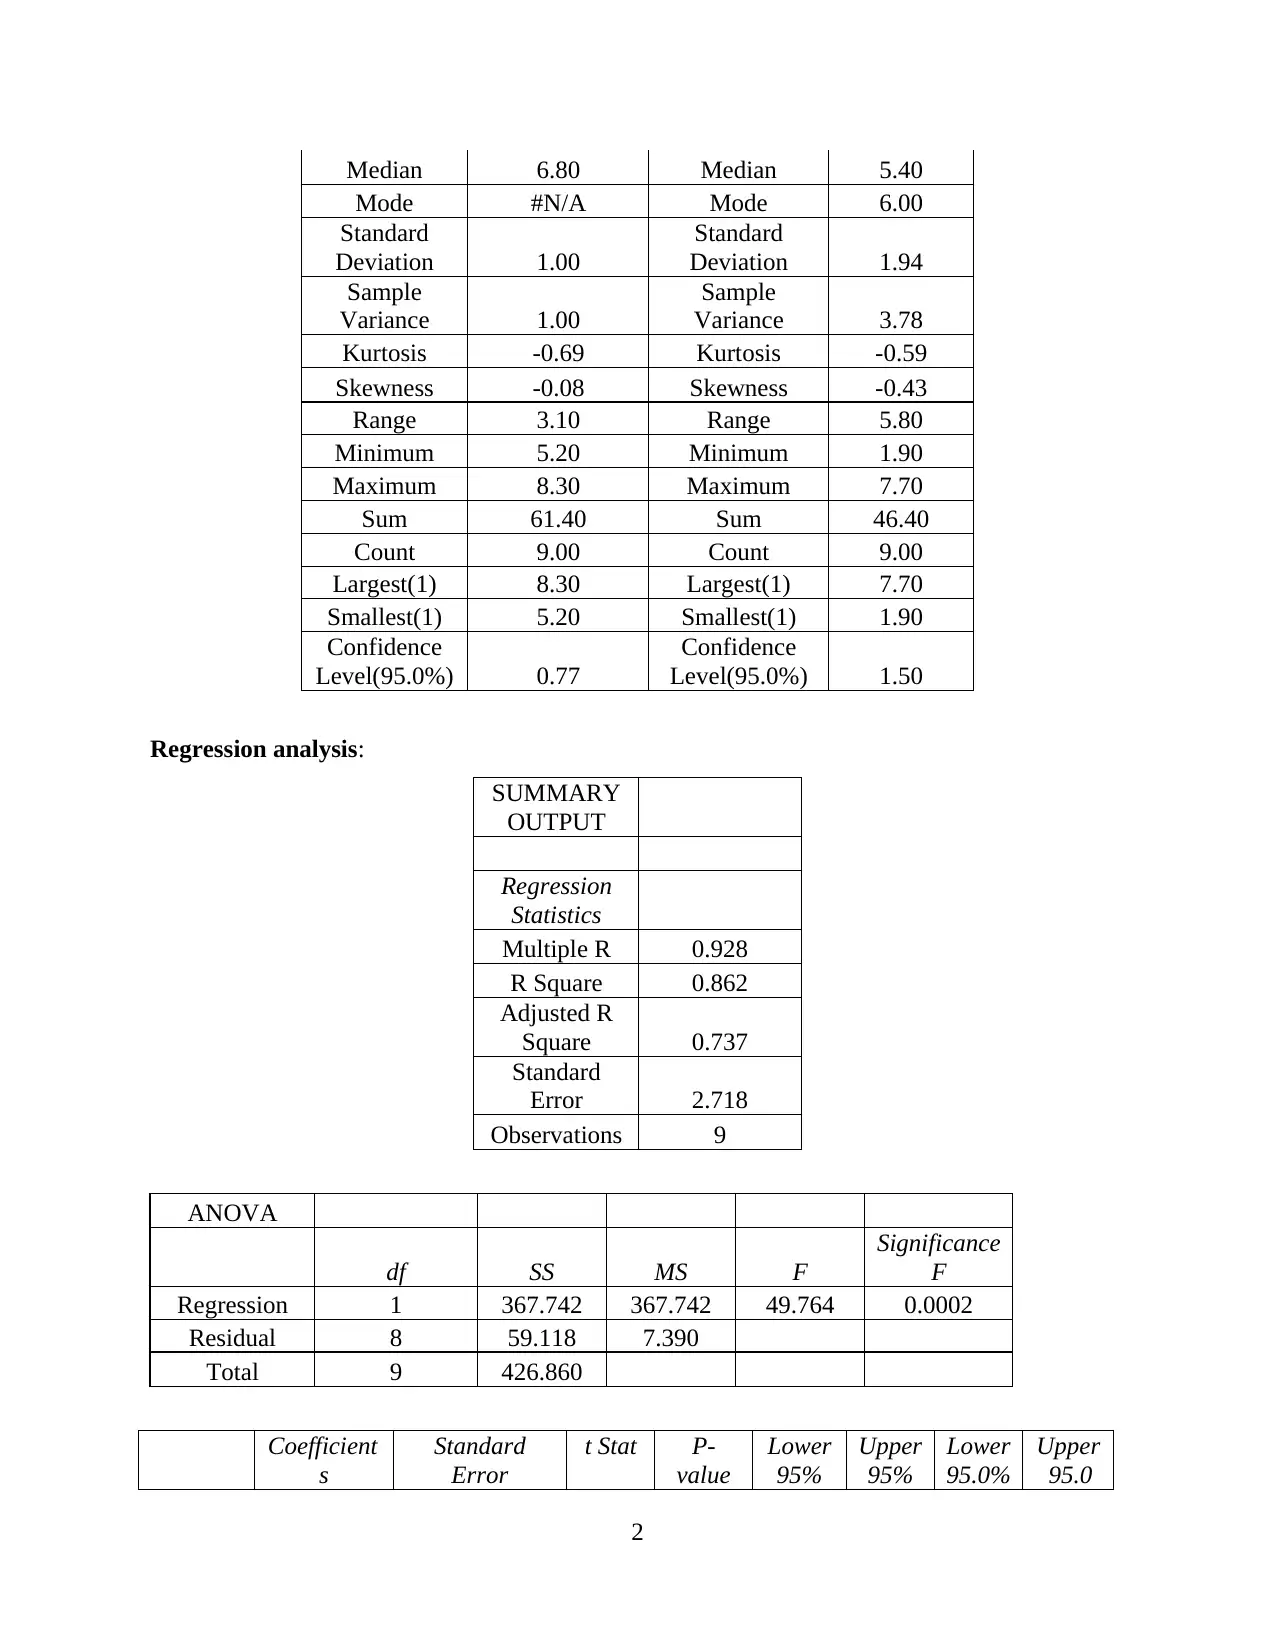
F. Interpretation
In respect with analysing the outcomes based on implication of various statistical tools on
Which there have been implications of various outcomes through data base such as regression
analysis on which R value have been considered as 0.928 and R square as 0.862 that reflects
86.2% of the relationship has been developed among the variables. However, as per NOVA
analysis on which the significance outcomes have been determined as 0.0002 therefore, it is less
than the p value of 0.05. Moreover, in this aspect there will be acceptance to the alternative
hypothesis which represents that there is a mean significant difference between the drinking
alcohol and fearful emotional faces.
G.
It will be considered as medium effect as the changes in the alcohol drinking incurred it
will affect the fearful emotional face rating.
H. Suitable statistical test for data
In respect with analysing the outcomes there have been implication regression analysis as
statistical tool.
3
Intercept 0 #N/A #N/A #N/A #N/A #N/A #N/A #N/A
Ratings
after 2
units
alcohol 1.168 0.166 7.054 0.000 0.786 1.550 0.786 1.550
Correlation:
Ratings before
alcohol
Ratings after 2
units alcohol
Ratings
before
alcohol 1
Ratings after
2 units
alcohol -0.113 1
F. Interpretation
In respect with analysing the outcomes based on implication of various statistical tools on
Which there have been implications of various outcomes through data base such as regression
analysis on which R value have been considered as 0.928 and R square as 0.862 that reflects
86.2% of the relationship has been developed among the variables. However, as per NOVA
analysis on which the significance outcomes have been determined as 0.0002 therefore, it is less
than the p value of 0.05. Moreover, in this aspect there will be acceptance to the alternative
hypothesis which represents that there is a mean significant difference between the drinking
alcohol and fearful emotional faces.
G.
It will be considered as medium effect as the changes in the alcohol drinking incurred it
will affect the fearful emotional face rating.
H. Suitable statistical test for data
In respect with analysing the outcomes there have been implication regression analysis as
statistical tool.
3
⊘ This is a preview!⊘
Do you want full access?
Subscribe today to unlock all pages.
Trusted by 1+ million students worldwide
I. Significance of overall effects on the drinking alcohol perceptions
In analysing the outcomes on which it has presented the significant value of the data base
on which it has been analysed to have effective ascertainment of the data base. However, there is
no such differences as per adding 2 more units of alcohol.
J. Significant changes in the perception after drinking 2 units
In ascertaining the outcomes on which it can be said that there are no changes incurred into
perception after drinking 2 units.
K. Significant changes in the perception after drinking 2 more units
In ascertaining the outcomes on which it can be said that there are no changes incurred into
perception after drinking 2 more units
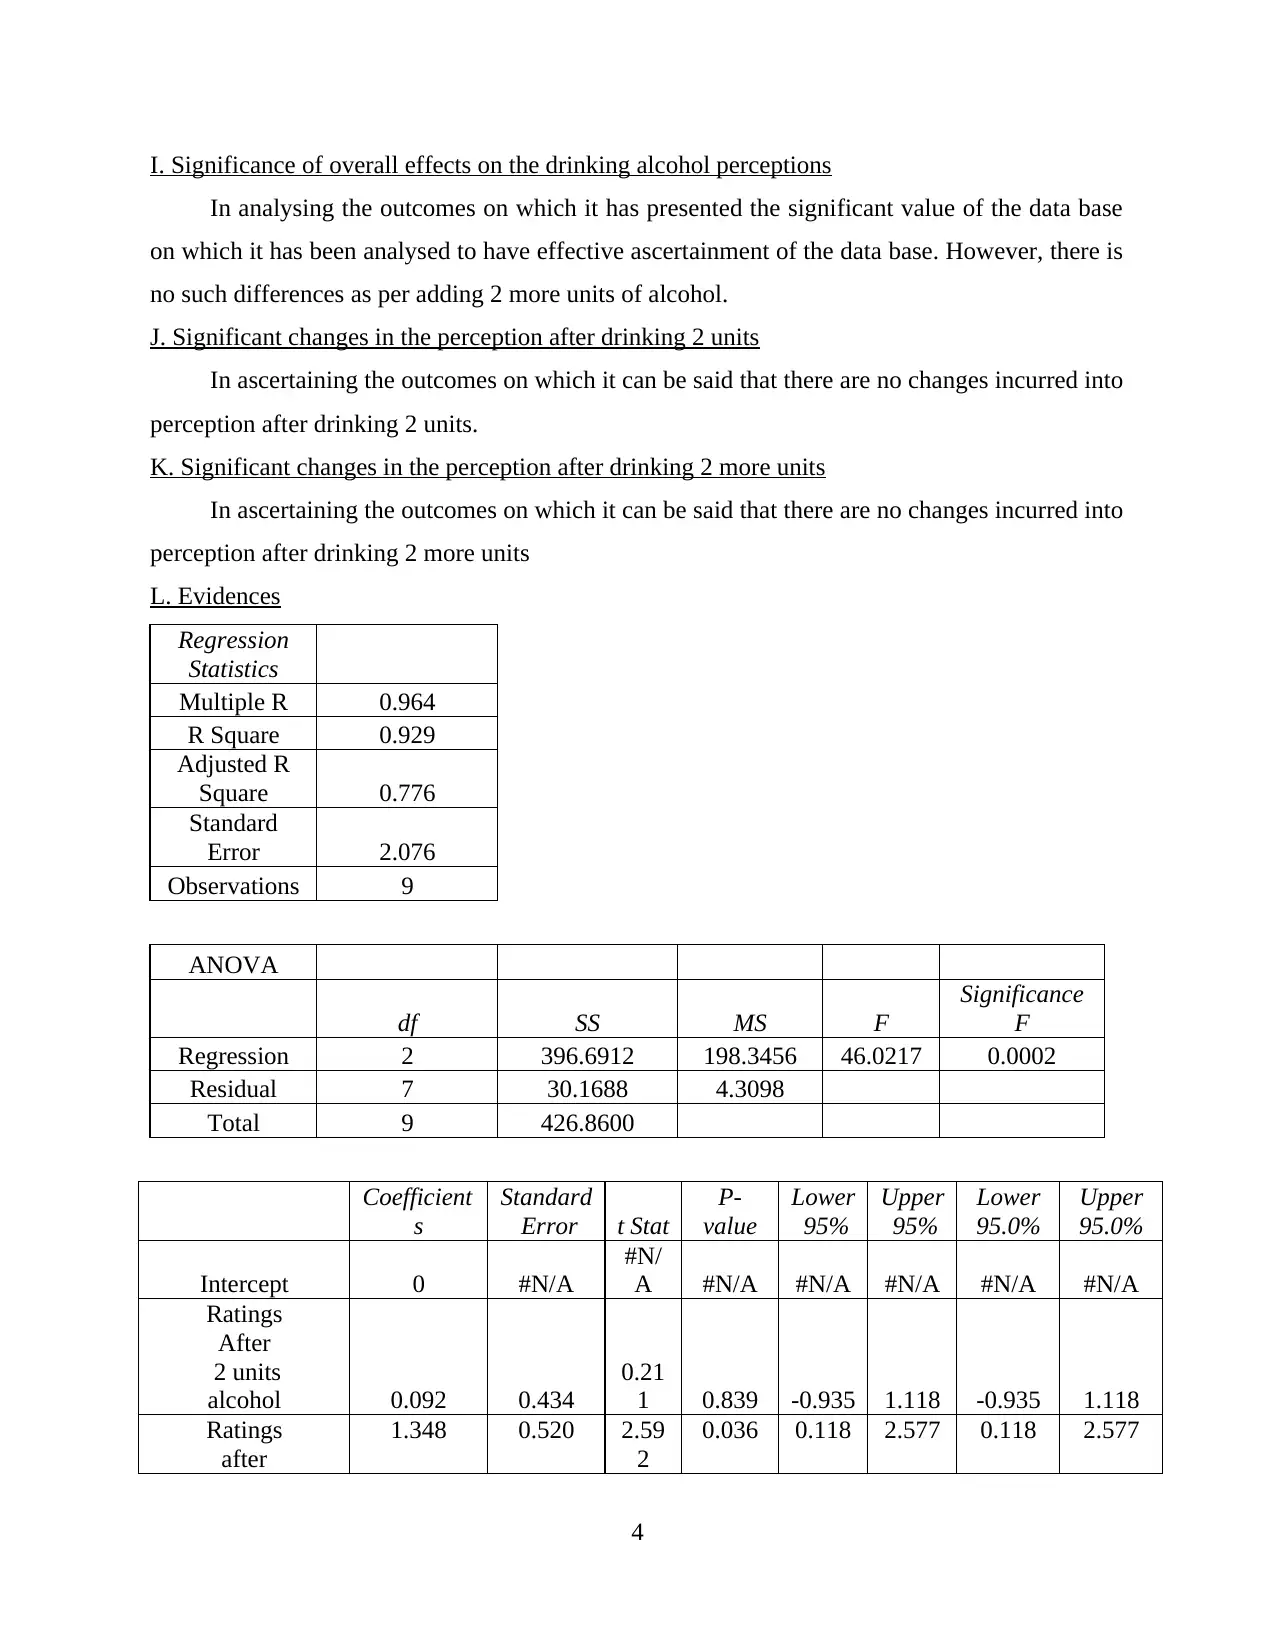
L. Evidences
Regression
Statistics
Multiple R 0.964
R Square 0.929
Adjusted R
Square 0.776
Standard
Error 2.076
Observations 9
ANOVA
df SS MS F
Significance
F
Regression 2 396.6912 198.3456 46.0217 0.0002
Residual 7 30.1688 4.3098
Total 9 426.8600
Coefficient
s
Standard
Error t Stat
P-
value
Lower
95%
Upper
95%
Lower
95.0%
Upper
95.0%
Intercept 0 #N/A
#N/
A #N/A #N/A #N/A #N/A #N/A
Ratings
After
2 units
alcohol 0.092 0.434
0.21
1 0.839 -0.935 1.118 -0.935 1.118
Ratings
after
1.348 0.520 2.59
2
0.036 0.118 2.577 0.118 2.577
4
In analysing the outcomes on which it has presented the significant value of the data base
on which it has been analysed to have effective ascertainment of the data base. However, there is
no such differences as per adding 2 more units of alcohol.
J. Significant changes in the perception after drinking 2 units
In ascertaining the outcomes on which it can be said that there are no changes incurred into
perception after drinking 2 units.
K. Significant changes in the perception after drinking 2 more units
In ascertaining the outcomes on which it can be said that there are no changes incurred into
perception after drinking 2 more units
L. Evidences
Regression
Statistics
Multiple R 0.964
R Square 0.929
Adjusted R
Square 0.776
Standard
Error 2.076
Observations 9
ANOVA
df SS MS F
Significance
F
Regression 2 396.6912 198.3456 46.0217 0.0002
Residual 7 30.1688 4.3098
Total 9 426.8600
Coefficient
s
Standard
Error t Stat
P-
value
Lower
95%
Upper
95%
Lower
95.0%
Upper
95.0%
Intercept 0 #N/A
#N/
A #N/A #N/A #N/A #N/A #N/A
Ratings
After
2 units
alcohol 0.092 0.434
0.21
1 0.839 -0.935 1.118 -0.935 1.118
Ratings
after
1.348 0.520 2.59
2
0.036 0.118 2.577 0.118 2.577
4
Paraphrase This Document
Need a fresh take? Get an instant paraphrase of this document with our AI Paraphraser
4
units
alcohol
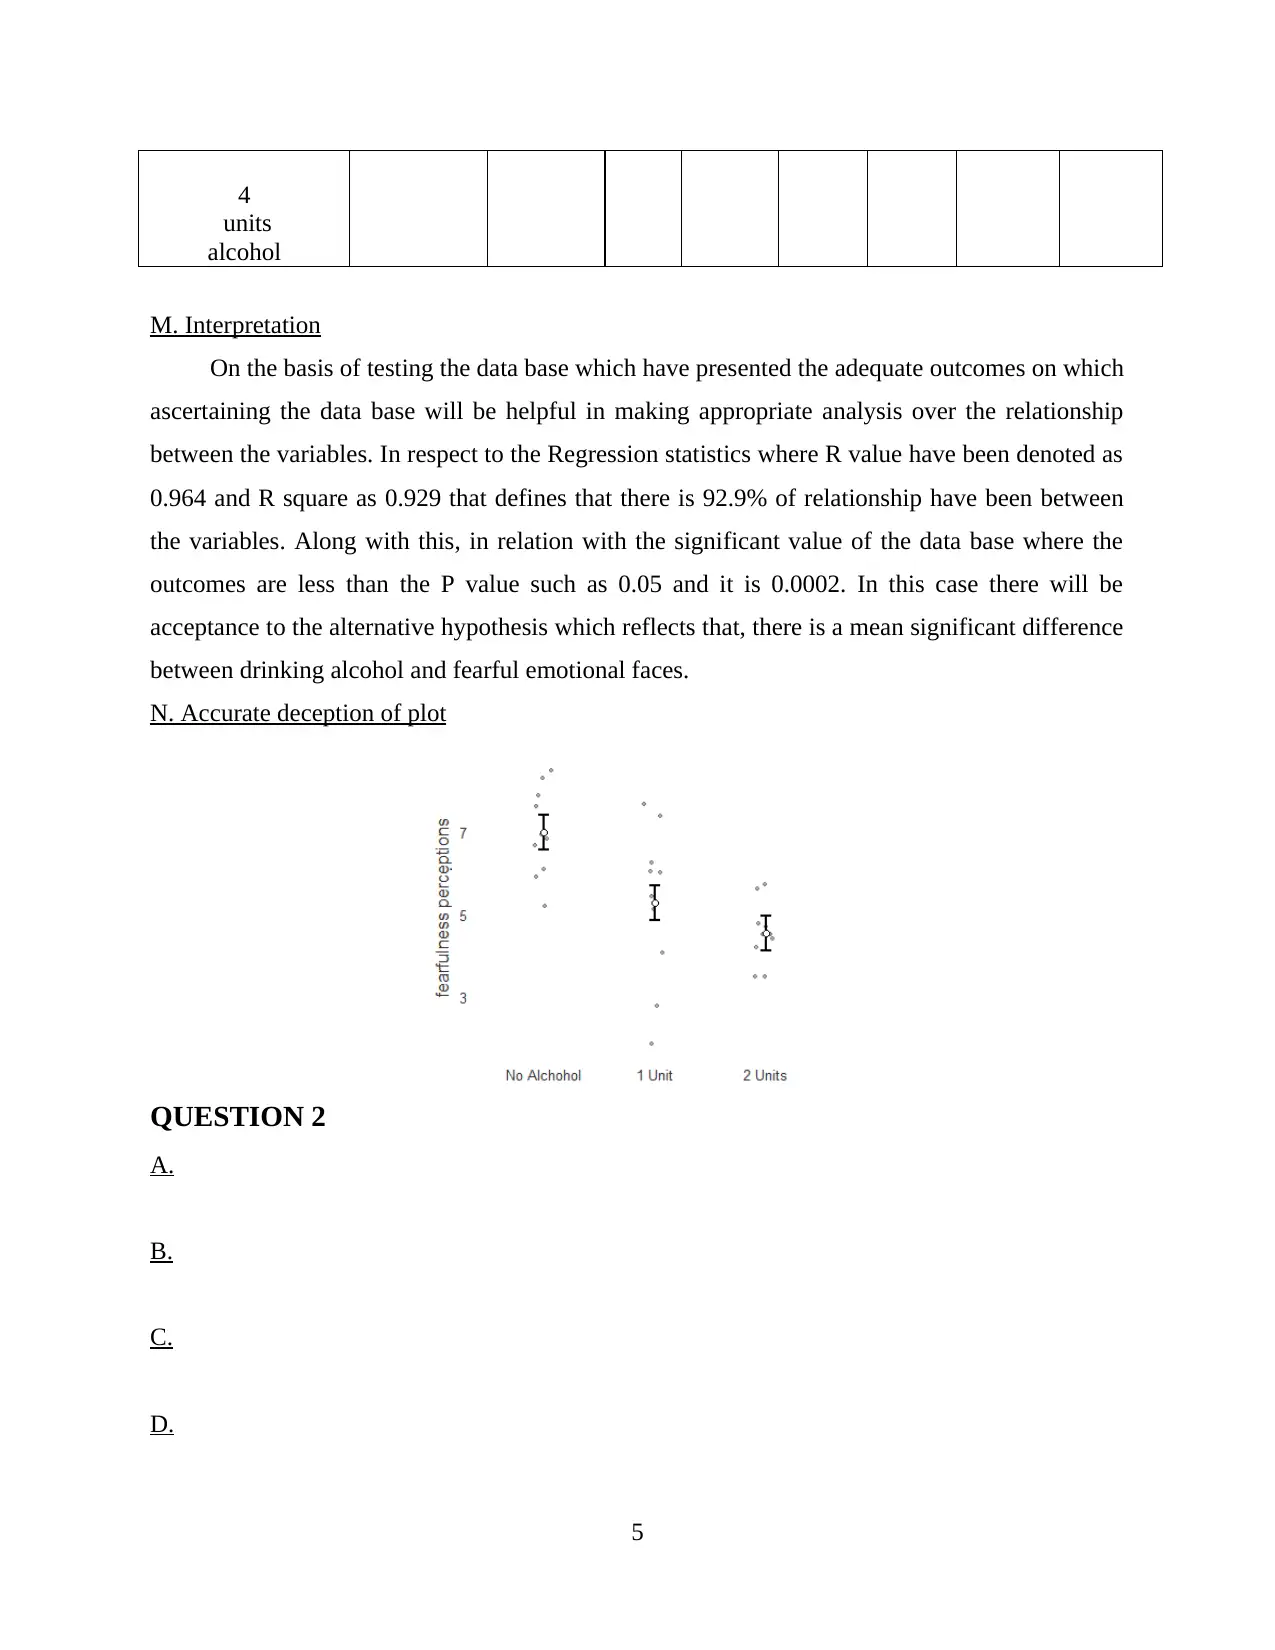
M. Interpretation
On the basis of testing the data base which have presented the adequate outcomes on which
ascertaining the data base will be helpful in making appropriate analysis over the relationship
between the variables. In respect to the Regression statistics where R value have been denoted as
0.964 and R square as 0.929 that defines that there is 92.9% of relationship have been between
the variables. Along with this, in relation with the significant value of the data base where the
outcomes are less than the P value such as 0.05 and it is 0.0002. In this case there will be
acceptance to the alternative hypothesis which reflects that, there is a mean significant difference
between drinking alcohol and fearful emotional faces.
N. Accurate deception of plot
QUESTION 2
A.
B.
C.
D.
5
units
alcohol
M. Interpretation
On the basis of testing the data base which have presented the adequate outcomes on which
ascertaining the data base will be helpful in making appropriate analysis over the relationship
between the variables. In respect to the Regression statistics where R value have been denoted as
0.964 and R square as 0.929 that defines that there is 92.9% of relationship have been between
the variables. Along with this, in relation with the significant value of the data base where the
outcomes are less than the P value such as 0.05 and it is 0.0002. In this case there will be
acceptance to the alternative hypothesis which reflects that, there is a mean significant difference
between drinking alcohol and fearful emotional faces.
N. Accurate deception of plot
QUESTION 2
A.
B.
C.
D.
5

E.
F.
G.
H.
I.
J.
K.
L.
M.
N.
O.
P.
Q.
R.
S.
6
F.
G.
H.
I.
J.
K.
L.
M.
N.
O.
P.
Q.
R.
S.
6
⊘ This is a preview!⊘
Do you want full access?
Subscribe today to unlock all pages.
Trusted by 1+ million students worldwide
QUESTION 3
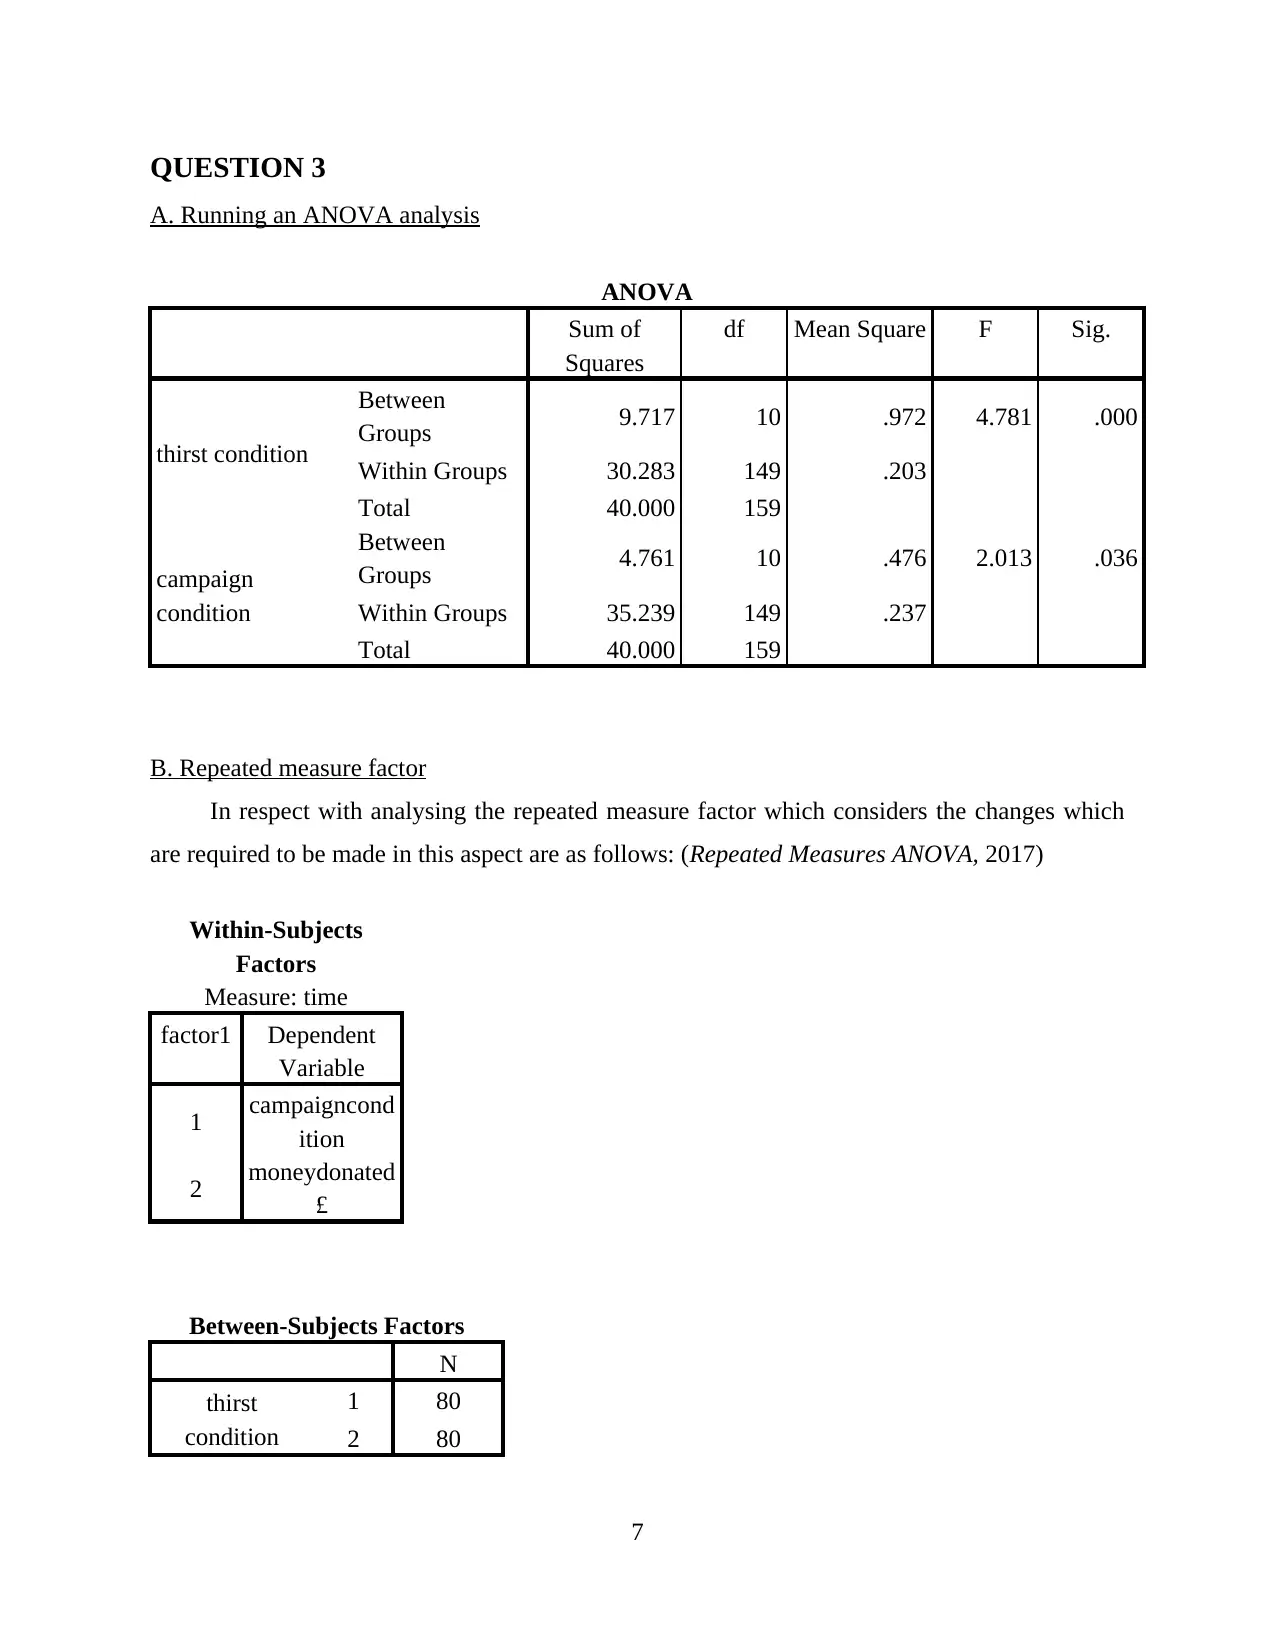
A. Running an ANOVA analysis
ANOVA
Sum of
Squares
df Mean Square F Sig.
thirst condition
Between
Groups 9.717 10 .972 4.781 .000
Within Groups 30.283 149 .203
Total 40.000 159
campaign
condition
Between
Groups 4.761 10 .476 2.013 .036
Within Groups 35.239 149 .237
Total 40.000 159
B. Repeated measure factor
In respect with analysing the repeated measure factor which considers the changes which
are required to be made in this aspect are as follows: (Repeated Measures ANOVA, 2017)
Within-Subjects
Factors
Measure: time
factor1 Dependent
Variable
1 campaigncond
ition
2 moneydonated
£
Between-Subjects Factors
N
thirst
condition
1 80
2 80
7
Paraphrase This Document
Need a fresh take? Get an instant paraphrase of this document with our AI Paraphraser
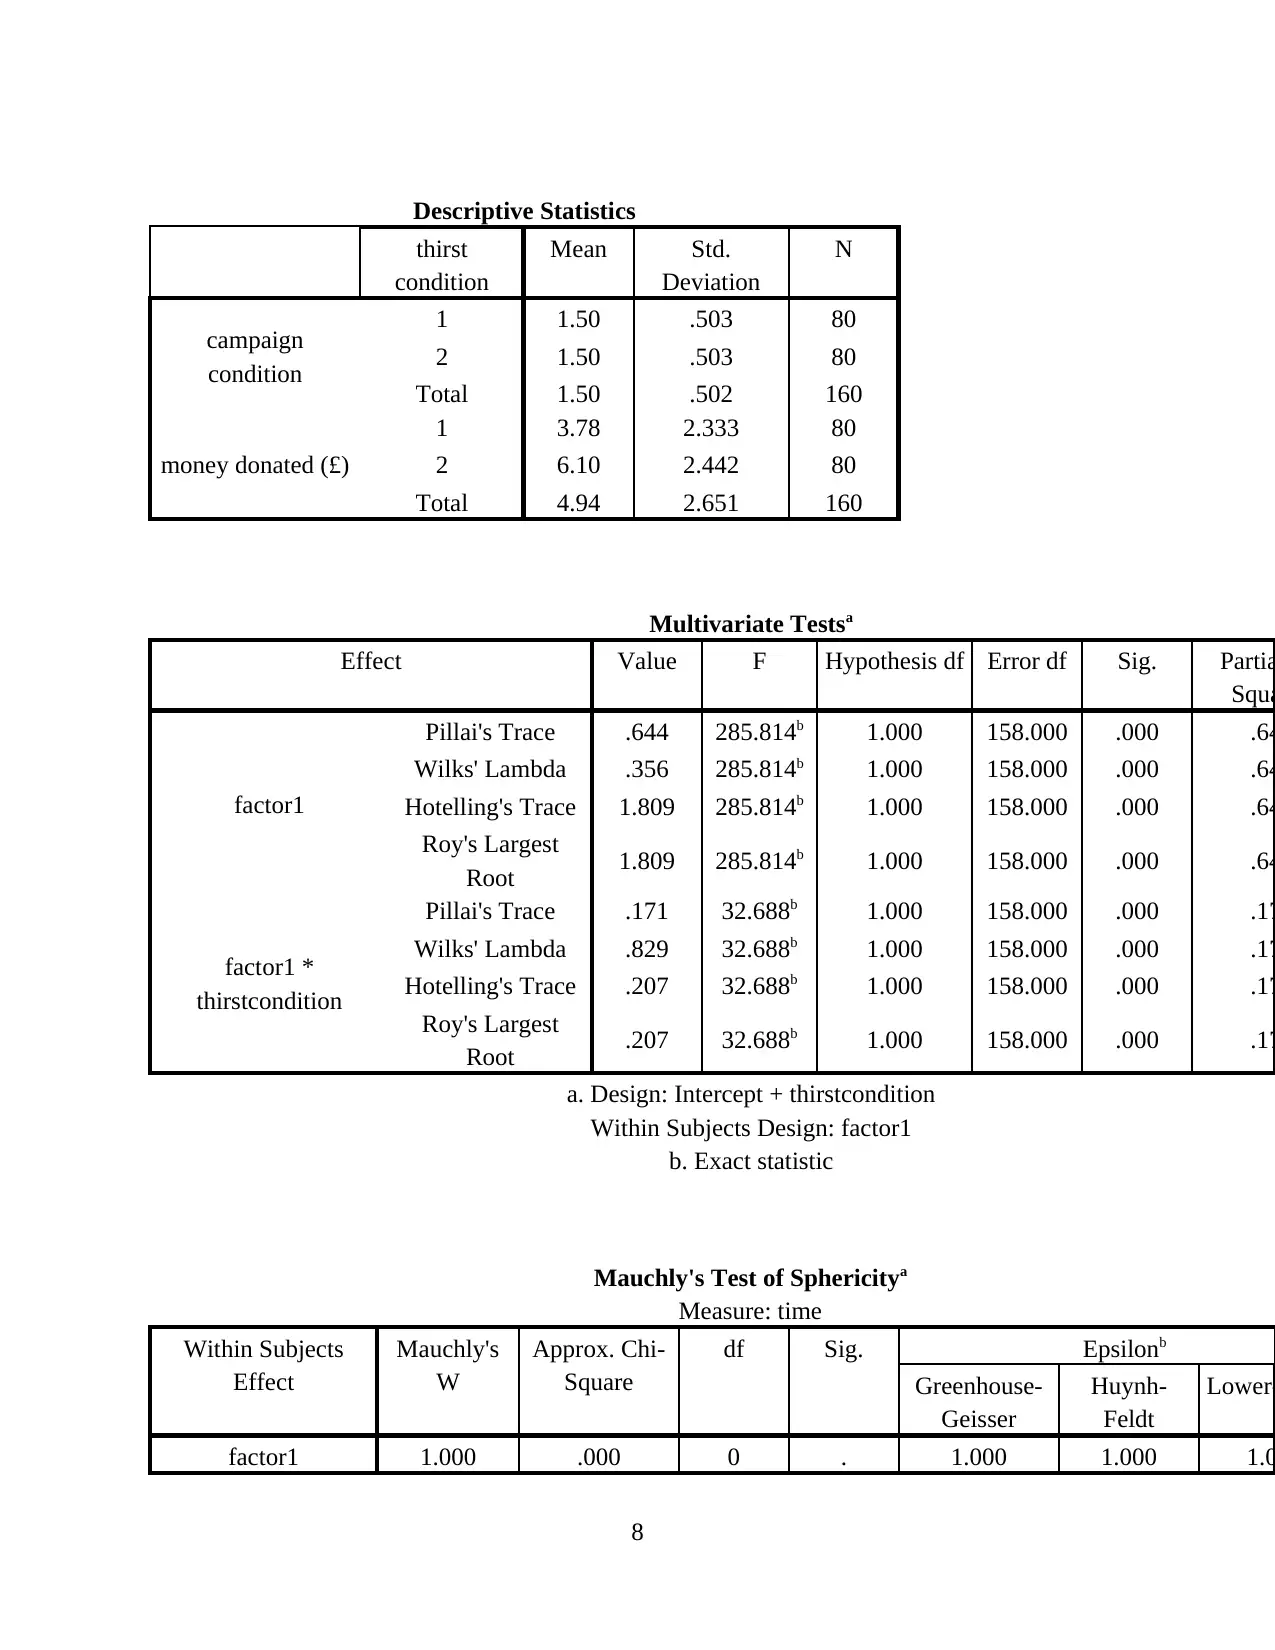
Descriptive Statistics
thirst
condition
Mean Std.
Deviation
N
campaign
condition
1 1.50 .503 80
2 1.50 .503 80
Total 1.50 .502 160
money donated (£)
1 3.78 2.333 80
2 6.10 2.442 80
Total 4.94 2.651 160
Multivariate Testsa
Effect Value F Hypothesis df Error df Sig. Partia
Squa
factor1
Pillai's Trace .644 285.814b 1.000 158.000 .000 .64
Wilks' Lambda .356 285.814b 1.000 158.000 .000 .64
Hotelling's Trace 1.809 285.814b 1.000 158.000 .000 .64
Roy's Largest
Root 1.809 285.814b 1.000 158.000 .000 .64
factor1 *
thirstcondition
Pillai's Trace .171 32.688b 1.000 158.000 .000 .17
Wilks' Lambda .829 32.688b 1.000 158.000 .000 .17
Hotelling's Trace .207 32.688b 1.000 158.000 .000 .17
Roy's Largest
Root .207 32.688b 1.000 158.000 .000 .17
a. Design: Intercept + thirstcondition
Within Subjects Design: factor1
b. Exact statistic
Mauchly's Test of Sphericitya
Measure: time
Within Subjects
Effect
Mauchly's
W
Approx. Chi-
Square
df Sig. Epsilonb
Greenhouse-
Geisser
Huynh-
Feldt
Lower-
factor1 1.000 .000 0 . 1.000 1.000 1.0
8
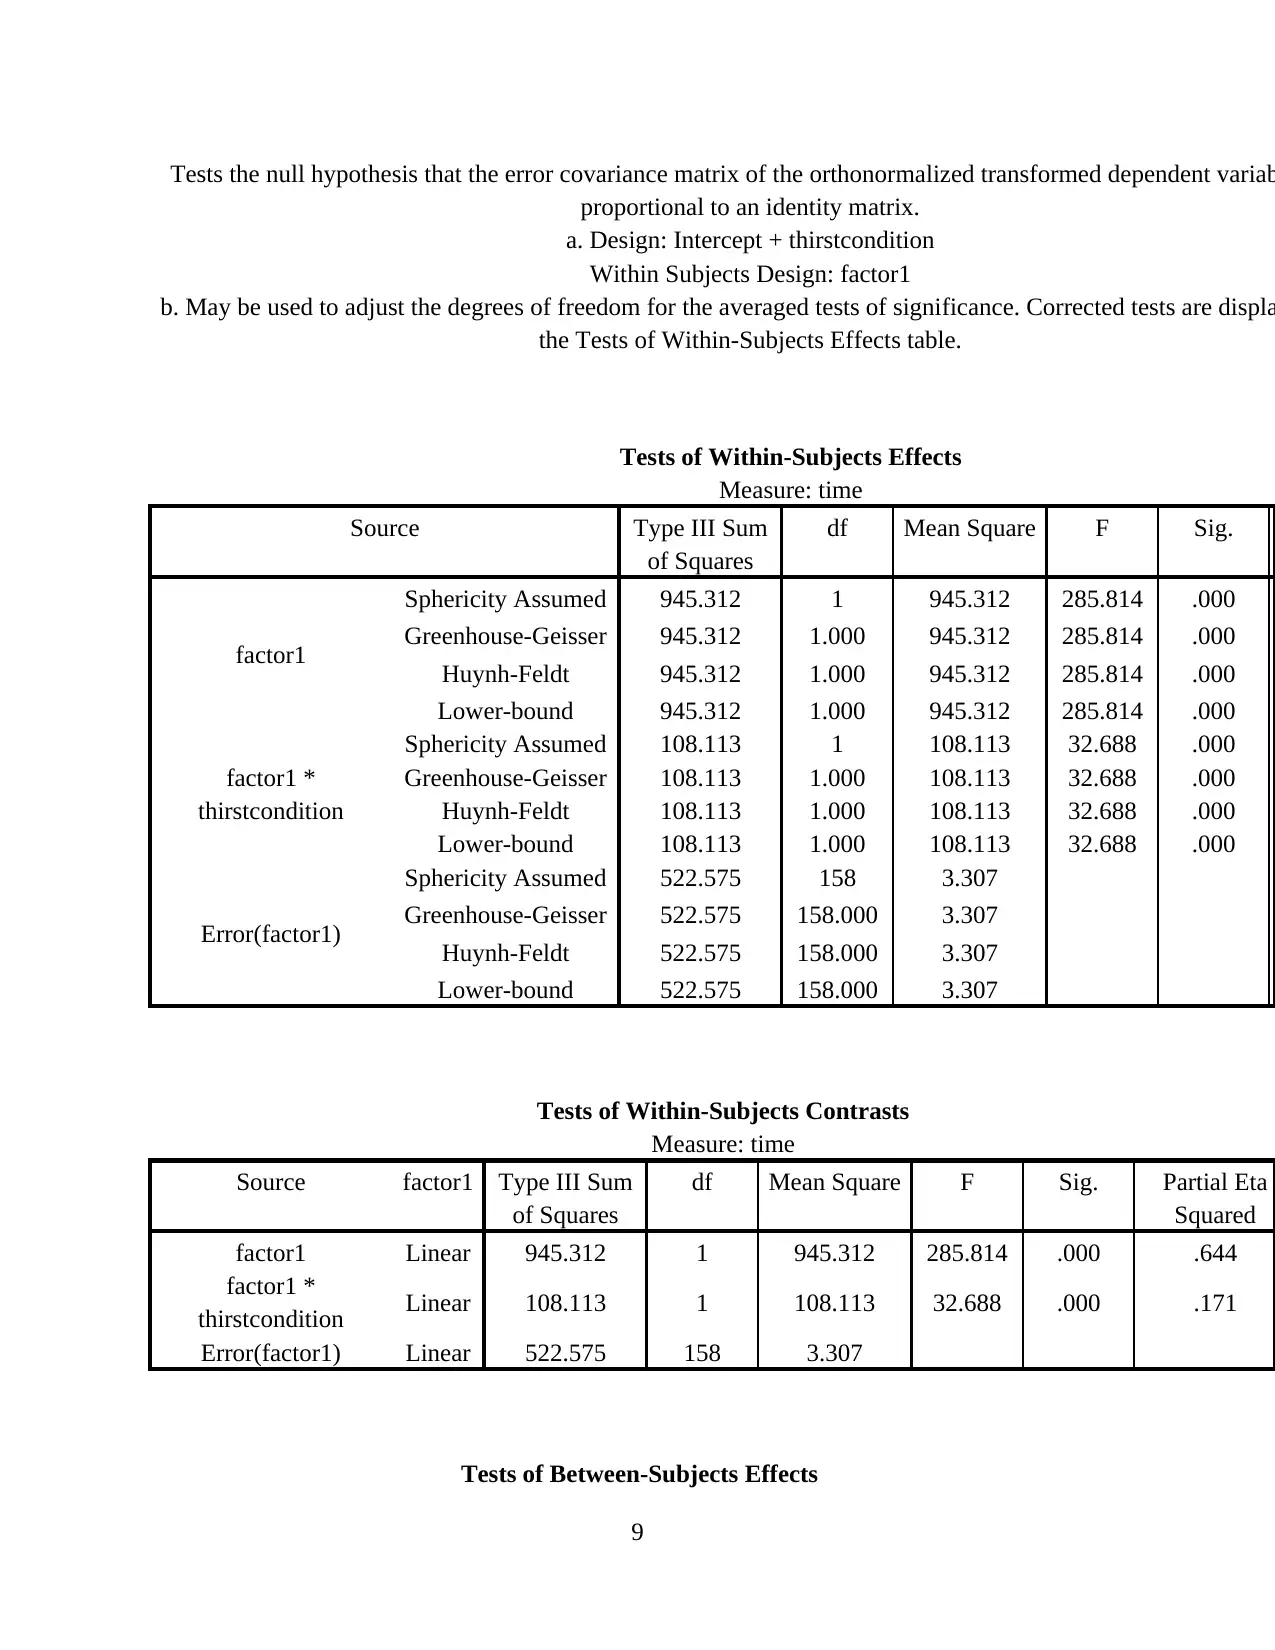
Tests the null hypothesis that the error covariance matrix of the orthonormalized transformed dependent variab
proportional to an identity matrix.
a. Design: Intercept + thirstcondition
Within Subjects Design: factor1
b. May be used to adjust the degrees of freedom for the averaged tests of significance. Corrected tests are displa
the Tests of Within-Subjects Effects table.
Tests of Within-Subjects Effects
Measure: time
Source Type III Sum
of Squares
df Mean Square F Sig.
factor1
Sphericity Assumed 945.312 1 945.312 285.814 .000
Greenhouse-Geisser 945.312 1.000 945.312 285.814 .000
Huynh-Feldt 945.312 1.000 945.312 285.814 .000
Lower-bound 945.312 1.000 945.312 285.814 .000
factor1 *
thirstcondition
Sphericity Assumed 108.113 1 108.113 32.688 .000
Greenhouse-Geisser 108.113 1.000 108.113 32.688 .000
Huynh-Feldt 108.113 1.000 108.113 32.688 .000
Lower-bound 108.113 1.000 108.113 32.688 .000
Error(factor1)
Sphericity Assumed 522.575 158 3.307
Greenhouse-Geisser 522.575 158.000 3.307
Huynh-Feldt 522.575 158.000 3.307
Lower-bound 522.575 158.000 3.307
Tests of Within-Subjects Contrasts
Measure: time
Source factor1 Type III Sum
of Squares
df Mean Square F Sig. Partial Eta
Squared
factor1 Linear 945.312 1 945.312 285.814 .000 .644
factor1 *
thirstcondition Linear 108.113 1 108.113 32.688 .000 .171
Error(factor1) Linear 522.575 158 3.307
Tests of Between-Subjects Effects
9
⊘ This is a preview!⊘
Do you want full access?
Subscribe today to unlock all pages.
Trusted by 1+ million students worldwide
1 out of 16
Related Documents


Your All-in-One AI-Powered Toolkit for Academic Success.
+13062052269
info@desklib.com
Available 24*7 on WhatsApp / Email
![[object Object]](/_next/static/media/star-bottom.7253800d.svg)
Unlock your academic potential
Copyright © 2020–2026 A2Z Services. All Rights Reserved. Developed and managed by ZUCOL.