BUACC5931 Semester 1: Research and Statistical Methods Report
VerifiedAdded on 2023/06/10
|12
|3174
|287
Report
AI Summary
This report delves into the research and statistical methods employed to investigate the association between quantitative and qualitative job insecurity and employee well-being, as studied by De Witte et al. (2010) in the Belgian banking sector. It discusses the rationale behind sample size determination, highlighting the advantages of larger samples for reliable results. The report identifies probability sampling, specifically simple random sampling, as the chosen method, outlining its benefits and drawbacks, including reduced error margins and potential resource intensity. Measures of variables, such as reliability (Cronbach's alpha) and validity (internal and external), are examined. The importance of collecting data on social demographics is emphasized, noting its role as an independent variable. Furthermore, the report explores the application of mixed research designs, weighing the strengths and weaknesses of both qualitative and quantitative approaches, and considers the use of a sequential explanatory design. Desklib provides a platform for students to access this and similar solved assignments to aid in their studies.

Running head: RESEARCH AND STATISTICAL METHODS FOR BUSINESS
Research and Statistical Methods for Business
Research and Statistical Methods for Business
Paraphrase This Document
Need a fresh take? Get an instant paraphrase of this document with our AI Paraphraser
RESEARCH AND STATISTICAL METHODS FOR BUSINESS 2
Table of Contents
Q1: Sample size...............................................................................................................................3
Q2: Sampling method......................................................................................................................3
Q3: Measures of variables...............................................................................................................5
Q4: Collection of data on social demographics...............................................................................6
Q5: Research design........................................................................................................................7
References......................................................................................................................................11
RESEARCH AND STATISTICAL METHODS FOR BUSINESS 3
Q1: Sample size
This size of the sample is required due to the high amount of samples are highly proximate to the
population. Moreover, the primary objective of implementing the high amount of sample is to
gather the detail and wide category of information through a sample of the population. A
researcher has targeted larger size of the sampleto develop some assumption regarding the
research study. The size of the sample offers more reliable results with finest quality and
validity, but, there is a need for a large extent of cost with time (Mackey, and Gass, 2015).The
larger size of the sample is more essential for obtaining the results amongst variables that are
considerable distinguish.For the qualitative investigation, the purpose is to reduce the chances of
addressing failure. A high amount of sample includes more people because there is the
possibility of obtaining larger prospect data and developsan image for appraisal. Moreover, the
larger size of sample depicts theinhabitants and restricts the impact of incredible scrutiny
(Taylor, Bogdan, and DeVault, 2015).
Q2: Sampling method
Probability sampling is the existing sampling technique in this investigation. This technique
depends on the evidence that each respondent of the large population hasrecognized and equal
chances of being the selection. In this investigation, a simple random sampling technique has
chosen as population member are associated with each otherin terms of the considerable variable
(Lewis, 2015).
Advantages of using Random Sampling
Random sampling allows a researcher to obtain the evaluation of facts and figures that are
collected within the lower margin of error. It restricted that sampling should base on specific
criteria and enables an investigator to select the feasible process of sampling. The whole process
⊘ This is a preview!⊘
Do you want full access?
Subscribe today to unlock all pages.
Trusted by 1+ million students worldwide
RESEARCH AND STATISTICAL METHODS FOR BUSINESS 4
relies on the randomized process which depicts the whole population. It also permits the facts to
provide the precise insight regarding specific subject concern (Glesne, 2015).
It is also determined that simple random sampling enables each respondent within the targeted
field to get identical chances of being selected. It helps to acquire more feasible facts and figures
as each respondent has 50/50 probability. It is a process of developing the inherent fairness
intothe investigation but, there is no previous evidence with regards to entailingparticipants
intothe data collection process. Another advantage of applying a simple random sampling
technique is that there is no requirement for particular comprehension with respect to gathered
data. This could be beneficial for developing the purpose and objectives in an efficientwith the
effective way (Flick, 2015).
A research can also communicate with workforces who engaged in Belgian banks that are
affiliated with joint industrial committee sector in 2001 in spite of understanding the Belgium
banking structure. Under the random sampling techniques, a question is asked and then answered
by targeted individuals. This technique could be beneficial to review the questions with the
particular purpose. A researcher can accomplish the aim with objectives of research because of
accomplishing the tasks and gathering the data by implementing the simple random sampling
procedure (Silverman, 2016).
Disadvantages of Random Sampling
In this sampling technique, each person should be personally interviewed and reviewed hence the
data can be adequately collected. When an individualis in groups, then their responses tend to be
influenced by answers of others. Hence, a researcher should deal with each individual on 1 on 1
basis (Ledford, and Gast, 2018). There is need of more resources, time with efficiency as
compared to another investigation tool. For this procedure, a high extent of competency is
Paraphrase This Document
Need a fresh take? Get an instant paraphrase of this document with our AI Paraphraser
RESEARCH AND STATISTICAL METHODS FOR BUSINESS 5
essential for a researcher because it enables them to segregate the applicableand inappropriate
data from gathered information. Moreover, in case of lack of competency, consistency in
conclusion and presented information may be difficult (Smith, 2015).
Q3: Measures of variables
Reliability can be illustrated as the consistency in the conclusion. In the given investigation,
more than one individual perceives the conduct of respondents and recorded their data with
regards to the concern of research to acquire reliable information (De Witte, et. al., 2010). It
could be implemented to measure the pooled data from an individual. While a researcher
conducted a survey two times, then their score on two intervals should be consistent. In such
way, the test would be dependable (Choy, 2014).
Cronbach’s alpha is a measure that is practiced to determine the reliability and inside stability. It
shows the set of gauge or test substances. Furthermore, the reliability of a given measurement
defines the extent to which an investigator measuresthe aspects.Cronbach’s alpha is a significant
mode to assess the strength of consistency. If the alpha value is .70 then the instrument will be
considered as reliable (Dang, and Pheng, 2015).
Validity
Validity is the dependability and credibility of research that demonstrates the authentic outcomes
and valid determination of intelligence. The responseis depending on the extent of the researcher
to build liaison with participants (Dumay, and Cai, 2015).
The given measure can be used to measure tothe validity of research:
Internal validity
The mechanism and procedure implemented in the investigation could be used to evaluate what a
researcher perceives to measure. For example, as part of a survey on Belgian banks, workforces
RESEARCH AND STATISTICAL METHODS FOR BUSINESS 6
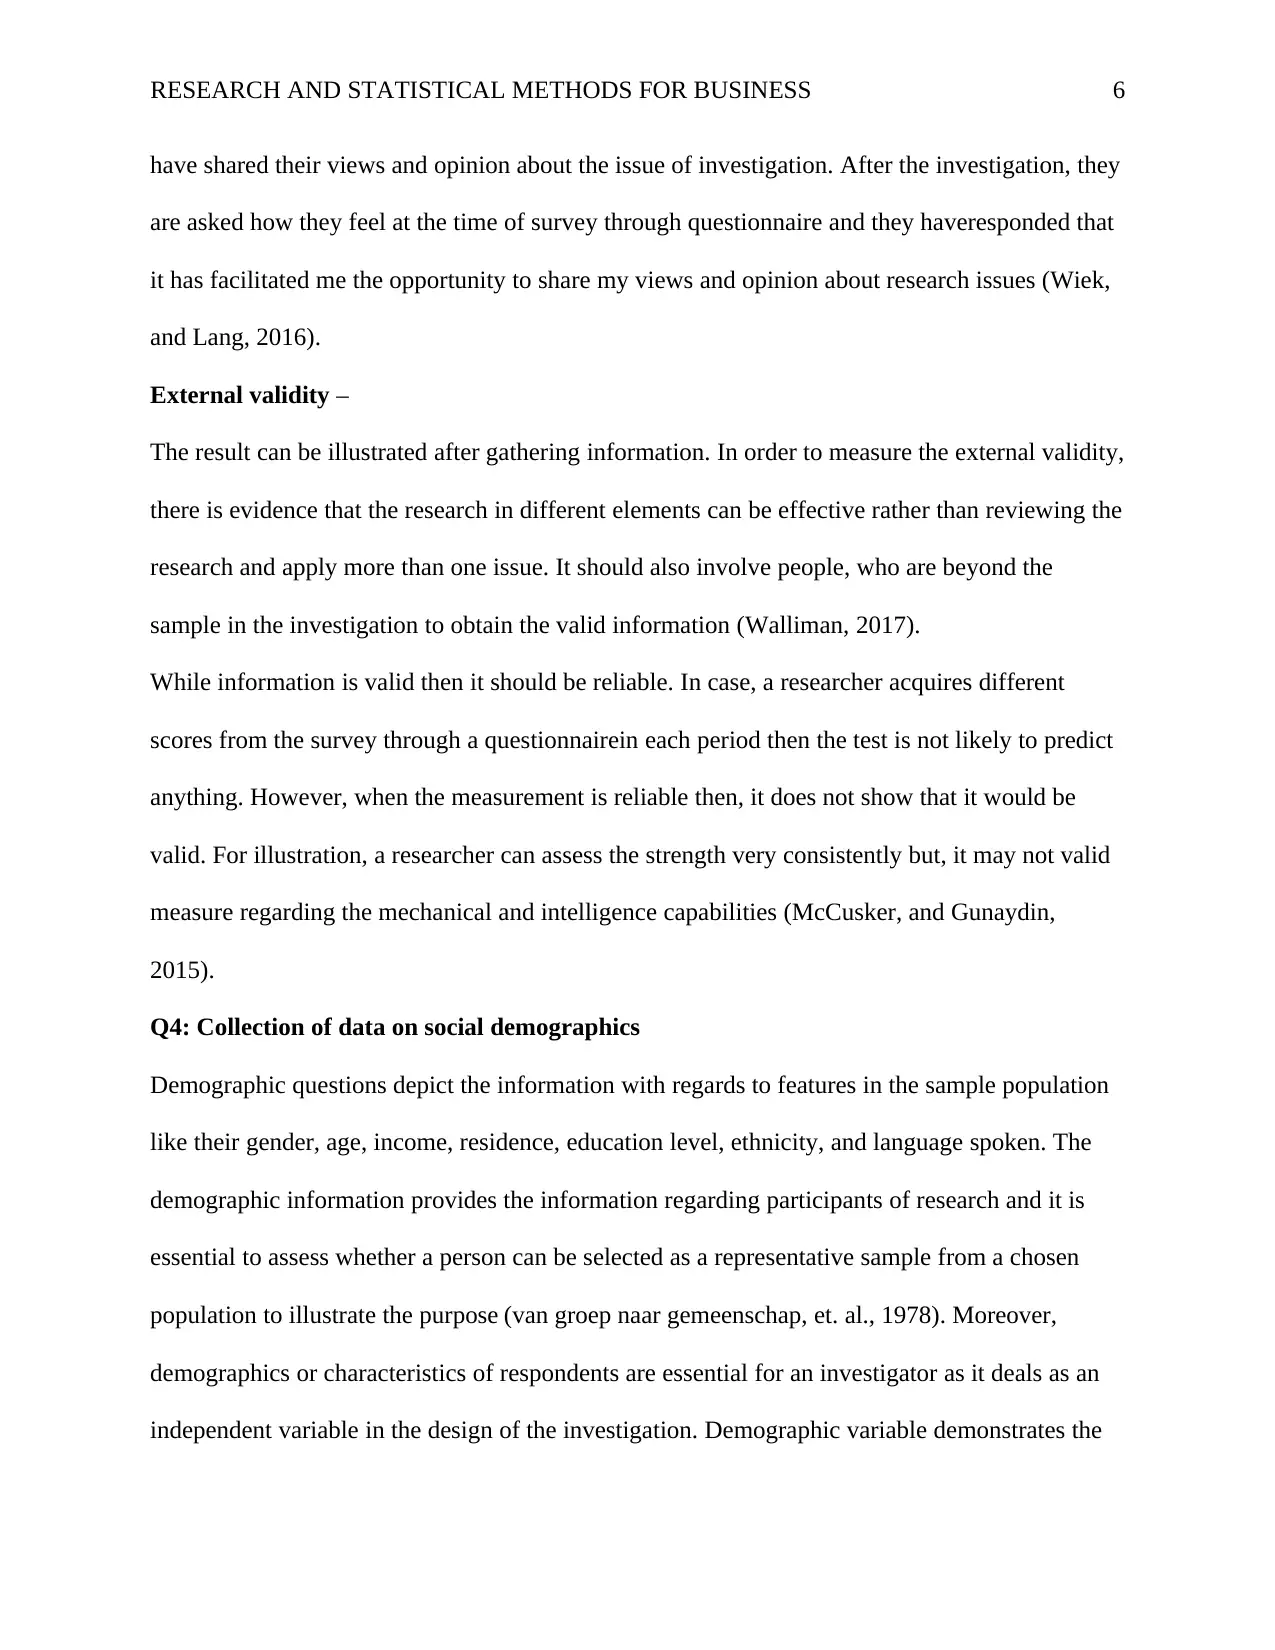
have shared their views and opinion about the issue of investigation. After the investigation, they
are asked how they feel at the time of survey through questionnaire and they haveresponded that
it has facilitated me the opportunity to share my views and opinion about research issues (Wiek,
and Lang, 2016).
External validity –
The result can be illustrated after gathering information. In order to measure the external validity,
there is evidence that the research in different elements can be effective rather than reviewing the
research and apply more than one issue. It should also involve people, who are beyond the
sample in the investigation to obtain the valid information (Walliman, 2017).
While information is valid then it should be reliable. In case, a researcher acquires different
scores from the survey through a questionnairein each period then the test is not likely to predict
anything. However, when the measurement is reliable then, it does not show that it would be
valid. For illustration, a researcher can assess the strength very consistently but, it may not valid
measure regarding the mechanical and intelligence capabilities (McCusker, and Gunaydin,
2015).
Q4: Collection of data on social demographics
Demographic questions depict the information with regards to features in the sample population
like their gender, age, income, residence, education level, ethnicity, and language spoken. The
demographic information provides the information regarding participants of research and it is
essential to assess whether a person can be selected as a representative sample from a chosen
population to illustrate the purpose (van groep naar gemeenschap, et. al., 1978). Moreover,
demographics or characteristics of respondents are essential for an investigator as it deals as an
independent variable in the design of the investigation. Demographic variable demonstrates the
⊘ This is a preview!⊘
Do you want full access?
Subscribe today to unlock all pages.
Trusted by 1+ million students worldwide
RESEARCH AND STATISTICAL METHODS FOR BUSINESS 7
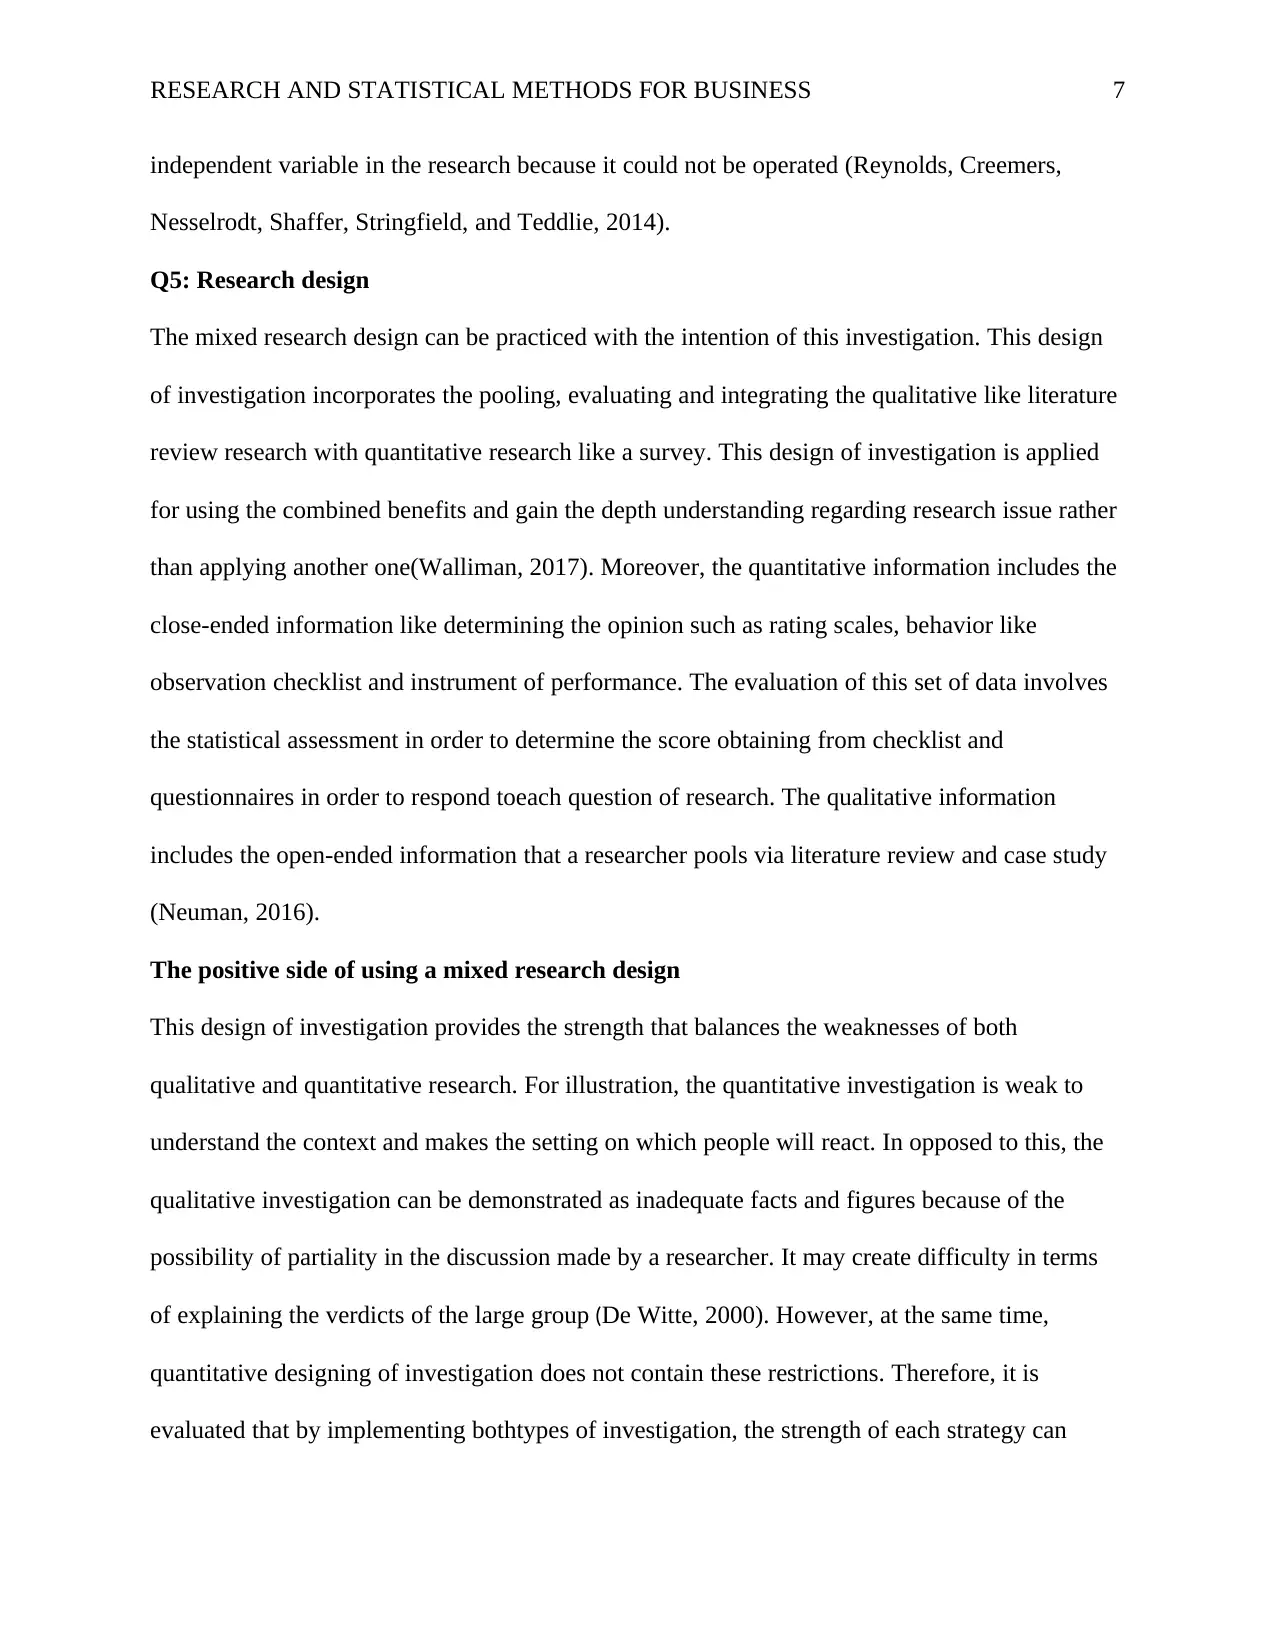
independent variable in the research because it could not be operated (Reynolds, Creemers,
Nesselrodt, Shaffer, Stringfield, and Teddlie, 2014).
Q5: Research design
The mixed research design can be practiced with the intention of this investigation. This design
of investigation incorporates the pooling, evaluating and integrating the qualitative like literature
review research with quantitative research like a survey. This design of investigation is applied
for using the combined benefits and gain the depth understanding regarding research issue rather
than applying another one(Walliman, 2017). Moreover, the quantitative information includes the
close-ended information like determining the opinion such as rating scales, behavior like
observation checklist and instrument of performance. The evaluation of this set of data involves
the statistical assessment in order to determine the score obtaining from checklist and
questionnaires in order to respond toeach question of research. The qualitative information
includes the open-ended information that a researcher pools via literature review and case study
(Neuman, 2016).
The positive side of using a mixed research design
This design of investigation provides the strength that balances the weaknesses of both
qualitative and quantitative research. For illustration, the quantitative investigation is weak to
understand the context and makes the setting on which people will react. In opposed to this, the
qualitative investigation can be demonstrated as inadequate facts and figures because of the
possibility of partiality in the discussion made by a researcher. It may create difficulty in terms
of explaining the verdicts of the large group (De Witte, 2000). However, at the same time,
quantitative designing of investigation does not contain these restrictions. Therefore, it is
evaluated that by implementing bothtypes of investigation, the strength of each strategy can
Paraphrase This Document
Need a fresh take? Get an instant paraphrase of this document with our AI Paraphraser
RESEARCH AND STATISTICAL METHODS FOR BUSINESS 8
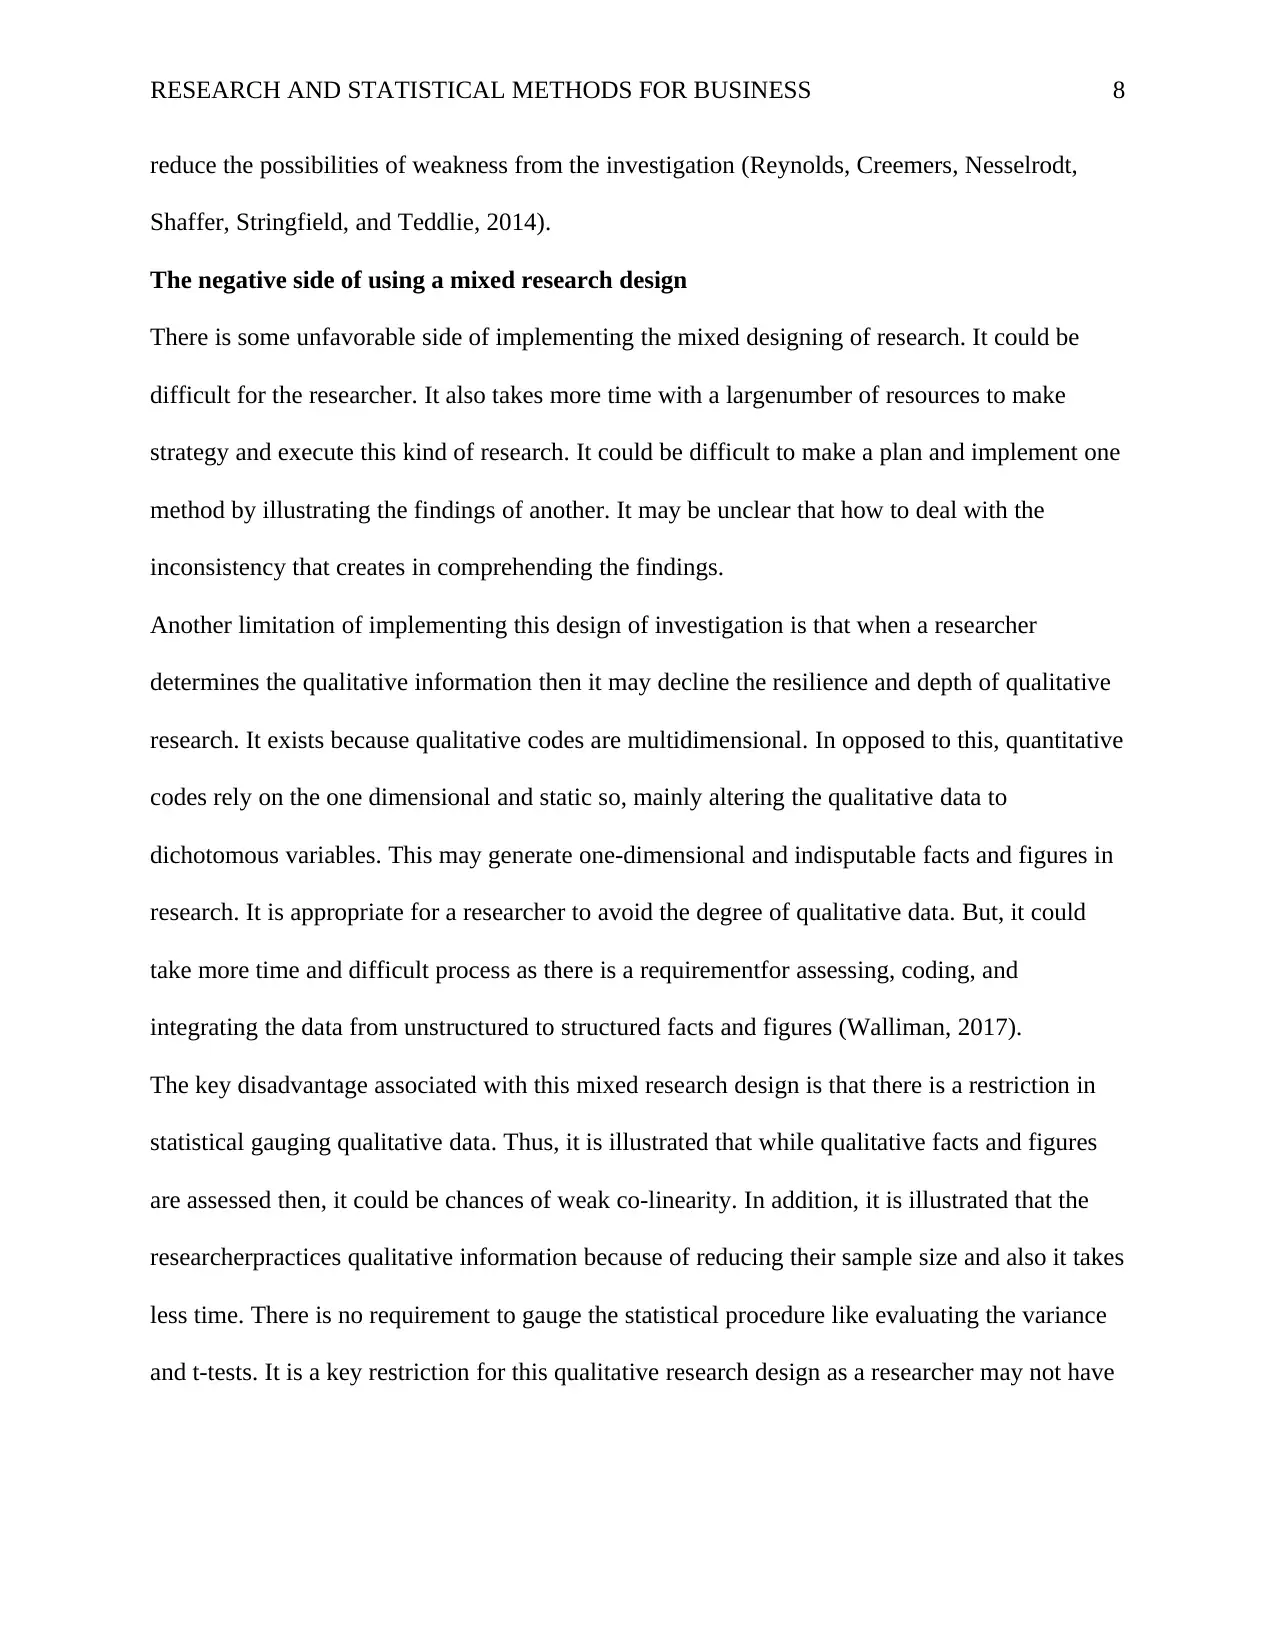
reduce the possibilities of weakness from the investigation (Reynolds, Creemers, Nesselrodt,
Shaffer, Stringfield, and Teddlie, 2014).
The negative side of using a mixed research design
There is some unfavorable side of implementing the mixed designing of research. It could be
difficult for the researcher. It also takes more time with a largenumber of resources to make
strategy and execute this kind of research. It could be difficult to make a plan and implement one
method by illustrating the findings of another. It may be unclear that how to deal with the
inconsistency that creates in comprehending the findings.
Another limitation of implementing this design of investigation is that when a researcher
determines the qualitative information then it may decline the resilience and depth of qualitative
research. It exists because qualitative codes are multidimensional. In opposed to this, quantitative
codes rely on the one dimensional and static so, mainly altering the qualitative data to
dichotomous variables. This may generate one-dimensional and indisputable facts and figures in
research. It is appropriate for a researcher to avoid the degree of qualitative data. But, it could
take more time and difficult process as there is a requirementfor assessing, coding, and
integrating the data from unstructured to structured facts and figures (Walliman, 2017).
The key disadvantage associated with this mixed research design is that there is a restriction in
statistical gauging qualitative data. Thus, it is illustrated that while qualitative facts and figures
are assessed then, it could be chances of weak co-linearity. In addition, it is illustrated that the
researcherpractices qualitative information because of reducing their sample size and also it takes
less time. There is no requirement to gauge the statistical procedure like evaluating the variance
and t-tests. It is a key restriction for this qualitative research design as a researcher may not have
RESEARCH AND STATISTICAL METHODS FOR BUSINESS 9
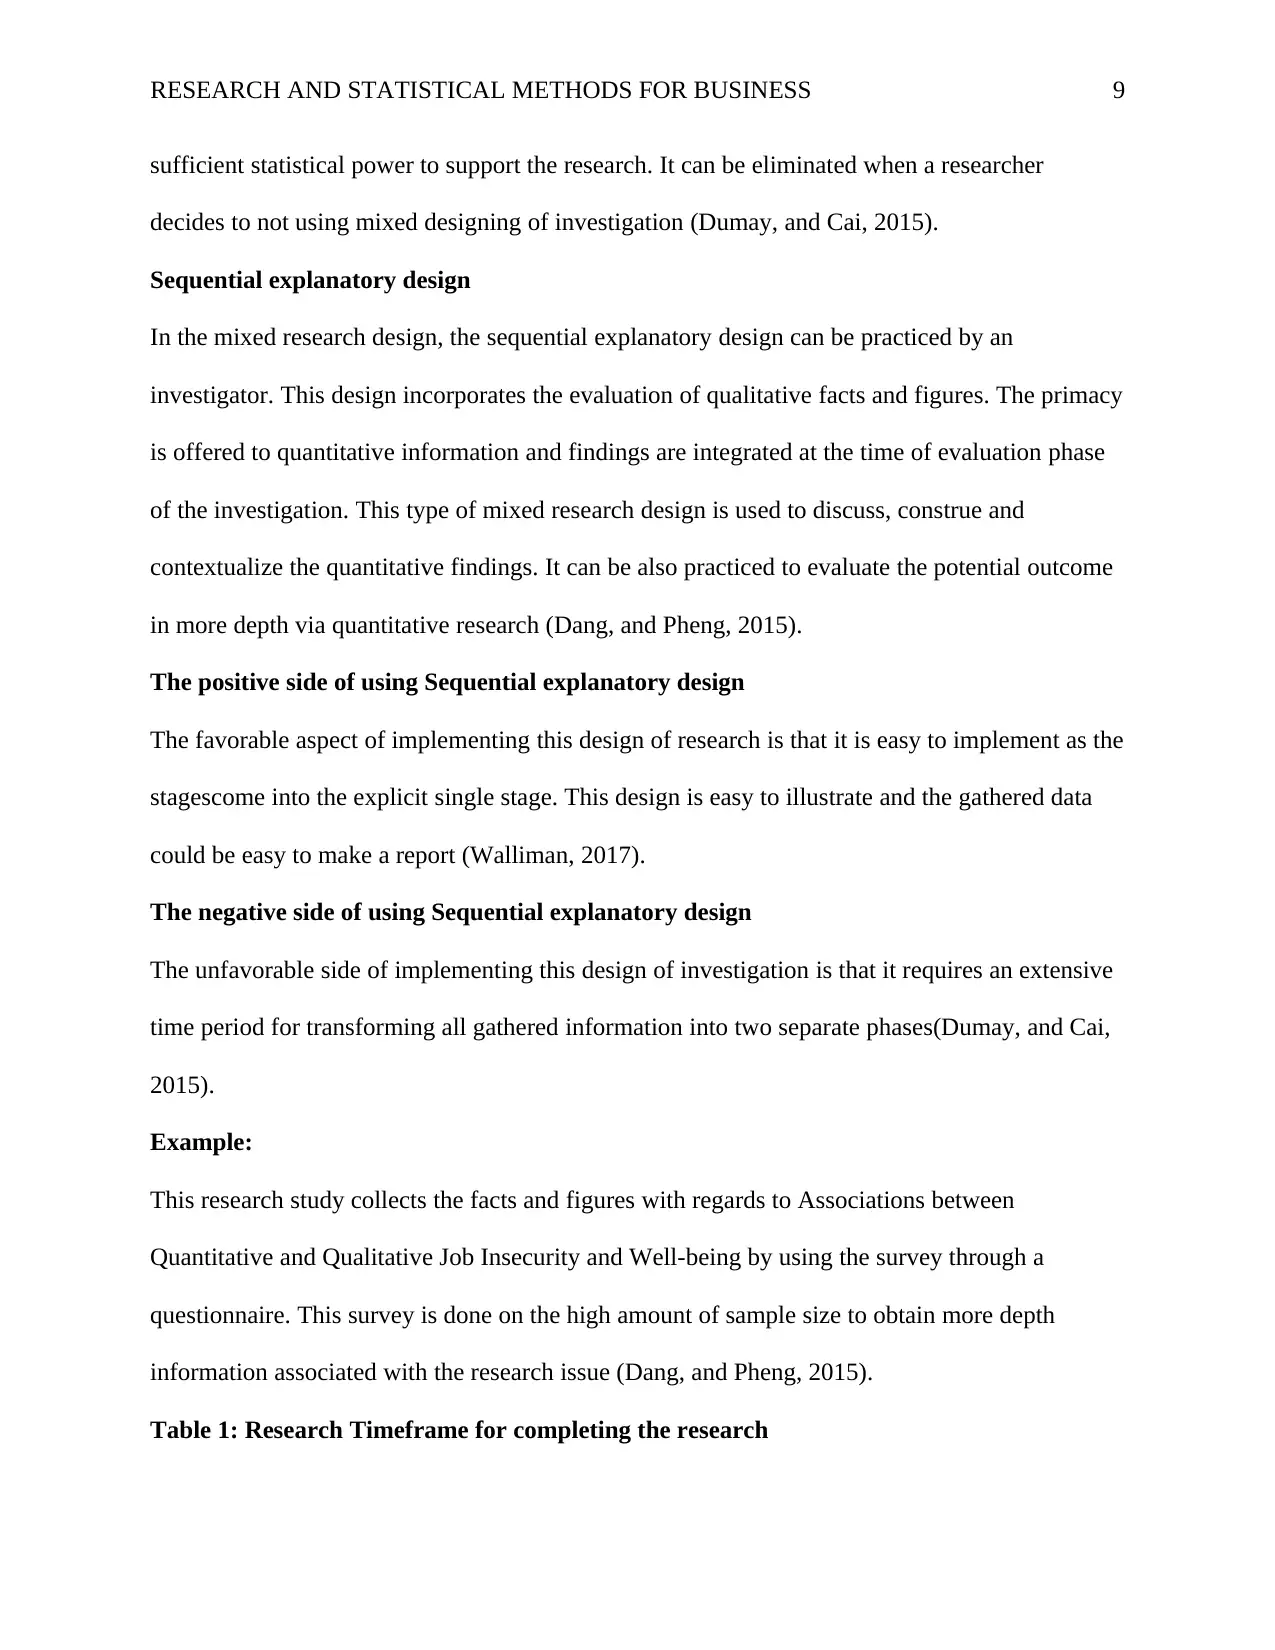
sufficient statistical power to support the research. It can be eliminated when a researcher
decides to not using mixed designing of investigation (Dumay, and Cai, 2015).
Sequential explanatory design
In the mixed research design, the sequential explanatory design can be practiced by an
investigator. This design incorporates the evaluation of qualitative facts and figures. The primacy
is offered to quantitative information and findings are integrated at the time of evaluation phase
of the investigation. This type of mixed research design is used to discuss, construe and
contextualize the quantitative findings. It can be also practiced to evaluate the potential outcome
in more depth via quantitative research (Dang, and Pheng, 2015).
The positive side of using Sequential explanatory design
The favorable aspect of implementing this design of research is that it is easy to implement as the
stagescome into the explicit single stage. This design is easy to illustrate and the gathered data
could be easy to make a report (Walliman, 2017).
The negative side of using Sequential explanatory design
The unfavorable side of implementing this design of investigation is that it requires an extensive
time period for transforming all gathered information into two separate phases(Dumay, and Cai,
2015).
Example:
This research study collects the facts and figures with regards to Associations between
Quantitative and Qualitative Job Insecurity and Well-being by using the survey through a
questionnaire. This survey is done on the high amount of sample size to obtain more depth
information associated with the research issue (Dang, and Pheng, 2015).
Table 1: Research Timeframe for completing the research
⊘ This is a preview!⊘
Do you want full access?
Subscribe today to unlock all pages.
Trusted by 1+ million students worldwide
RESEARCH AND STATISTICAL METHODS FOR BUSINESS 10
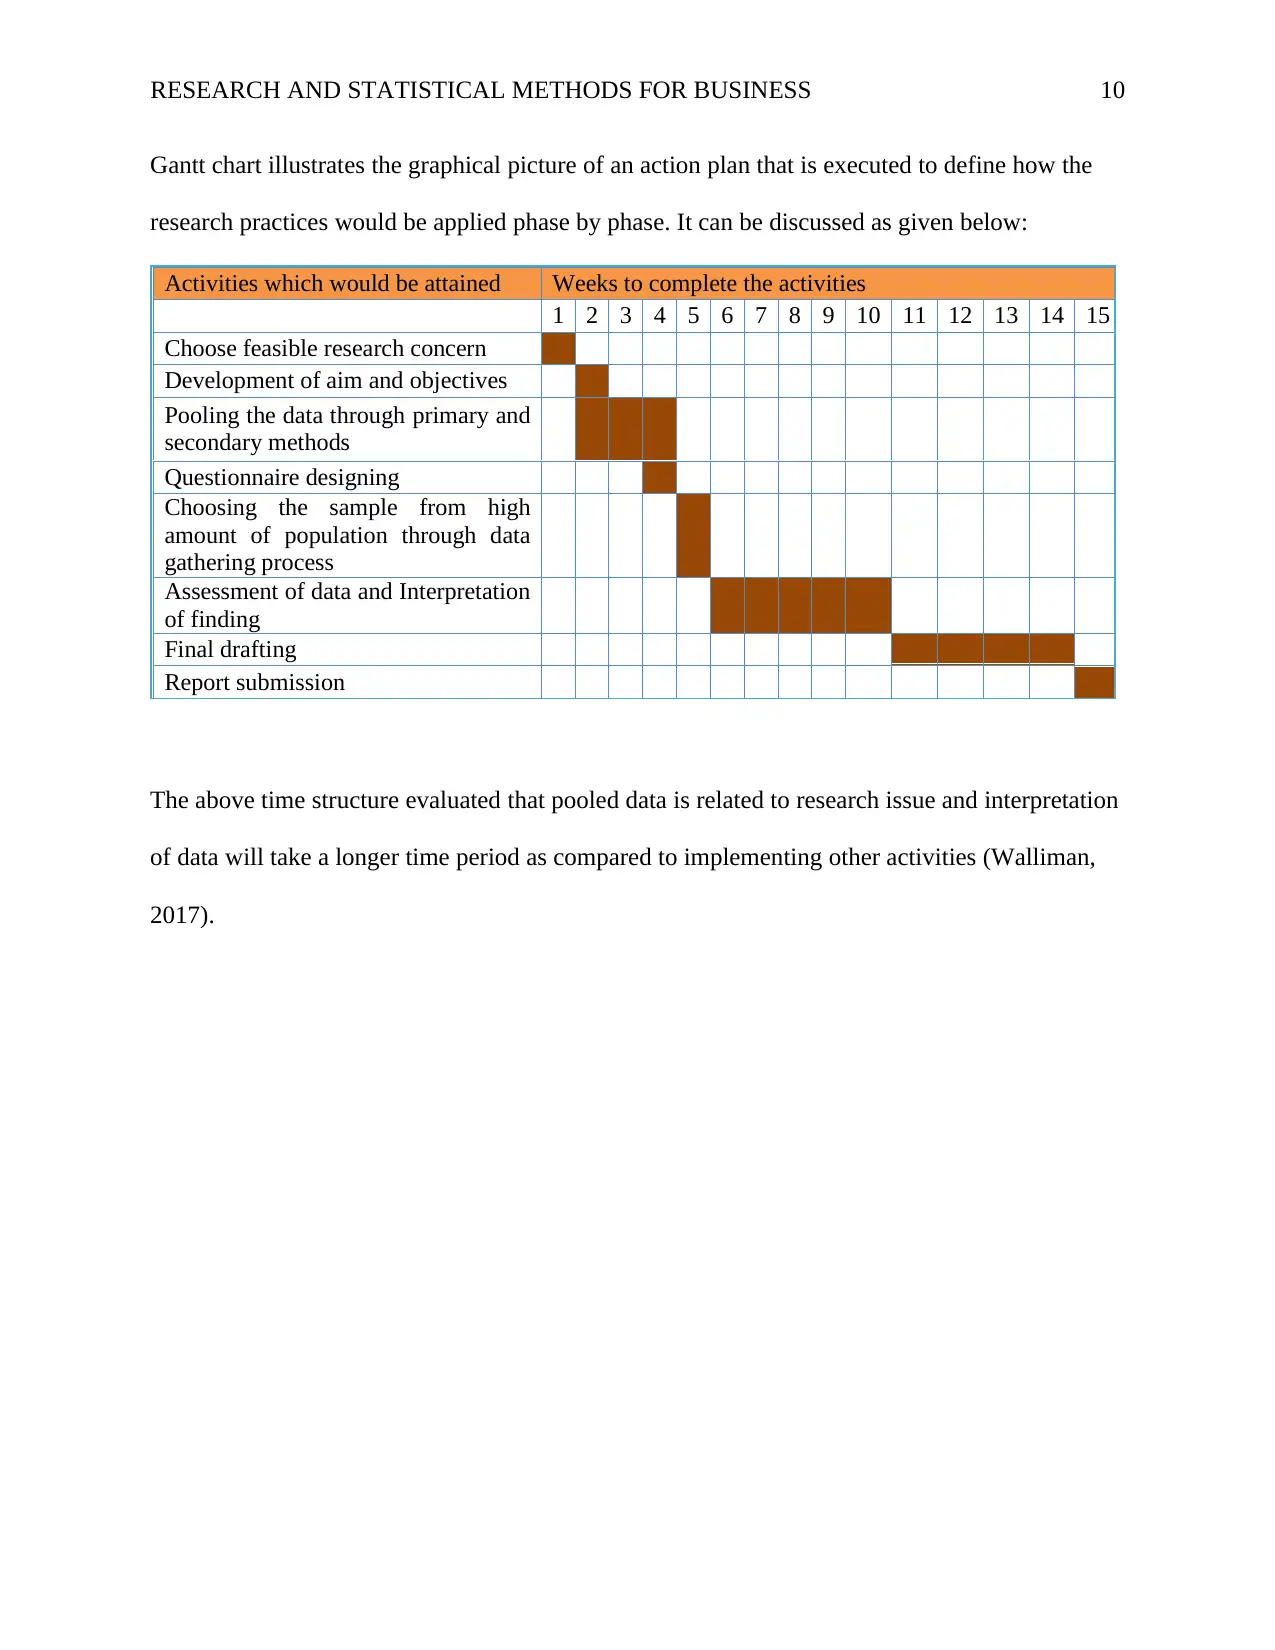
Gantt chart illustrates the graphical picture of an action plan that is executed to define how the
research practices would be applied phase by phase. It can be discussed as given below:
Activities which would be attained Weeks to complete the activities
1 2 3 4 5 6 7 8 9 10 11 12 13 14 15
Choose feasible research concern
Development of aim and objectives
Pooling the data through primary and
secondary methods
Questionnaire designing
Choosing the sample from high
amount of population through data
gathering process
Assessment of data and Interpretation
of finding
Final drafting
Report submission
The above time structure evaluated that pooled data is related to research issue and interpretation
of data will take a longer time period as compared to implementing other activities (Walliman,
2017).
Paraphrase This Document
Need a fresh take? Get an instant paraphrase of this document with our AI Paraphraser
RESEARCH AND STATISTICAL METHODS FOR BUSINESS 11
References
Ashford, S. J., Lee, C., & Bobko, P. (1989). Content, cause, and consequences of job insecurity:
A theory-based measure and substantive test. Academy of Management journal, 32(4),
803-829.
Choy, L. T. (2014). The strengths and weaknesses of research methodology: Comparison and
complementary between qualitative and quantitative approaches. IOSR Journal of
Humanities and Social Science, 19(4), 99-104.
Dang, G., &Pheng, L. S. (2015).Research methodology.In Infrastructure Investments in
Developing Economies (pp. 135-155). Singapore: Springer.
De Witte, H. (2000). Arbeidsethos en jobonzekerheid: meting en gevolgen voor welzijn,
tevredenheid en inzet op het werk. (Work Ethic and Job Insecurity: Measurement and
Consequences for Well-Being, Satisfaction, and Performance at Work).
De Witte, H., De Cuyper, N., Handaja, Y., Sverke, M., Näswall, K., & Hellgren, J. (2010).
Associations between quantitative and qualitative job insecurity and well-being: A test in
Belgian banks. International Studies of Management & Organization, 40(1), 40-56.
Dumay, J., &Cai, L. (2015). Using content analysis as a research methodology for investigating
intellectual capital disclosure: a critique. Journal of Intellectual Capital, 16(1), 121-155.
Flick, U. (2015). Introducing research methodology: A beginner's guide to doing a research
project. UK: Sage.
Glesne, C. (2015). Becoming qualitative researchers: An introduction. UK: Pearson.
In van groep naar gemeenschap, ed. R. Bouwen, K. De Witte, H. De Witte, and T. Taillieu, 325–
350. Leuven: Garant. Goldberg, D. P. (1978). Manual of the General Health
Questionnaire. Windsor, UK: NFER-Nelson.
RESEARCH AND STATISTICAL METHODS FOR BUSINESS 12
Ledford, J. R., & Gast, D. L. (2018). Single case research methodology: Applications in special
education and behavioral sciences. UK: Routledge.
Lewis, S. (2015). Qualitative inquiry and research design: Choosing among five
approaches. Health promotion practice, 16(4), 473-475.
Mackey, A., &Gass, S. M. (2015). Second language research: Methodology and design. UK:
Routledge.
McCusker, K., &Gunaydin, S. (2015). Research using qualitative, quantitative or mixed methods
and choice based on the research. Perfusion, 30(7), 537-542.
Neuman, W. L. (2016). Understanding research. Pearson.
Reynolds, D., Creemers, B., Nesselrodt, P. S., Shaffer, E. C., Stringfield, S., &Teddlie, C. (Eds.).
(2014). Advances in school effectiveness research and practice. USA: Elsevier.
Silverman, D. (Ed.). (2016). Qualitative research. UK: Sage.
Smith, J. A. (Ed.). (2015). Qualitative psychology: A practical guide to research methods. UK:
Sage.
Taylor, S. J., Bogdan, R., &DeVault, M. (2015). Introduction to qualitative research methods: A
guidebook and resource. USA: John Wiley & Sons.
Walliman, N. (2017). Research methods: The basics. UK: Routledge.
Wiek, A., & Lang, D. J. (2016).Transformational sustainability research
methodology.In Sustainability Science (pp. 31-41). Dordrecht: Springer.
⊘ This is a preview!⊘
Do you want full access?
Subscribe today to unlock all pages.
Trusted by 1+ million students worldwide
1 out of 12
Related Documents


Your All-in-One AI-Powered Toolkit for Academic Success.
+13062052269
info@desklib.com
Available 24*7 on WhatsApp / Email
![[object Object]](/_next/static/media/star-bottom.7253800d.svg)
Unlock your academic potential
Copyright © 2020–2026 A2Z Services. All Rights Reserved. Developed and managed by ZUCOL.