LC572: Analyzing Quantitative Research Methods in Social Science

Verified

Added on  2023/06/12

|10
|1619
|448
Report
AI Summary
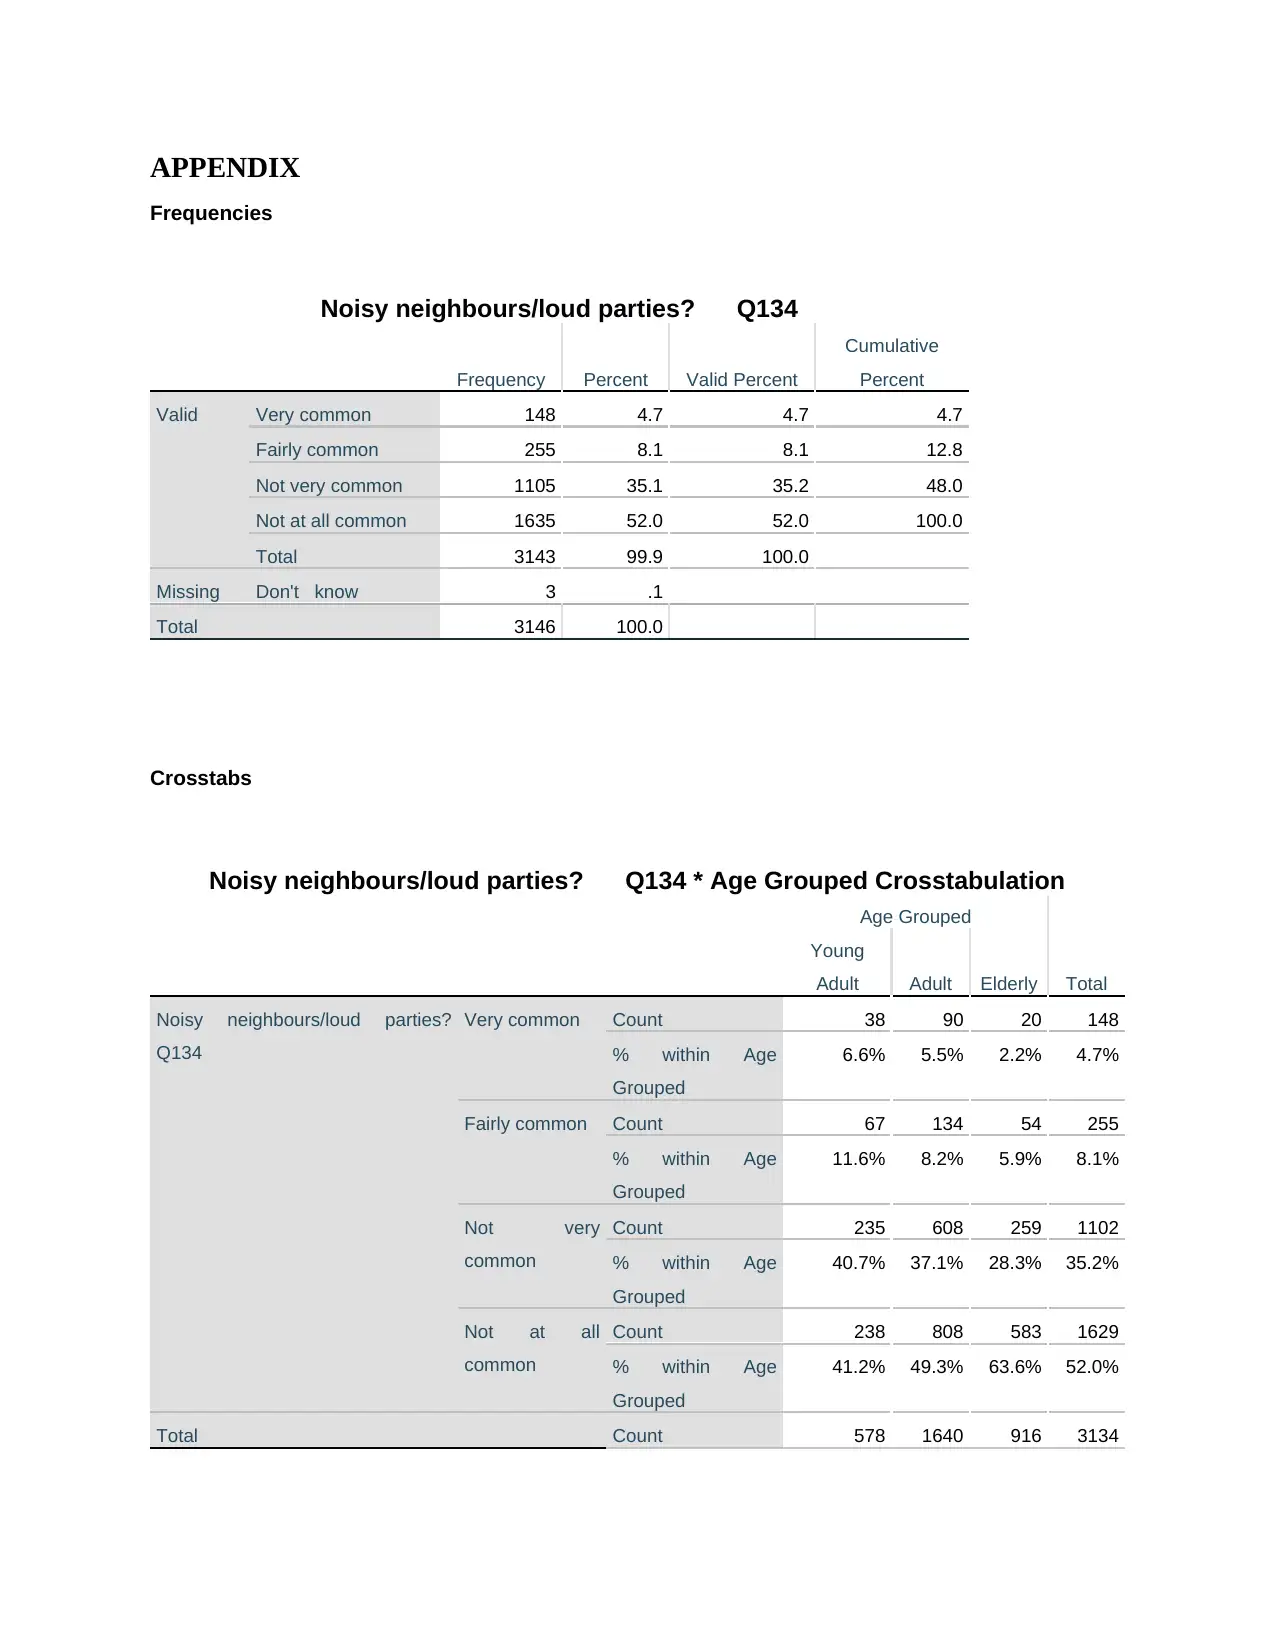
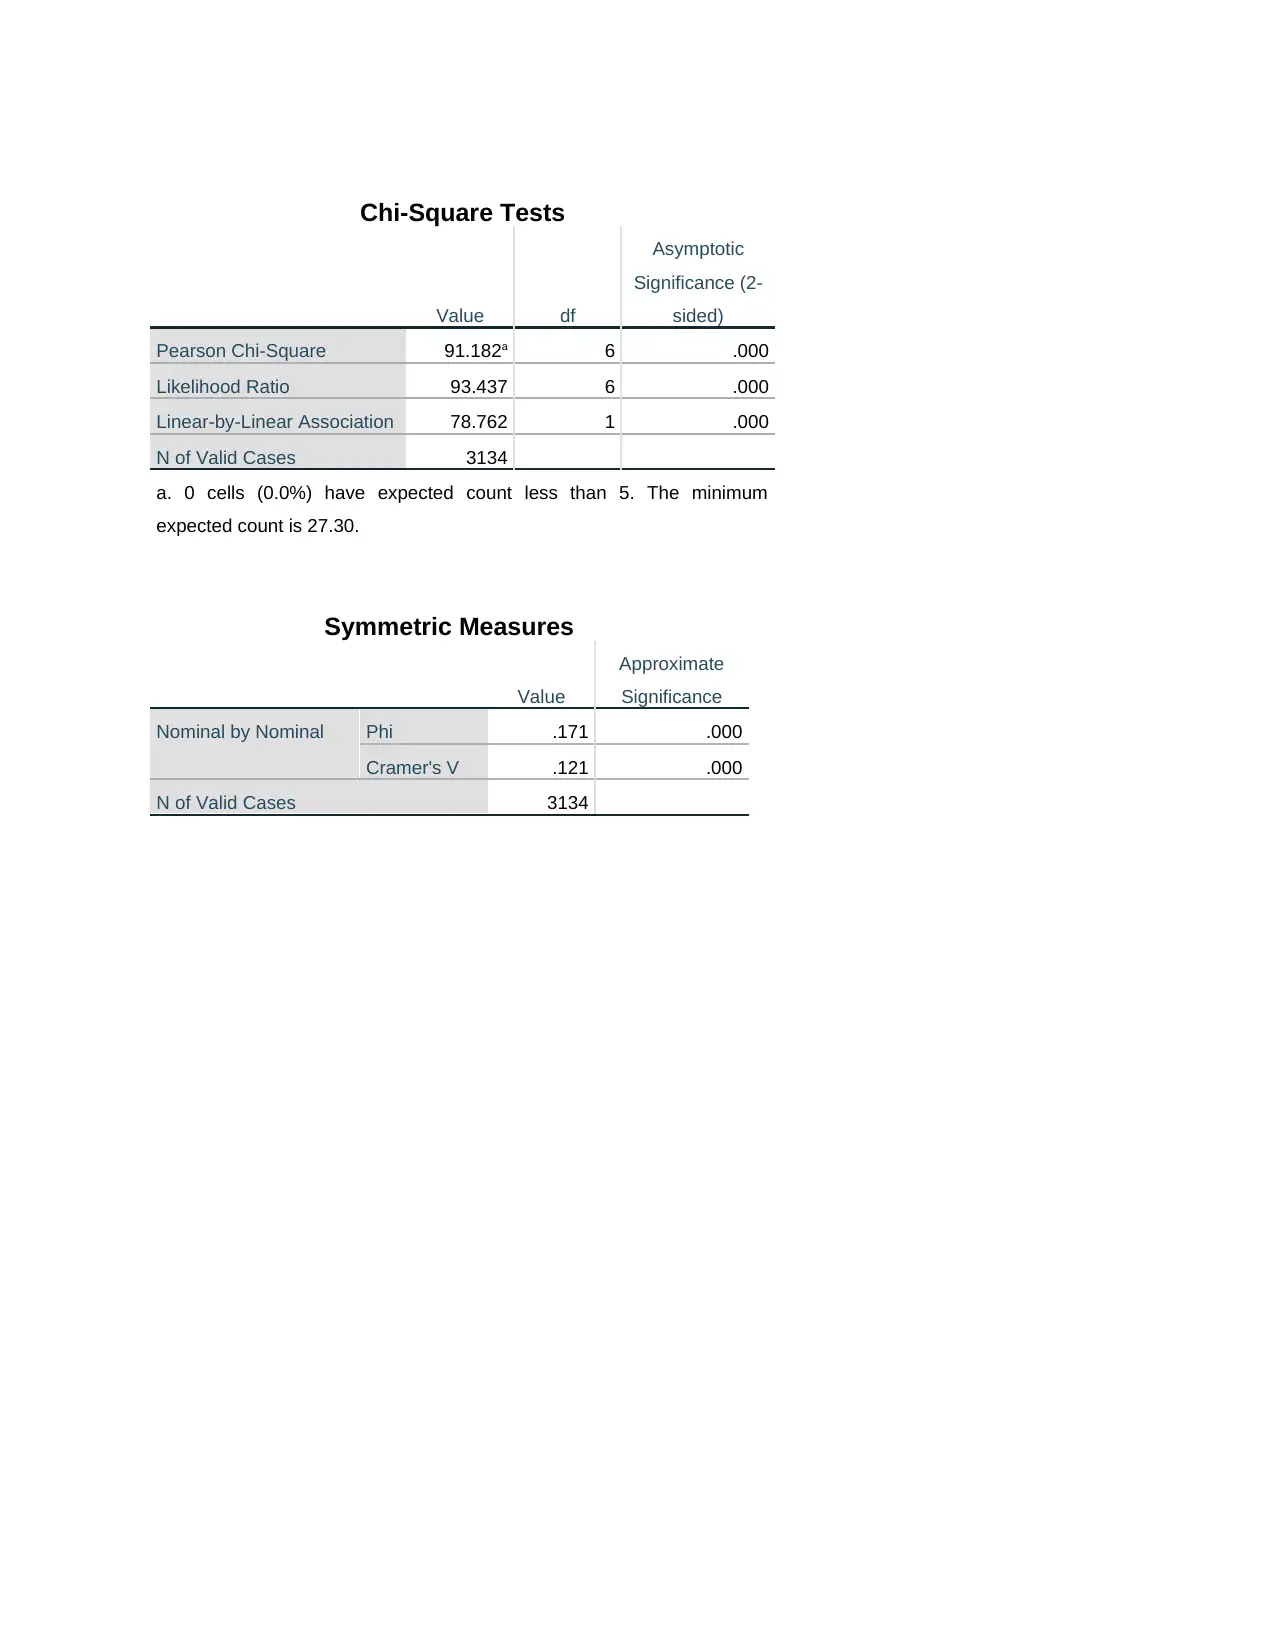
This report provides a comprehensive overview of quantitative research methods for social scientists. It identifies and explains the four levels of measurement (nominal, ordinal, interval, and ratio) with examples. The report also details measures of central tendency (mean, median, mode) and dispersion, differentiating between descriptive and inferential statistics. Key statistical terms such as hypothesis, null hypothesis, independent, dependent, and extraneous variables are explained. Furthermore, the report includes an interpretation of SPSS output, specifically frequency tables and cross-tabulations, to analyze the relationship between noisy neighborhoods and age groups, using chi-square tests and Phi/Cramer's V to assess the strength of association. The analysis concludes that while a statistically significant relationship exists, the association between the variables is negligible. Desklib provides access to this document and many other resources for students.
tabler-icon-diamond-filled.svg

Contribute Materials

Your contribution can guide someone’s learning journey. Share your documents today.
Document Page
Quantitative Research
Methods for Social Scientists
tabler-icon-diamond-filled.svg

Secure Best Marks with AI Grader

Need help grading? Try our AI Grader for instant feedback on your assignments.
Document Page
TABLE OF CONTENT
INTRODUCTION...........................................................................................................................3
Four levels of measurement.........................................................................................................3
Measures of central tendency and measure of dispersion...........................................................3
Difference between descriptive statistics and inferential statistics..............................................4
Explaining some terms................................................................................................................4
Providing interpretation based on SPSS output...........................................................................5
CONCLUSION................................................................................................................................5
REFERENCES................................................................................................................................7
APPENDIX......................................................................................................................................8
Document Page
INTRODUCTION
The quantitative research is being defined as the research which includes the use of
numeric facts and figures relating to the problem. The use of numeric information provides for
better and accurate result relating to the area of study. The current study will outline the different
level of measurement and tools of central tendency and dispersion. Along with this the different
within inferential and descriptive statistics will be outlined along with interpretation of some
result.
Four levels of measurement
For the measurement of different types of the data there are different scales being present.
These scales assist the company in evaluating the measurement. These measurement scale
involves-
ï‚· Nominal scale- this type of scale involves dividing the data by labelling them within
mutually exclusive group which are not in order (Liamputtong, ed., 2019). The example
of this scale can involve data relating to gender, ethnicity and others.
ï‚· Ordinal scale- this is another type of scale wherein the person ranks the data in some
order which can be any increasing or decreasing. The example can include ability of
language like beginner, intermediate and fluent.
ï‚· Interval scale- this type of scale involves the data which is divided into the interval within
the neighbouring data point. For example, this can include the temperature that is in
Fahrenheit or Celsius or test scores like IQ level and others.
ï‚· Ratio scale- this is a type of scale which is based on equal interval but this includes the
true zero point. This true zero means that there is absence of variable of interest. The
example include weight, height and others.
Document Page
Measures of central tendency and measure of dispersion
The measures of central tendency are being referred to as single value which describe the
data relating to the central position. This is very essential for the reason that when the single
value is identified then it represents the entire distribution effectively. Hence this provides a
proper description relating to the whole data and the single value is assistive in comparing the
data with others as well (Stockemer, Stockemer and Glaeser, 2019). This measure of central
tendency involves three different tools that is mean, median and mode. All these three tools
provide the central value of whole data set.
In addition to this, there is also the use of measured of dispersion which assist the
researcher to find out the scattering of the data. The reason underlying this fact is that it outlines
the disparity among the data set that is how much the data is deviating from the other values.
This outlines the variation being present in the whole data set.
Difference between descriptive statistics and inferential statistics
Descriptive statistics Inferential statistics
It is a branch of statistics which relates with
analysing and describing the population under
the study.
Whereas this type of statistics involves
focusing on drawing of conclusion relating to
the population.
This involves analysis of charts, graphs and
tables.
It includes the analysis on the basis of use of
probability.
This includes the description of the situation This includes the explanation relating to the
occurrence of the event.
Explaining some terms
Hypothesis and null hypothesis
The hypothesis is being referred to as the proposed explanation which is made on the
basis of the limited evidence for developing the whole research on that basis only (Sovacool,
Axsen and Sorrell, 2018). On the other hand, the null hypothesis is the statement which outlines
the fact that there is not any relation being present within the specified variables or sample which
is being researched.
Independent and dependent variable
tabler-icon-diamond-filled.svg

Secure Best Marks with AI Grader

Need help grading? Try our AI Grader for instant feedback on your assignments.
Document Page
The independent variable is the one which is being changed or manipulated by the
experimenter (Abutabenjeh and Jaradat, 2018). This variable is the cause for the study to be
done. on the contradictory note the dependent variable is the one which is being tested and
measured in the whole experiment and also this variable is dependent over the changes in
independent variable.
Extraneous variable
This is a type of variable which is not being investigated within the study but has the
potential of affecting the outcome of the whole study. This is uncontrollable but it can affect the
working efficiency of the study in a great manner.
Providing interpretation based on SPSS output
Frequency table
With the analysis of the frequency table it is clear that majority of people that is 52%
states that it is not at all common that people like the noisy neighbour. Also, 35% stated that it is
not very common to have loud parties and 8.1 % states that it is fairly common and remaining
4.7 % stated the it is very common to have noisy neighbourhood.
Cross tabulation
By evaluating the cross- tabulation it is clear that out of different age group, maximum
elderly people states that it is not at all common for the people to have noisy neighbourhood.
Along with this, in case of not very common young adult is the base which majorly states that
noisy neighbour is present (Rose and Johnson, 2020). Also, for fairly common majority involves
young adult and for very common as well young adult is the one who states that it is very
common that there are loud parties present.
Chi- square
With the help of the chi- square it is inferred that the significance value is 0.000 which
implies that alternate hypothesis is accepted as the value is less than standard 0.05. with this it
can be stated that the hypothesis that there is relation between noisy neighbourhood is present.
Phi/ cramer V
With the analysis of the phi and cramer V it is clear that phi is 0.171 and this states that
association between the two variables is no or negligible as it is very low. On the other hand,
Cramer V is 0.121 which also implies that association within the variables is very low or
negligible.
Document Page
CONCLUSION
In the end it is concluded that the use of the quantitative research is very necessary as it
provides for better outcome as it is based on numeric information. The above analysis stated that
different measurement scale involves nominal, ordinal and others. Along with this, it was
outlined that central tendency involves mean, median and mode and dispersion involves standard
deviation.
Document Page
REFERENCES
Books and journals
Abutabenjeh, S. and Jaradat, R., 2018. Clarification of research design, research methods, and
research methodology: A guide for public administration researchers and
practitioners. Teaching Public Administration. 36(3). pp.237-258.
Liamputtong, P. ed., 2019. Handbook of research methods in health social sciences. Singapore::
Springer.
Rose, J. and Johnson, C.W., 2020. Contextualizing reliability and validity in qualitative research:
toward more rigorous and trustworthy qualitative social science in leisure
research. Journal of Leisure Research. 51(4). pp.432-451.
Sovacool, B.K., Axsen, J. and Sorrell, S., 2018. Promoting novelty, rigor, and style in energy
social science: Towards codes of practice for appropriate methods and research
design. Energy Research & Social Science. 45. pp.12-42.
Stockemer, D., Stockemer, G. and Glaeser, 2019. Quantitative methods for the social
sciences (Vol. 50, p. 185). Quantitative methods for the social sciences: Springer
International Publishing.
tabler-icon-diamond-filled.svg

Paraphrase This Document

Need a fresh take? Get an instant paraphrase of this document with our AI Paraphraser
Document Page
APPENDIX
Frequencies
Noisy neighbours/loud parties? Q134
Frequency Percent Valid Percent
Cumulative
Percent
Valid Very common 148 4.7 4.7 4.7
Fairly common 255 8.1 8.1 12.8
Not very common 1105 35.1 35.2 48.0
Not at all common 1635 52.0 52.0 100.0
Total 3143 99.9 100.0
Missing Don't know 3 .1
Total 3146 100.0
Crosstabs
Noisy neighbours/loud parties? Q134 * Age Grouped Crosstabulation
Age Grouped
Total
Young
Adult Adult Elderly
Noisy neighbours/loud parties?
Q134
Very common Count 38 90 20 148
% within Age
Grouped
6.6% 5.5% 2.2% 4.7%
Fairly common Count 67 134 54 255
% within Age
Grouped
11.6% 8.2% 5.9% 8.1%
Not very
common
Count 235 608 259 1102
% within Age
Grouped
40.7% 37.1% 28.3% 35.2%
Not at all
common
Count 238 808 583 1629
% within Age
Grouped
41.2% 49.3% 63.6% 52.0%
Total Count 578 1640 916 3134
Document Page
% within Age
Grouped
100.0% 100.0% 100.0% 100.0%
Document Page
Chi-Square Tests
Value df
Asymptotic
Significance (2-
sided)
Pearson Chi-Square 91.182a 6 .000
Likelihood Ratio 93.437 6 .000
Linear-by-Linear Association 78.762 1 .000
N of Valid Cases 3134
a. 0 cells (0.0%) have expected count less than 5. The minimum
expected count is 27.30.
Symmetric Measures
Value
Approximate
Significance
Nominal by Nominal Phi .171 .000
Cramer's V .121 .000
N of Valid Cases 3134
chevron_up_icon
1 out of 10
circle_padding
hide_on_mobile
zoom_out_icon
logo.png

Your All-in-One AI-Powered Toolkit for Academic Success.

Available 24*7 on WhatsApp / Email

[object Object]