Statistics and Research Methods in Business Decision Making Report

Verified

Added on  2022/10/18

|11
|782
|20
Report
AI Summary
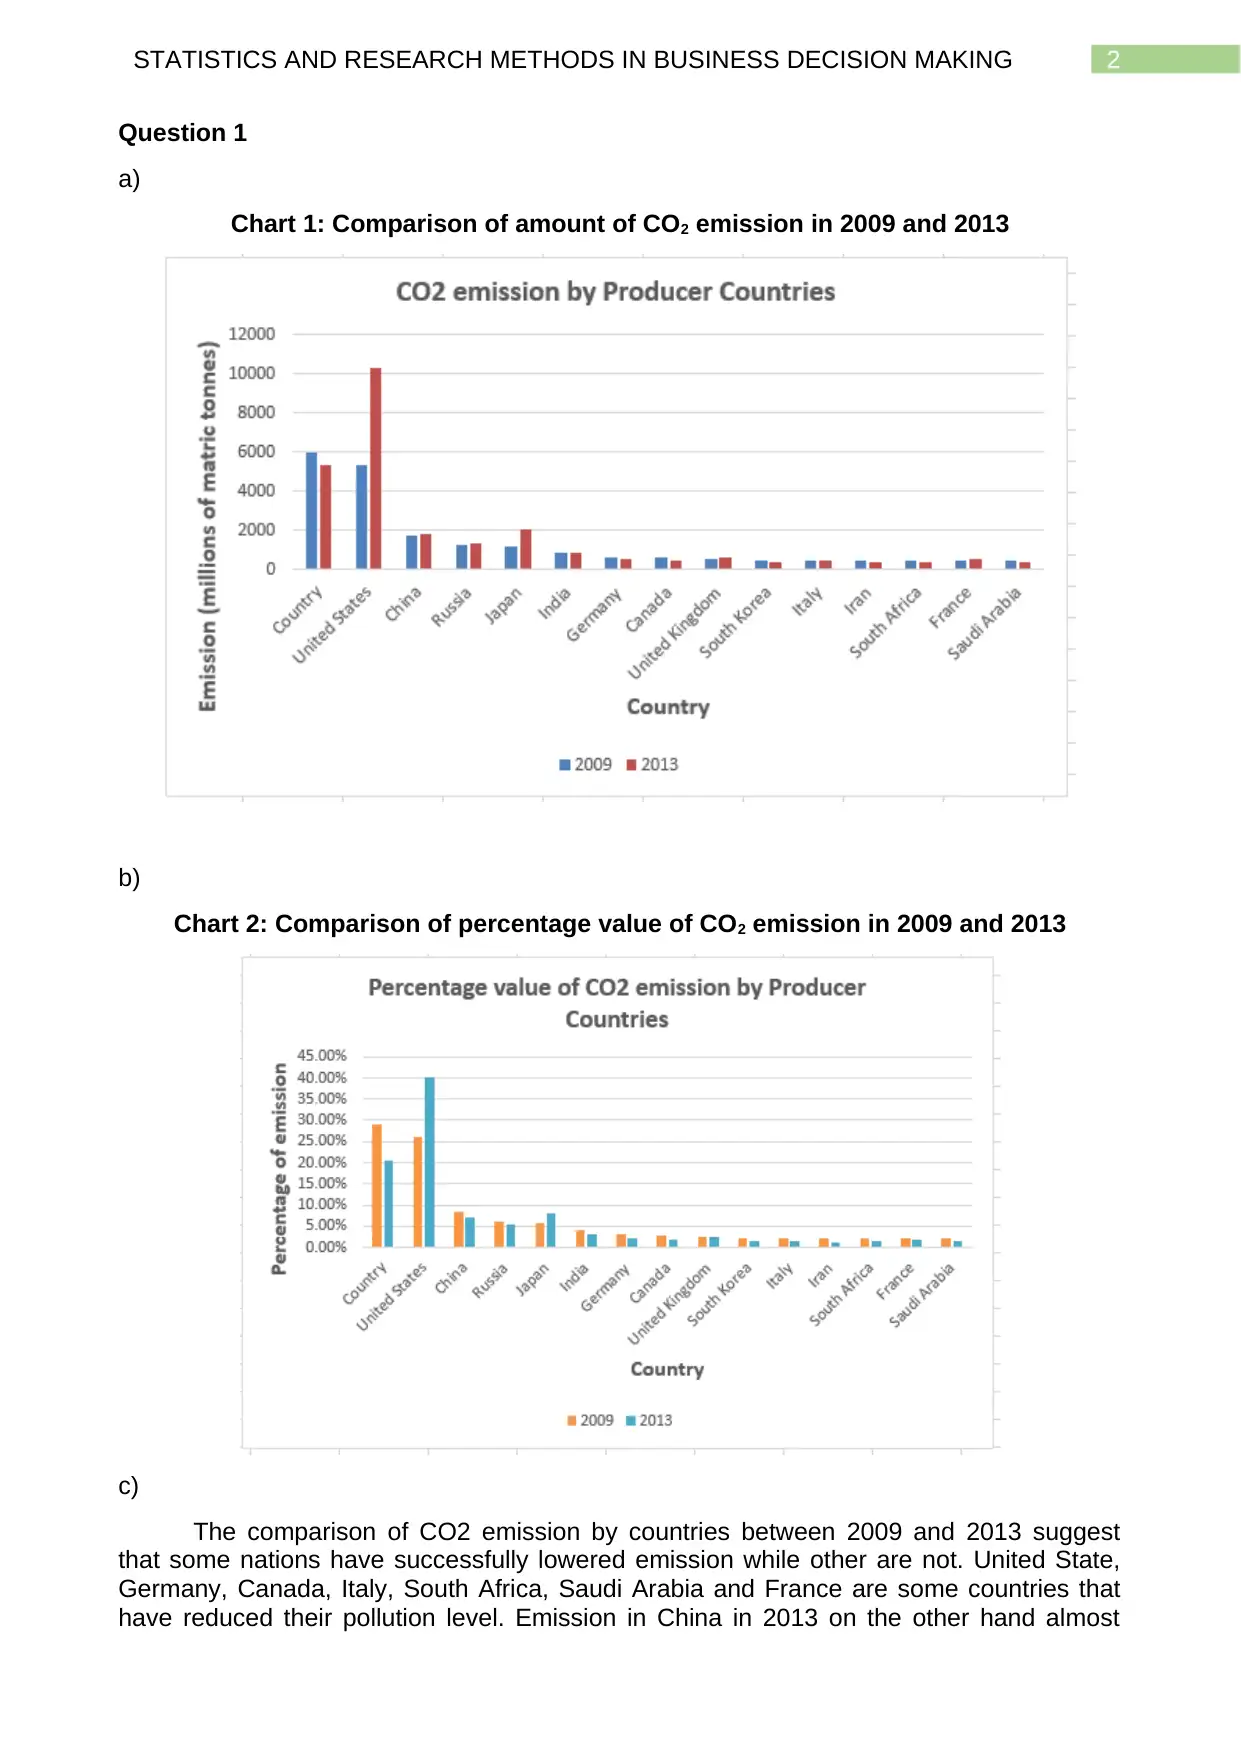
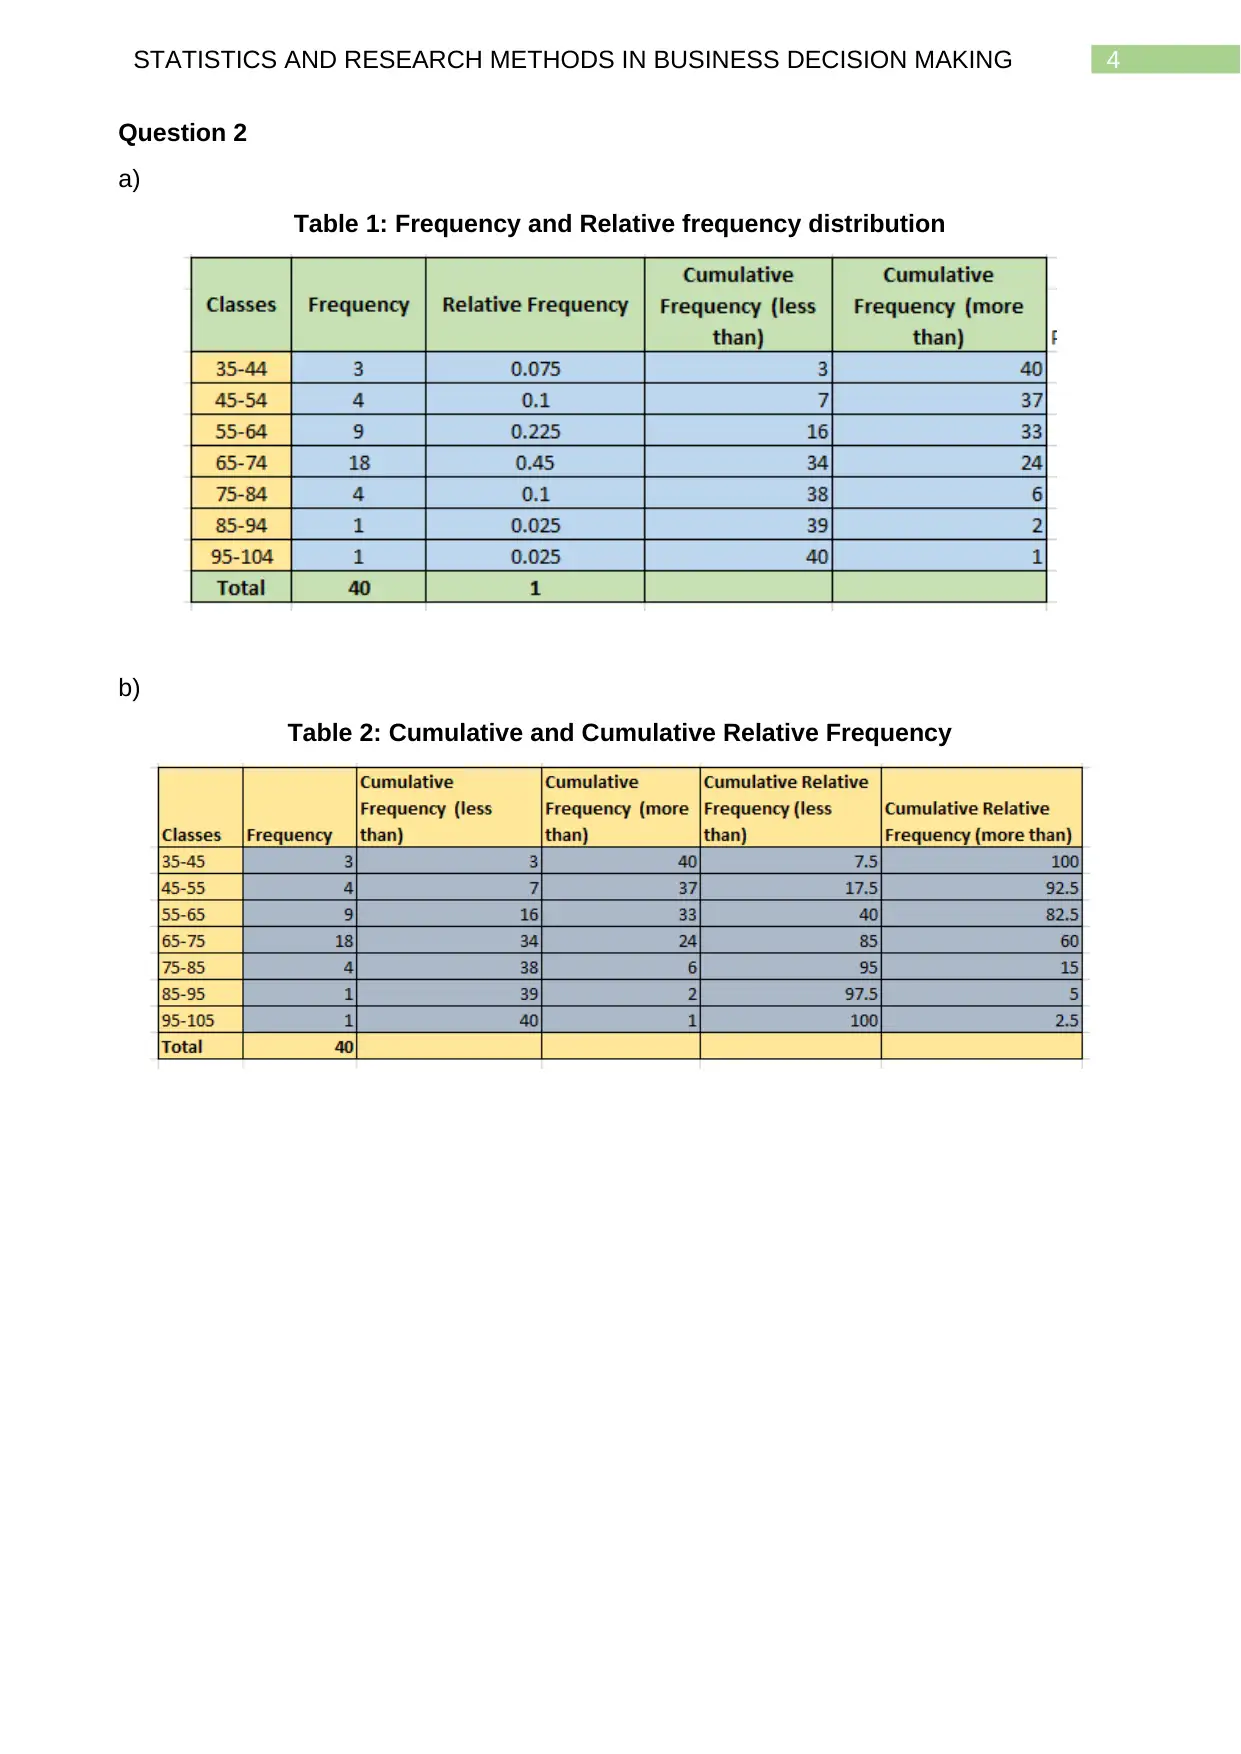
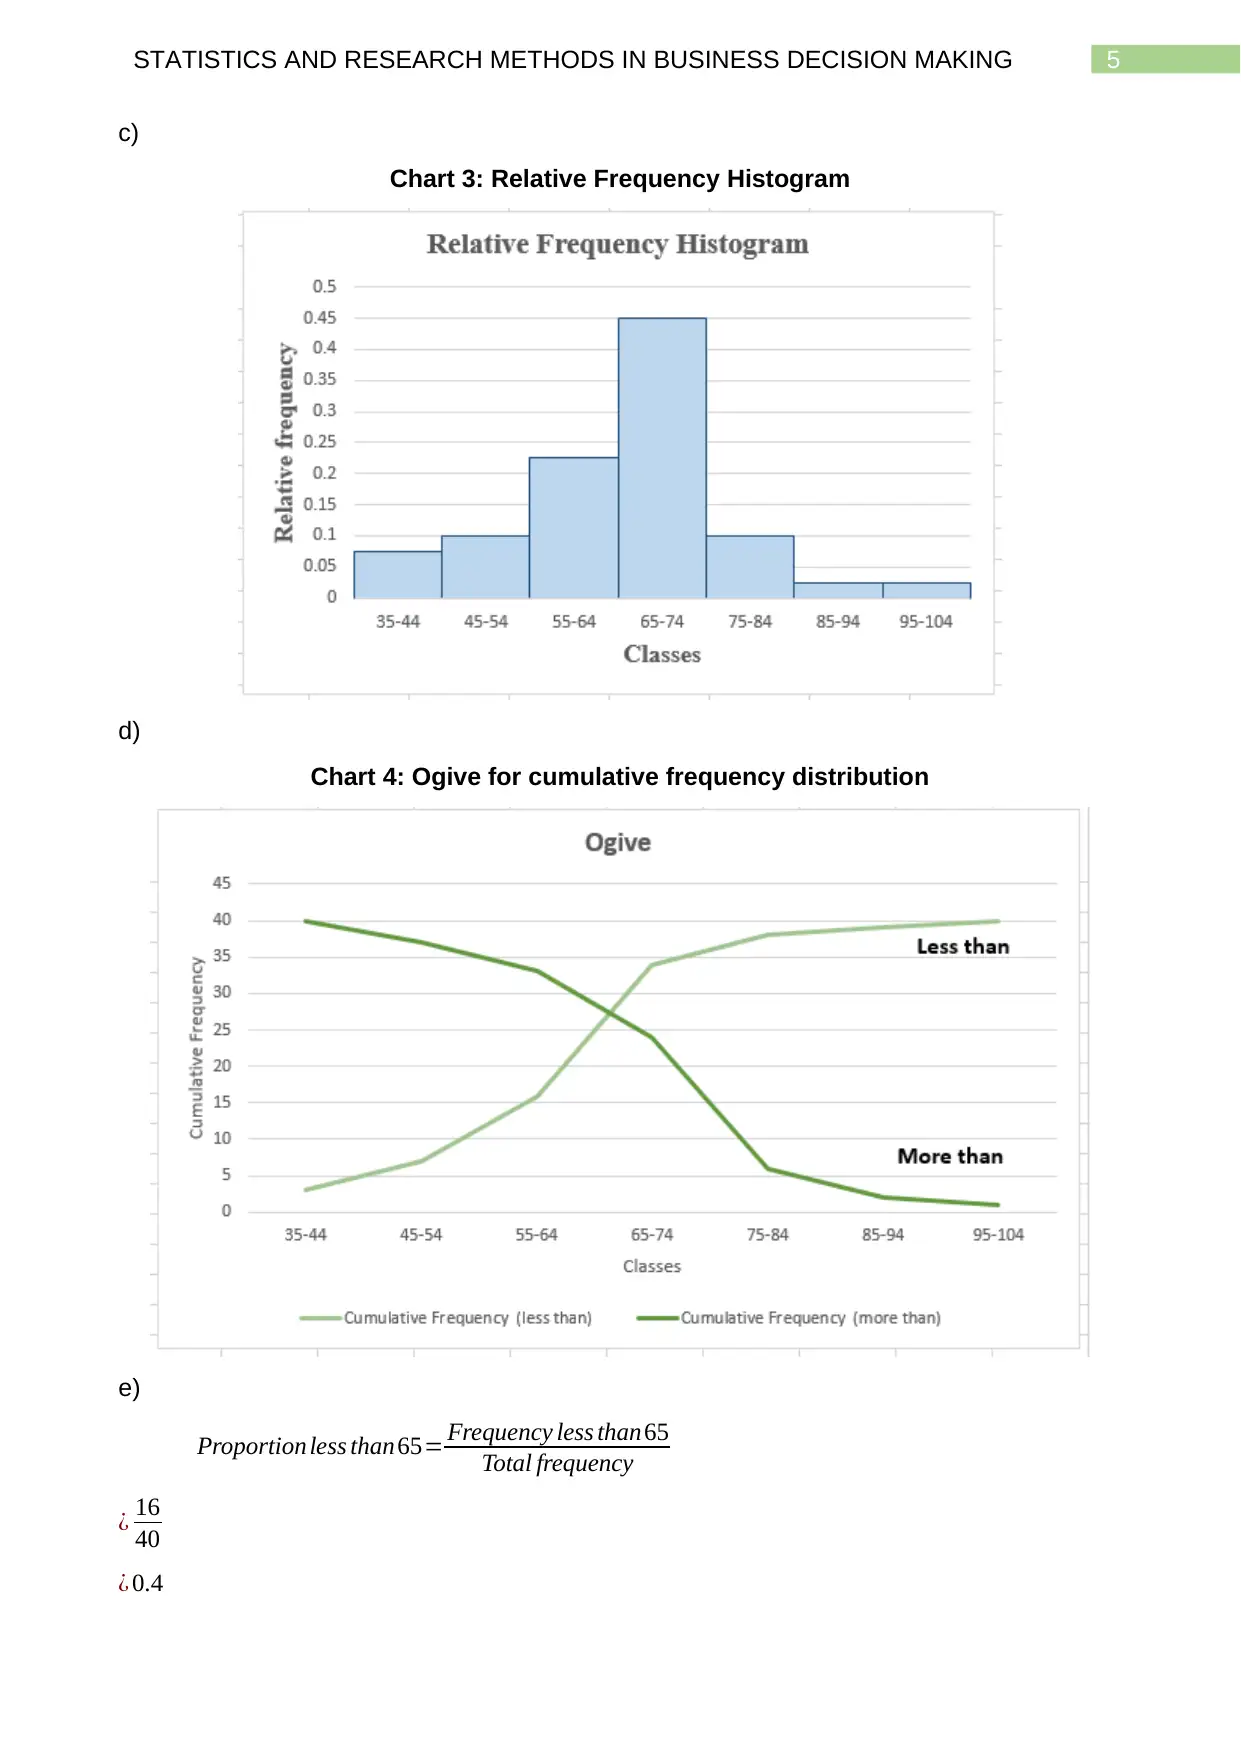
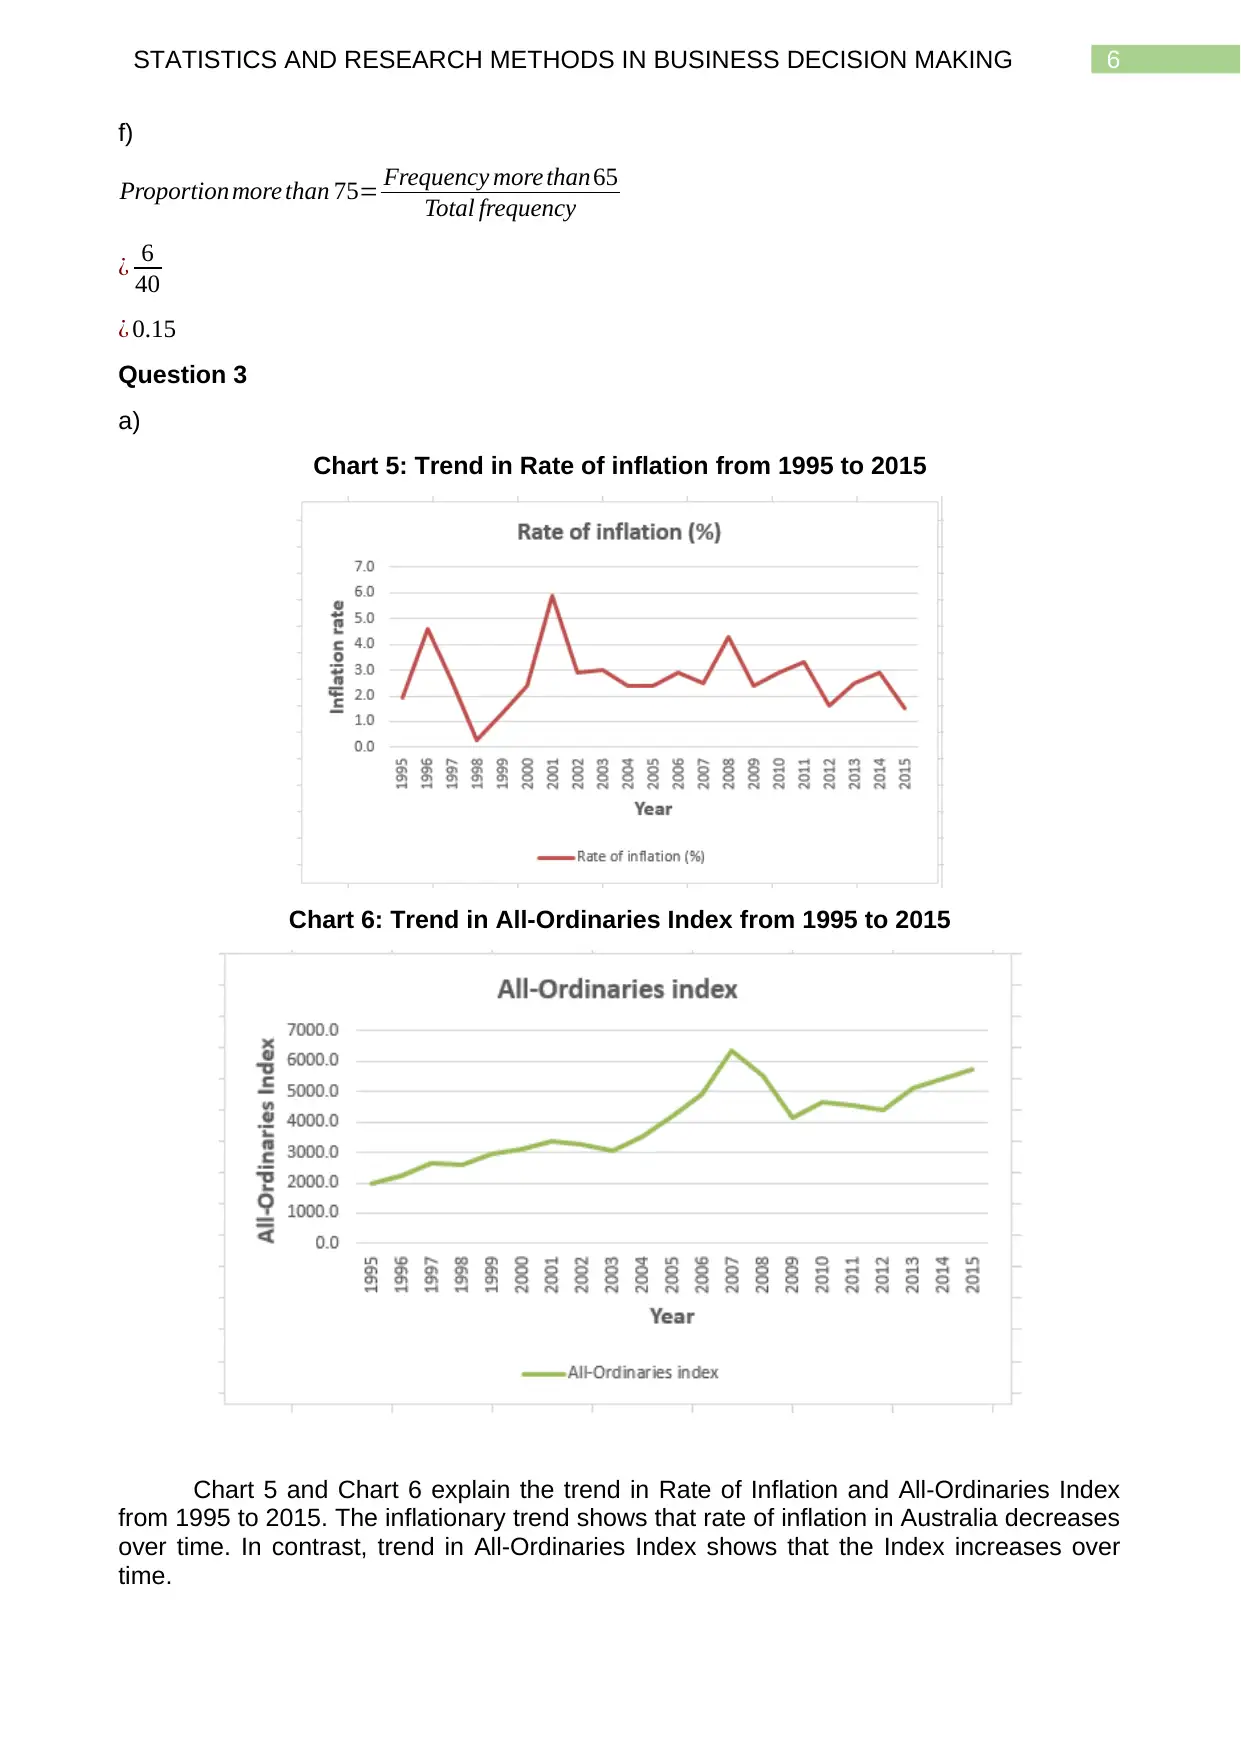
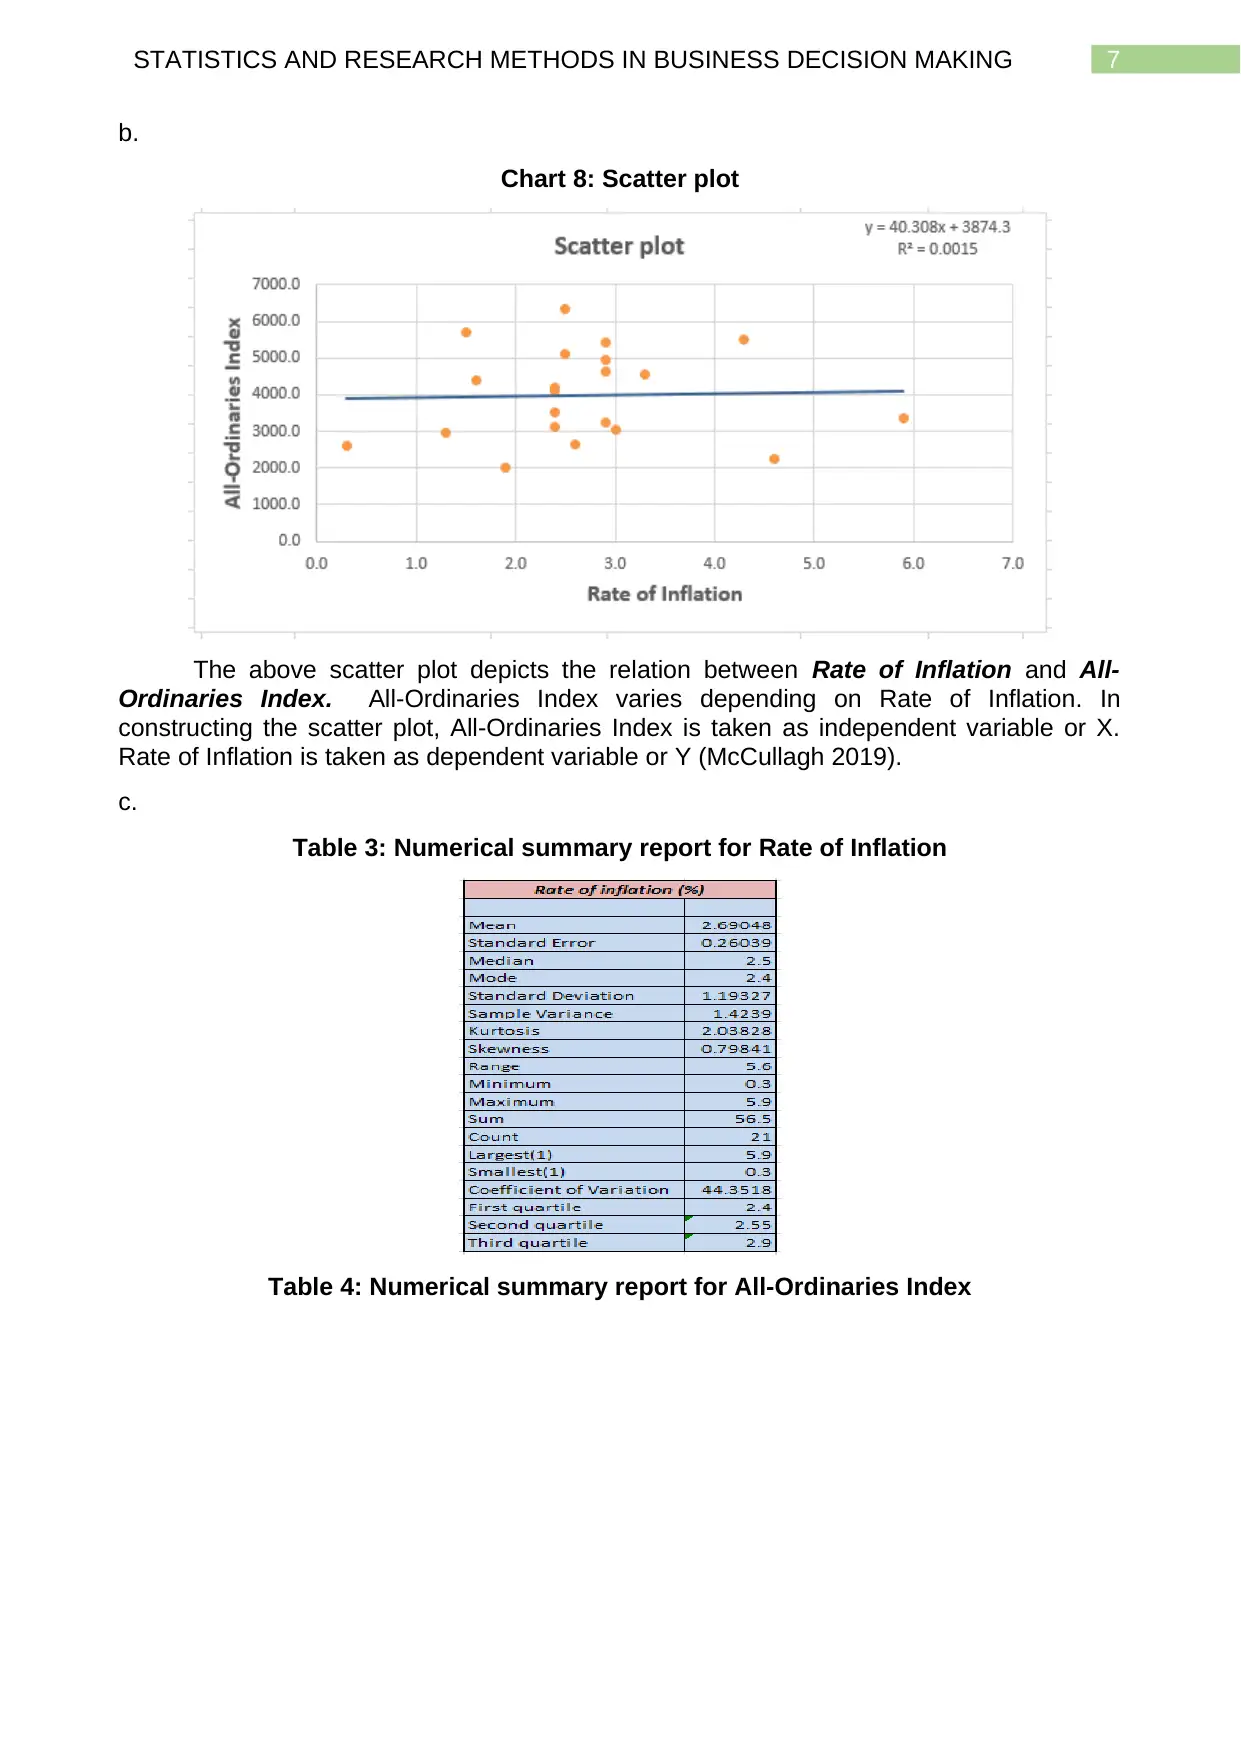
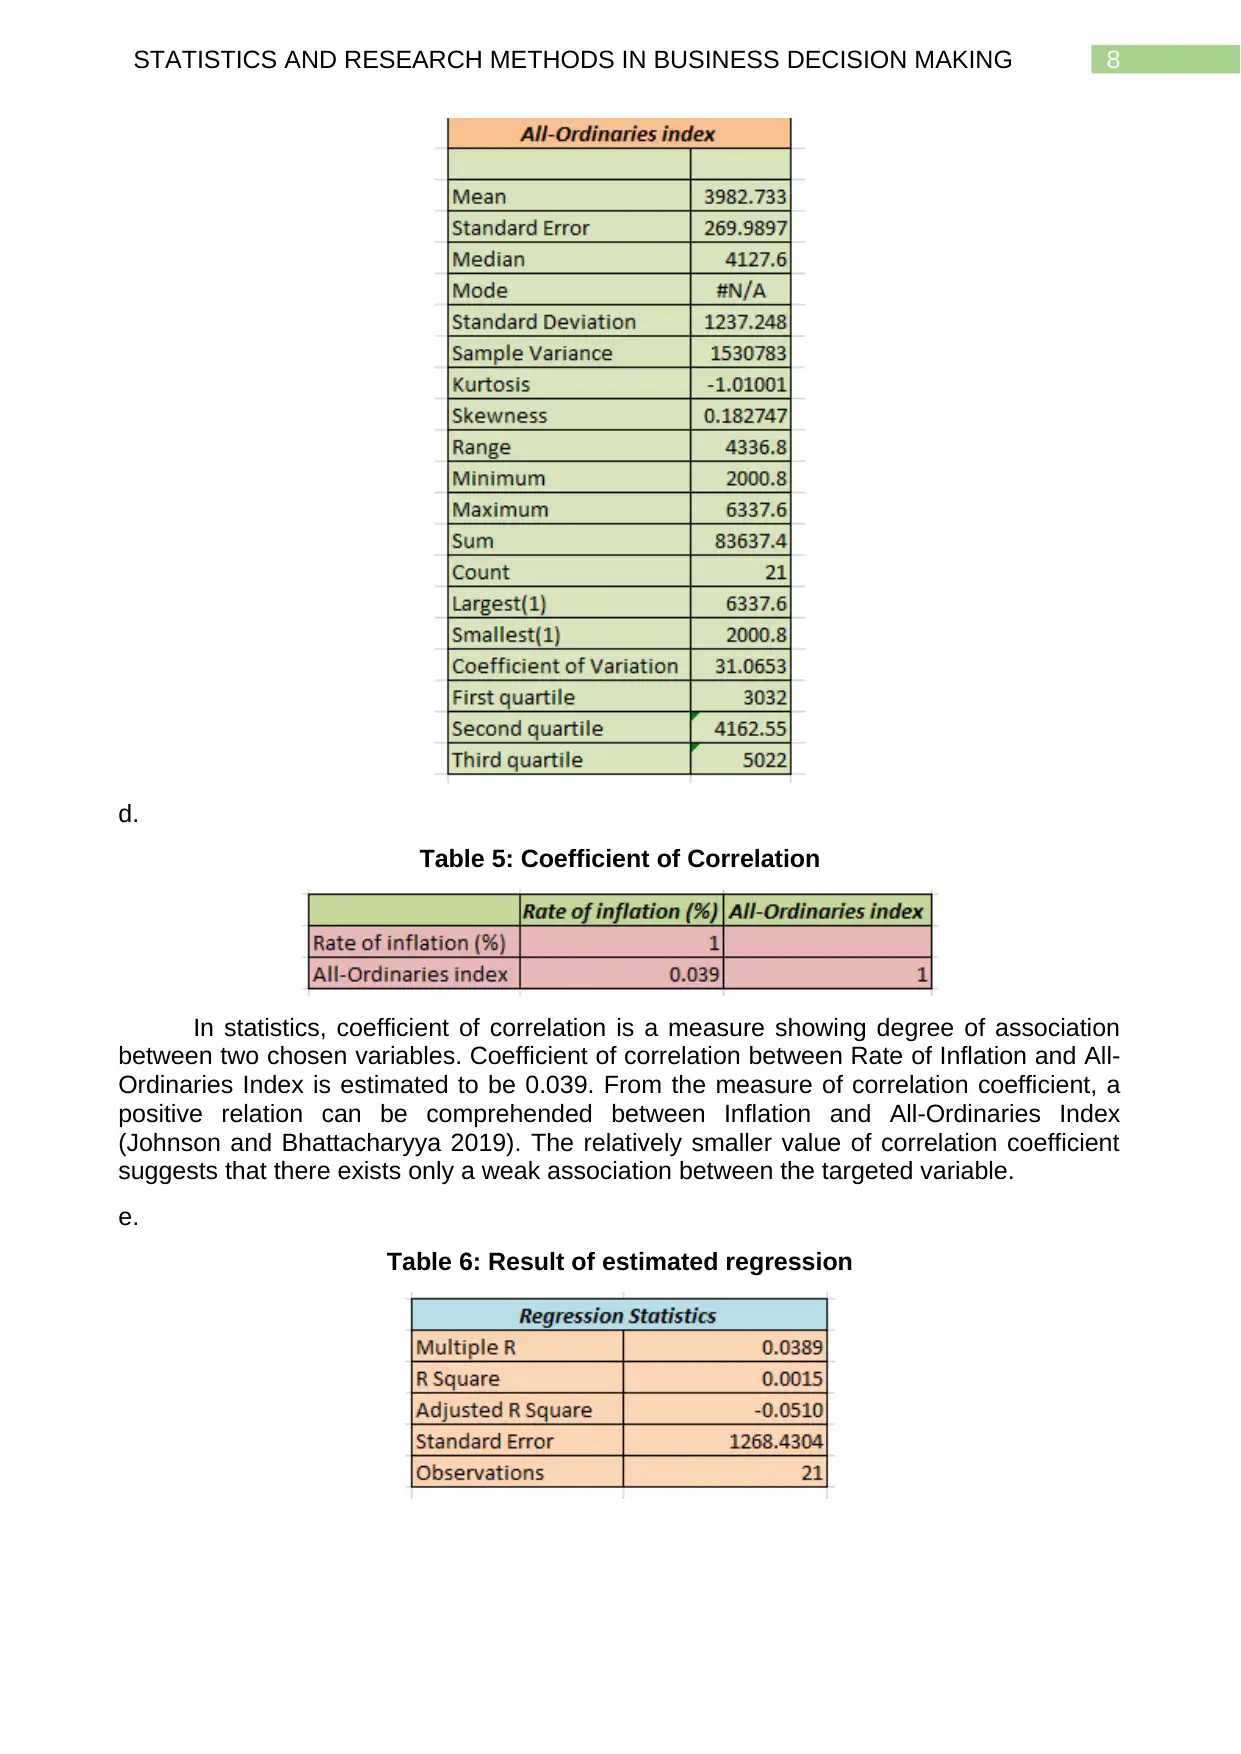
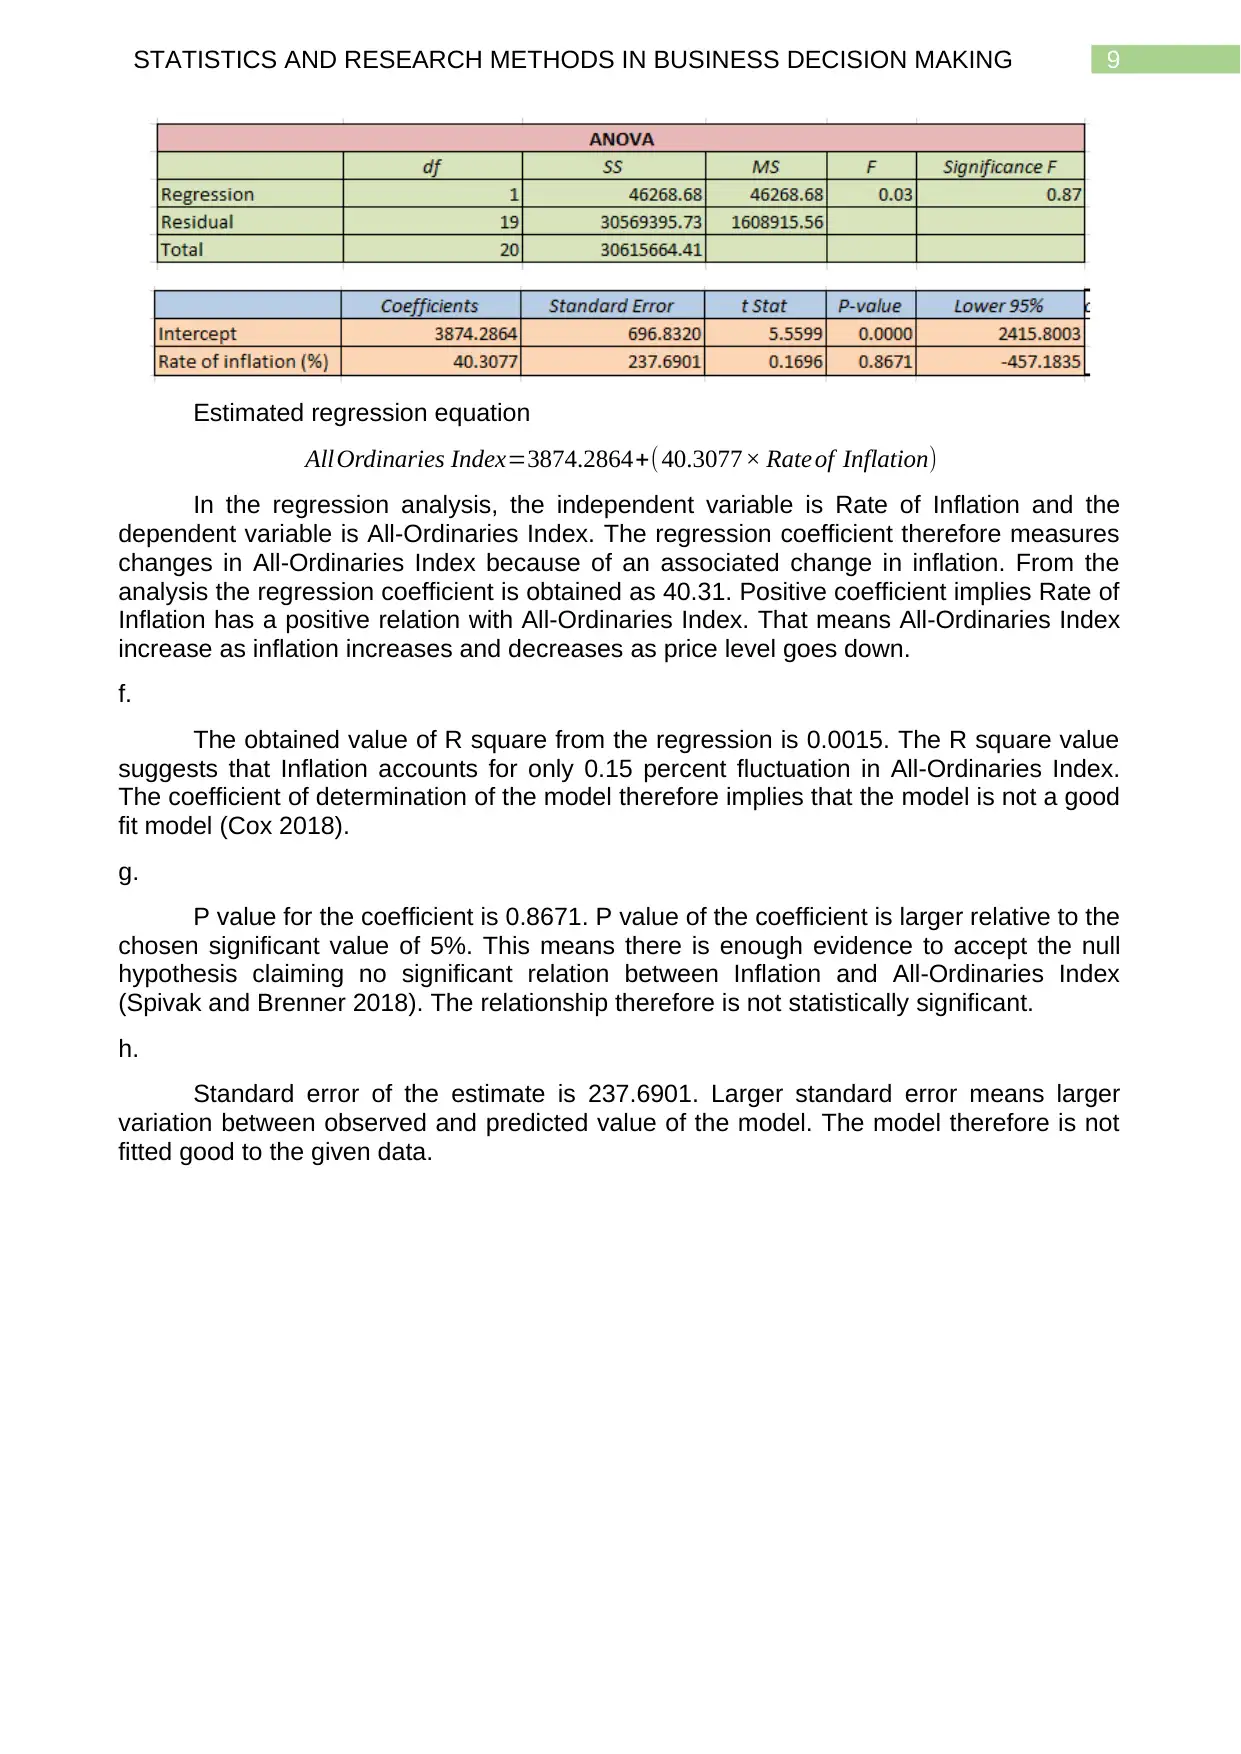
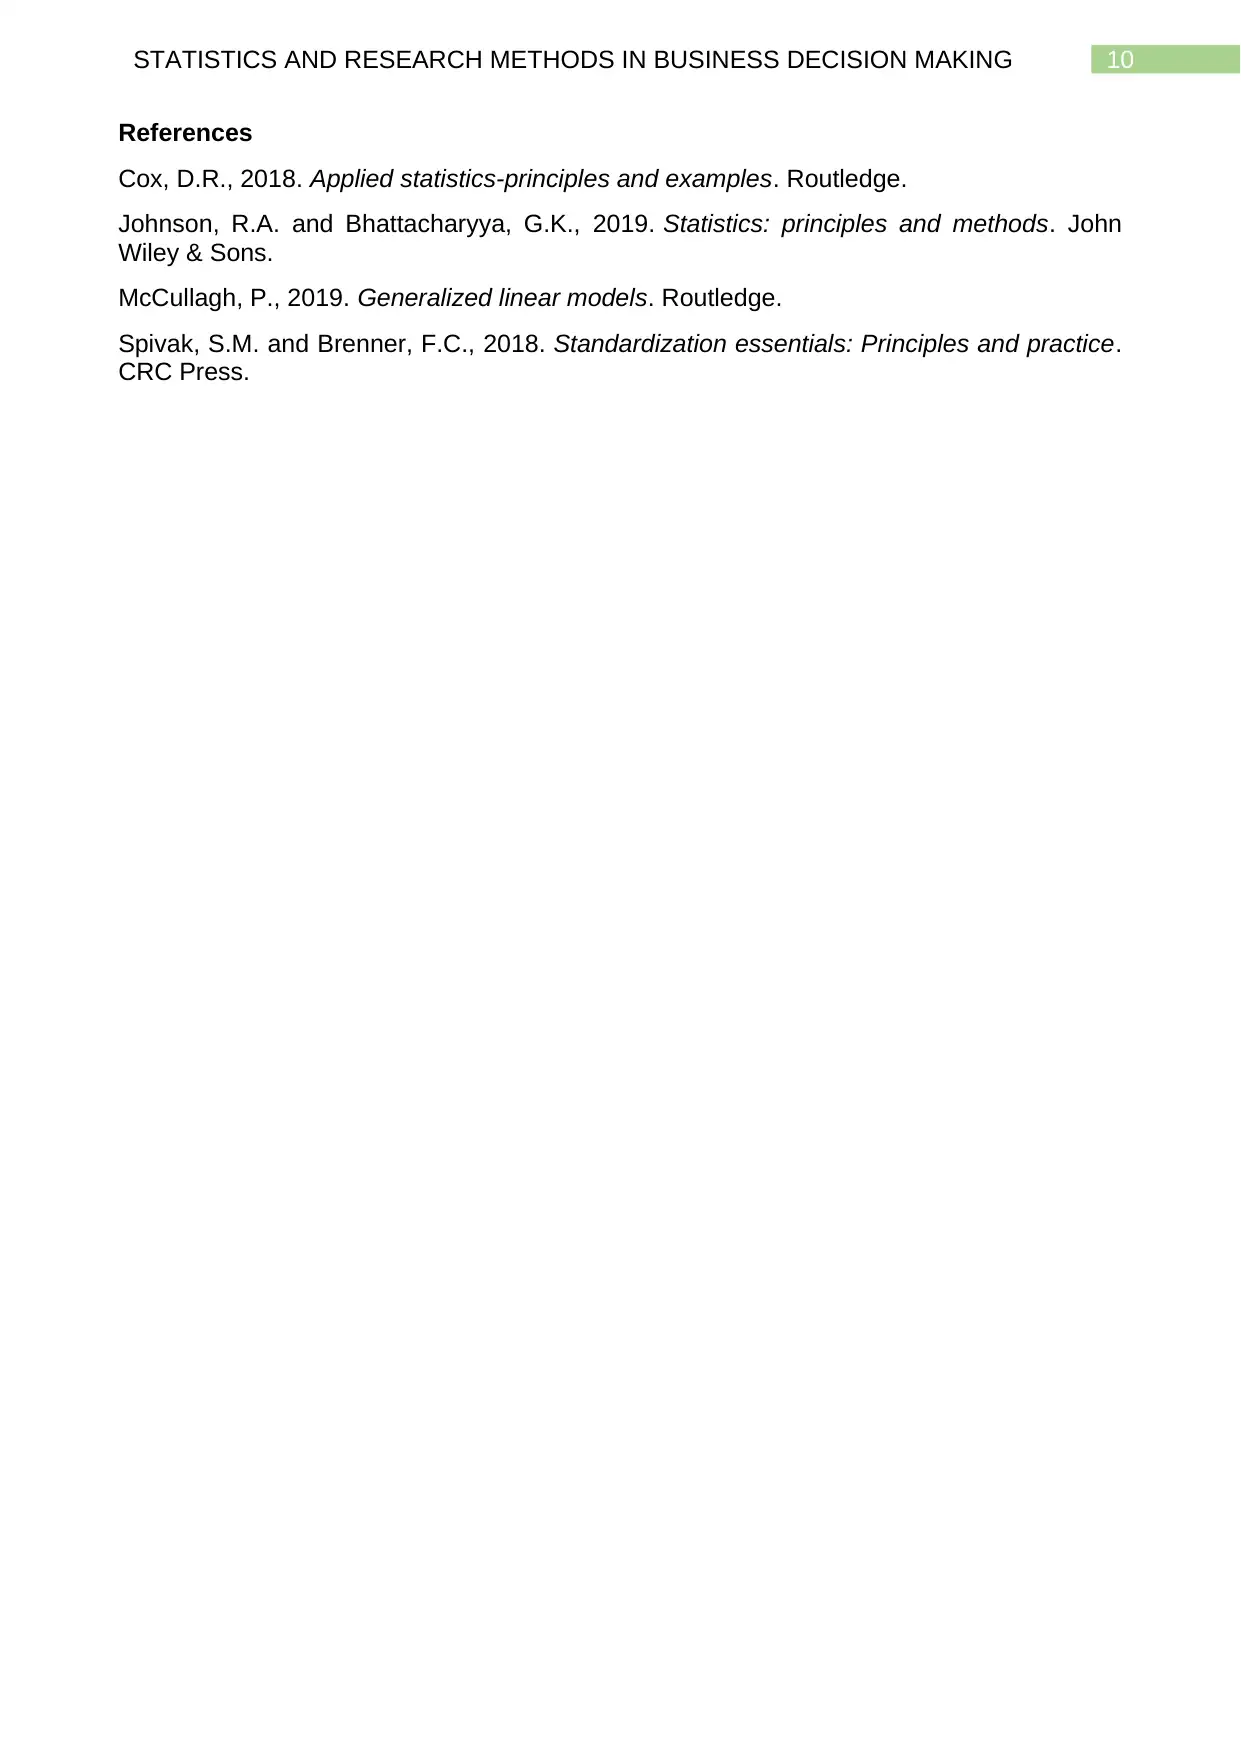
This report, prepared for HI6007: Statistics and Research Methods for Business Decision Making, presents a comprehensive analysis of statistical techniques applied to business scenarios. The report addresses three key questions, beginning with a comparative analysis of CO2 emissions across different countries between 2009 and 2013, utilizing charts to illustrate emission trends and percentage changes. The second question involves frequency distribution analysis, including the construction of tables for frequency and relative frequency, cumulative frequency, and graphical representations such as histograms and ogives. The final section explores the relationship between inflation rates and the All-Ordinaries Index in Australia from 1995 to 2015. This part includes trend analysis, scatter plots, numerical summaries, correlation coefficient calculations, and regression analysis to understand the impact of inflation on the stock market index. The report concludes with an evaluation of the regression model's fit and the statistical significance of the relationship between the variables, including p-value and standard error analysis, and presents the references used.
Document Page
Running head: STATISTICS AND RESEARCH METHODS IN BUSINESS DECISION
MAKING
Statistics and Research Methods in Business Decision Making
Name of the Student
Name of the University
Author note
tabler-icon-diamond-filled.svg

Paraphrase This Document

Need a fresh take? Get an instant paraphrase of this document with our AI Paraphraser
Document Page
1STATISTICS AND RESEARCH METHODS IN BUSINESS DECISION MAKING
Table of Contents
Question 1....................................................................................................................2
Question 2....................................................................................................................4
Question 3....................................................................................................................6
References.................................................................................................................12
Document Page
2STATISTICS AND RESEARCH METHODS IN BUSINESS DECISION MAKING
Question 1
a)
Chart 1: Comparison of amount of CO2 emission in 2009 and 2013
b)
Chart 2: Comparison of percentage value of CO2 emission in 2009 and 2013
c)
The comparison of CO2 emission by countries between 2009 and 2013 suggest
that some nations have successfully lowered emission while other are not. United State,
Germany, Canada, Italy, South Africa, Saudi Arabia and France are some countries that
have reduced their pollution level. Emission in China in 2013 on the other hand almost
Document Page
3STATISTICS AND RESEARCH METHODS IN BUSINESS DECISION MAKING
doubled in 2013 compared to 2009. In percentage term also, China recorded largest
percentage increase in emission. Percentage reduction in emission is the highest in United
State.
tabler-icon-diamond-filled.svg

Paraphrase This Document

Need a fresh take? Get an instant paraphrase of this document with our AI Paraphraser
Document Page
4STATISTICS AND RESEARCH METHODS IN BUSINESS DECISION MAKING
Question 2
a)
Table 1: Frequency and Relative frequency distribution
b)
Table 2: Cumulative and Cumulative Relative Frequency
Document Page
5STATISTICS AND RESEARCH METHODS IN BUSINESS DECISION MAKING
c)
Chart 3: Relative Frequency Histogram
d)
Chart 4: Ogive for cumulative frequency distribution
e)
Proportion less than65= Frequency less than65
Total frequency
¿ 16
40
¿ 0.4
Document Page
6STATISTICS AND RESEARCH METHODS IN BUSINESS DECISION MAKING
f)
Proportion more than 75= Frequency more than65
Total frequency
¿ 6
40
¿ 0.15
Question 3
a)
Chart 5: Trend in Rate of inflation from 1995 to 2015
Chart 6: Trend in All-Ordinaries Index from 1995 to 2015
Chart 5 and Chart 6 explain the trend in Rate of Inflation and All-Ordinaries Index
from 1995 to 2015. The inflationary trend shows that rate of inflation in Australia decreases
over time. In contrast, trend in All-Ordinaries Index shows that the Index increases over
time.
tabler-icon-diamond-filled.svg

Paraphrase This Document

Need a fresh take? Get an instant paraphrase of this document with our AI Paraphraser
Document Page
7STATISTICS AND RESEARCH METHODS IN BUSINESS DECISION MAKING
b.
Chart 8: Scatter plot
The above scatter plot depicts the relation between Rate of Inflation and All-
Ordinaries Index. All-Ordinaries Index varies depending on Rate of Inflation. In
constructing the scatter plot, All-Ordinaries Index is taken as independent variable or X.
Rate of Inflation is taken as dependent variable or Y (McCullagh 2019).
c.
Table 3: Numerical summary report for Rate of Inflation
Table 4: Numerical summary report for All-Ordinaries Index
Document Page
8STATISTICS AND RESEARCH METHODS IN BUSINESS DECISION MAKING
d.
Table 5: Coefficient of Correlation
In statistics, coefficient of correlation is a measure showing degree of association
between two chosen variables. Coefficient of correlation between Rate of Inflation and All-
Ordinaries Index is estimated to be 0.039. From the measure of correlation coefficient, a
positive relation can be comprehended between Inflation and All-Ordinaries Index
(Johnson and Bhattacharyya 2019). The relatively smaller value of correlation coefficient
suggests that there exists only a weak association between the targeted variable.
e.
Table 6: Result of estimated regression
Document Page
9STATISTICS AND RESEARCH METHODS IN BUSINESS DECISION MAKING
Estimated regression equation
AllOrdinaries Index=3874.2864+( 40.3077× Rate of Inflation)
In the regression analysis, the independent variable is Rate of Inflation and the
dependent variable is All-Ordinaries Index. The regression coefficient therefore measures
changes in All-Ordinaries Index because of an associated change in inflation. From the
analysis the regression coefficient is obtained as 40.31. Positive coefficient implies Rate of
Inflation has a positive relation with All-Ordinaries Index. That means All-Ordinaries Index
increase as inflation increases and decreases as price level goes down.
f.
The obtained value of R square from the regression is 0.0015. The R square value
suggests that Inflation accounts for only 0.15 percent fluctuation in All-Ordinaries Index.
The coefficient of determination of the model therefore implies that the model is not a good
fit model (Cox 2018).
g.
P value for the coefficient is 0.8671. P value of the coefficient is larger relative to the
chosen significant value of 5%. This means there is enough evidence to accept the null
hypothesis claiming no significant relation between Inflation and All-Ordinaries Index
(Spivak and Brenner 2018). The relationship therefore is not statistically significant.
h.
Standard error of the estimate is 237.6901. Larger standard error means larger
variation between observed and predicted value of the model. The model therefore is not
fitted good to the given data.
tabler-icon-diamond-filled.svg

Paraphrase This Document

Need a fresh take? Get an instant paraphrase of this document with our AI Paraphraser
Document Page
10STATISTICS AND RESEARCH METHODS IN BUSINESS DECISION MAKING
References
Cox, D.R., 2018. Applied statistics-principles and examples. Routledge.
Johnson, R.A. and Bhattacharyya, G.K., 2019. Statistics: principles and methods. John
Wiley & Sons.
McCullagh, P., 2019. Generalized linear models. Routledge.
Spivak, S.M. and Brenner, F.C., 2018. Standardization essentials: Principles and practice.
CRC Press.
chevron_up_icon
1 out of 11
circle_padding
hide_on_mobile
zoom_out_icon
[object Object]