Research & Statistical Methods: Job Insecurity & Well-being
VerifiedAdded on 2023/06/12
|13
|3020
|411
Report
AI Summary
This report delves into the application of research and statistical methods to analyze job insecurity, drawing upon a study by De Witte et al. (2010) that investigated the association between employees' perceptions of quantitative and qualitative job insecurity with their job satisfaction and psychological distress in the Belgian banking sector. The report discusses sample size considerations, highlighting the benefits and drawbacks of using a large sample, and justifies the use of probability sampling, specifically simple random sampling, outlining its advantages and disadvantages. Furthermore, it addresses measures of variables, including reliability and validity, and the importance of collecting data on social demographics. The research design employed is a mixed-methods approach, combining quantitative (surveys) and qualitative (literature review) data, and the report explores the pros and cons of this design, as well as the specific sequential explanatory design used in the research. The goal is to provide a comprehensive understanding of the research methodologies applied to the study of job insecurity and its impact on employee well-being.
qwertyuiopasdfghjklzxcvbnmqwertyui
opasdfghjklzxcvbnmqwertyuiopasdfgh
jklzxcvbnmqwertyuiopasdfghjklzxcvb
nmqwertyuiopasdfghjklzxcvbnmqwer
tyuiopasdfghjklzxcvbnmqwertyuiopas
dfghjklzxcvbnmqwertyuiopasdfghjklzx
cvbnmqwertyuiopasdfghjklzxcvbnmq
wertyuiopasdfghjklzxcvbnmqwertyuio
pasdfghjklzxcvbnmqwertyuiopasdfghj
klzxcvbnmqwertyuiopasdfghjklzxcvbn
mqwertyuiopasdfghjklzxcvbnmqwerty
uiopasdfghjklzxcvbnmqwertyuiopasdf
ghjklzxcvbnmqwertyuiopasdfghjklzxc
vbnmqwertyuiopasdfghjklzxcvbnmrty
uiopasdfghjklzxcvbnmqwertyuiopasdf
ghjklzxcvbnmqwertyuiopasdfghjklzxc
Running head: RESEARCH AND STATISTICAL METHOD FOR BUSINESS
Research and Statistical Method for Business
SUBMITTED BY
Paraphrase This Document
Need a fresh take? Get an instant paraphrase of this document with our AI Paraphraser
RESEARCH AND STATISTICAL METHOD FOR BUSINESS
2
Table of Contents
Q1: Sample size...............................................................................................................................3
Q2: Sampling method......................................................................................................................3
Q3: Measures of variables...............................................................................................................4
Q4: Collection of data on social demographics...............................................................................6
Q5: Research design........................................................................................................................6
References......................................................................................................................................11
Appendix........................................................................................................................................13
RESEARCH AND STATISTICAL METHOD FOR BUSINESS
3
Q1: Sample size
This sample size is necessary because large samples are highly nearest to the population.
Furthermore, the primary goal of using a larger sample is to collect depth and a wide range of
data from a sample to the population. An investigator has selected large sample size to make less
assumption in the project. This sample size provides more reliable outcome with high quality and
validity, however, there is a need for the high amount of cost and time (Taylor, Bogdan, and
DeVault, 2015). The large sample size is more required to generate outcome between variables,
which are significantly diverse. For qualitative research, the goal is to ‘decline the possibilities of
identifying failure’. A larger sample contains more people as there is a chance of getting the
wide range of prospect information and construct picture for evaluation. In addition, large
sample size demonstrates the population and limiting the influence of tremendous observation
(Lewis, 2015).
Q2: Sampling method
Probability sampling is the current sampling method in this research. This method relies on the
facts that each participant of the population have a known and equal opportunity of being chosen.
Under this research, simple random sampling method has selected as population member are
related to one another on the significant variable (Silverman, 2016).
Advantages of using Random Sampling
Random sampling permits an investigator to conduct the assessment of information, which is
gathered within the lower margin of error. It is permitted as the sampling occurs within particular
boundaries that state the sampling procedure. The whole procedure is randomized and the
random sampling demonstrates the whole population and it also permits the facts to give the
precise perception of particular subject matters (Smith, 2015).
⊘ This is a preview!⊘
Do you want full access?
Subscribe today to unlock all pages.
Trusted by 1+ million students worldwide
RESEARCH AND STATISTICAL METHOD FOR BUSINESS
4
It is also evaluated that simple random sampling permits each person within targeted area to have
an equal probability of being chosen. It aids to generate more accuracy within the pooled
information as each participant has 50/50 chances. It is a procedure, which develops the inherent
fairness into the conducted research as no earlier facts regarding the involved person are entailed
into data gathering procedure (Glaser, and Strauss, 2017).
Another benefit of using simple random sampling method is that there is no need for specific
understanding regarding the information being gathered. It could be effective to complete the
aim and objectives in an efficient and effective manner. An investigator could ask with
employees working in the Belgian banks affiliated to the sector’s joint industrial committee in
2001 without knowing about the Belgium banking structure. In random sampling, a question is
asked and then responded. A question is reviewed for a particular purpose. An investigator can
attain the aim and objectives of the project due to performing the task and pooling the
information by using the simple random sampling process (Neuman, and Robson, 2014).
Disadvantages of Random Sampling
Under this sampling method, each individual should be individually interviewed and reviewed
hence the information could be properly gathered. While individuals are in groups, then their
answers tend to be persuaded by the responses of others. It shows that an investigator should
perform with each person on 1 on 1 basis. It requires more resources, efficiencies and time as
compared to other research technique. For this process, a high level of skill is necessary for an
investigator as they can separate the feasible information that has been pooled from inappropriate
facts and figures. Further, if the skill does not exist then the reliability of conclusion produced by
the presented data may be complex (Denzin, 2017).
Q3: Measures of variables
Paraphrase This Document
Need a fresh take? Get an instant paraphrase of this document with our AI Paraphraser
RESEARCH AND STATISTICAL METHOD FOR BUSINESS
5
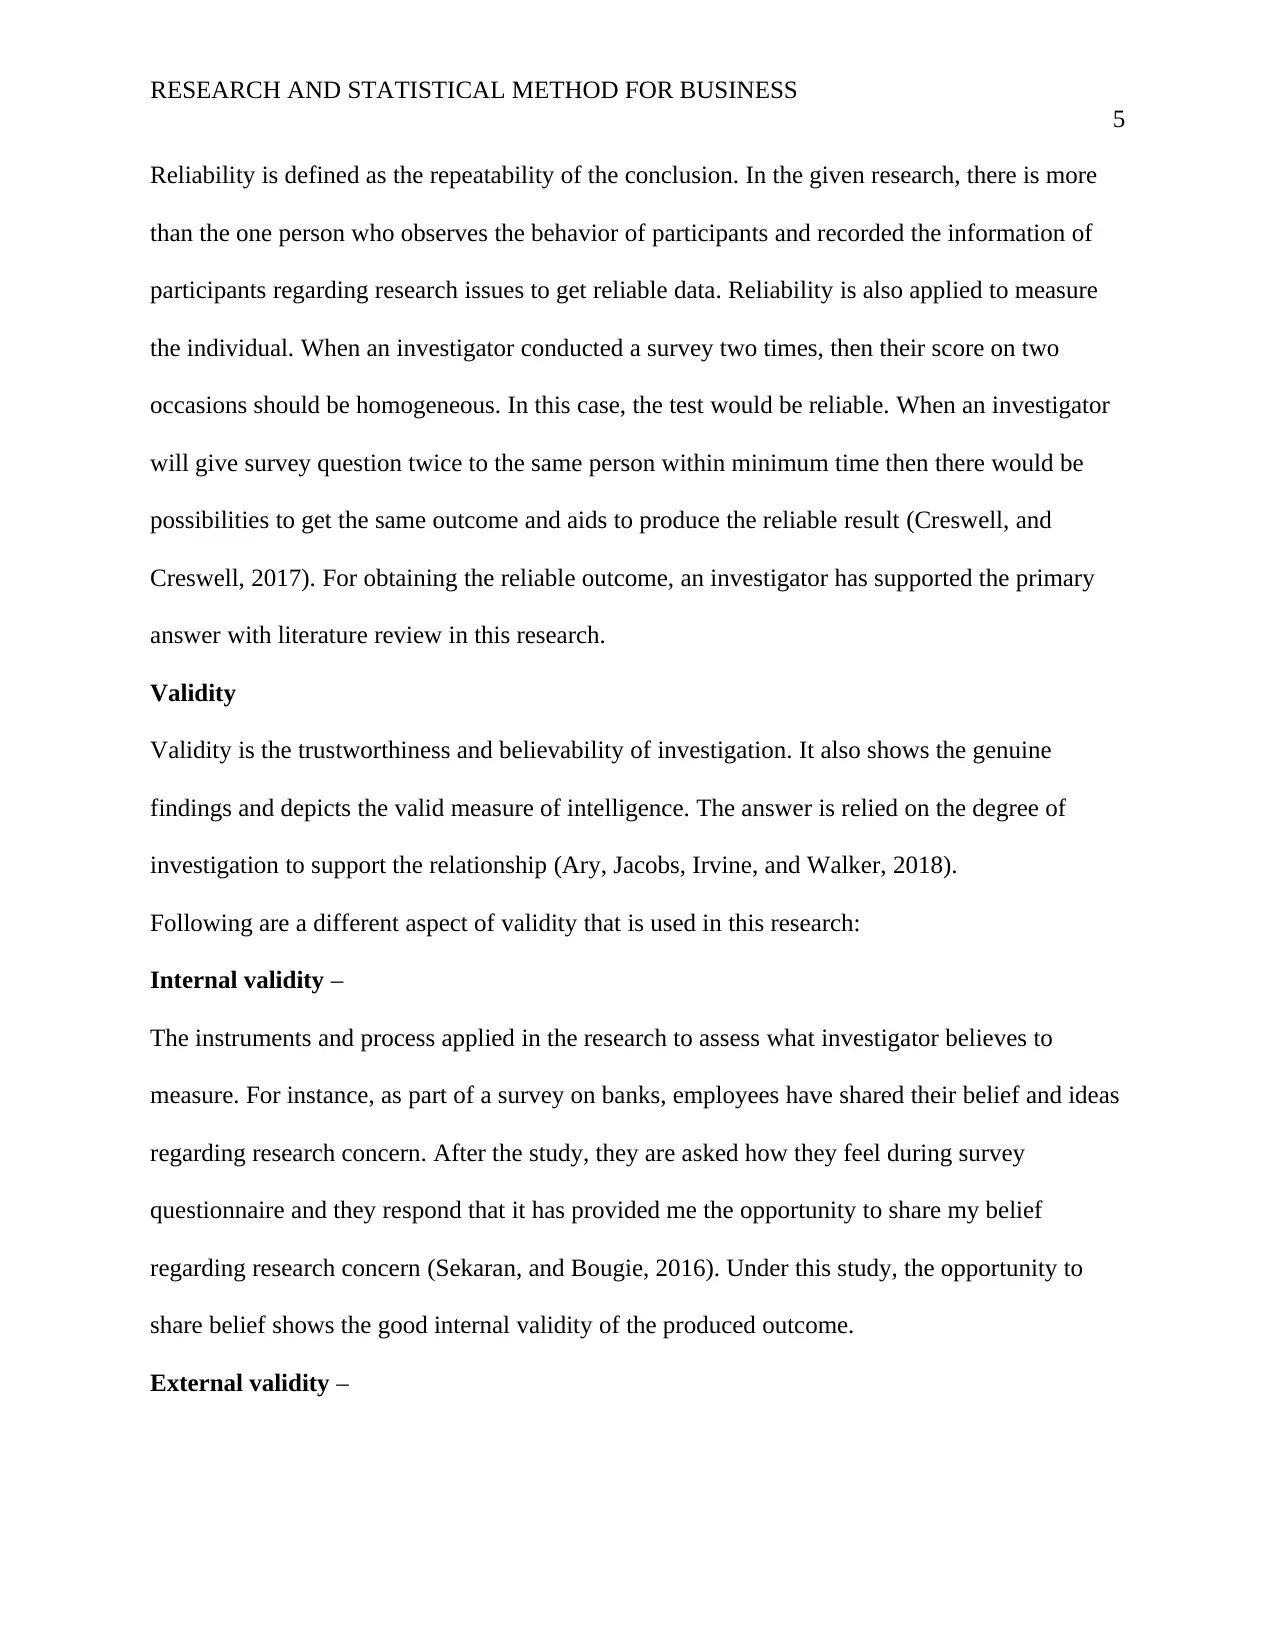
Reliability is defined as the repeatability of the conclusion. In the given research, there is more
than the one person who observes the behavior of participants and recorded the information of
participants regarding research issues to get reliable data. Reliability is also applied to measure
the individual. When an investigator conducted a survey two times, then their score on two
occasions should be homogeneous. In this case, the test would be reliable. When an investigator
will give survey question twice to the same person within minimum time then there would be
possibilities to get the same outcome and aids to produce the reliable result (Creswell, and
Creswell, 2017). For obtaining the reliable outcome, an investigator has supported the primary
answer with literature review in this research.
Validity
Validity is the trustworthiness and believability of investigation. It also shows the genuine
findings and depicts the valid measure of intelligence. The answer is relied on the degree of
investigation to support the relationship (Ary, Jacobs, Irvine, and Walker, 2018).
Following are a different aspect of validity that is used in this research:
Internal validity –
The instruments and process applied in the research to assess what investigator believes to
measure. For instance, as part of a survey on banks, employees have shared their belief and ideas
regarding research concern. After the study, they are asked how they feel during survey
questionnaire and they respond that it has provided me the opportunity to share my belief
regarding research concern (Sekaran, and Bougie, 2016). Under this study, the opportunity to
share belief shows the good internal validity of the produced outcome.
External validity –
5
Reliability is defined as the repeatability of the conclusion. In the given research, there is more
than the one person who observes the behavior of participants and recorded the information of
participants regarding research issues to get reliable data. Reliability is also applied to measure
the individual. When an investigator conducted a survey two times, then their score on two
occasions should be homogeneous. In this case, the test would be reliable. When an investigator
will give survey question twice to the same person within minimum time then there would be
possibilities to get the same outcome and aids to produce the reliable result (Creswell, and
Creswell, 2017). For obtaining the reliable outcome, an investigator has supported the primary
answer with literature review in this research.
Validity
Validity is the trustworthiness and believability of investigation. It also shows the genuine
findings and depicts the valid measure of intelligence. The answer is relied on the degree of
investigation to support the relationship (Ary, Jacobs, Irvine, and Walker, 2018).
Following are a different aspect of validity that is used in this research:
Internal validity –
The instruments and process applied in the research to assess what investigator believes to
measure. For instance, as part of a survey on banks, employees have shared their belief and ideas
regarding research concern. After the study, they are asked how they feel during survey
questionnaire and they respond that it has provided me the opportunity to share my belief
regarding research concern (Sekaran, and Bougie, 2016). Under this study, the opportunity to
share belief shows the good internal validity of the produced outcome.
External validity –
RESEARCH AND STATISTICAL METHOD FOR BUSINESS
6
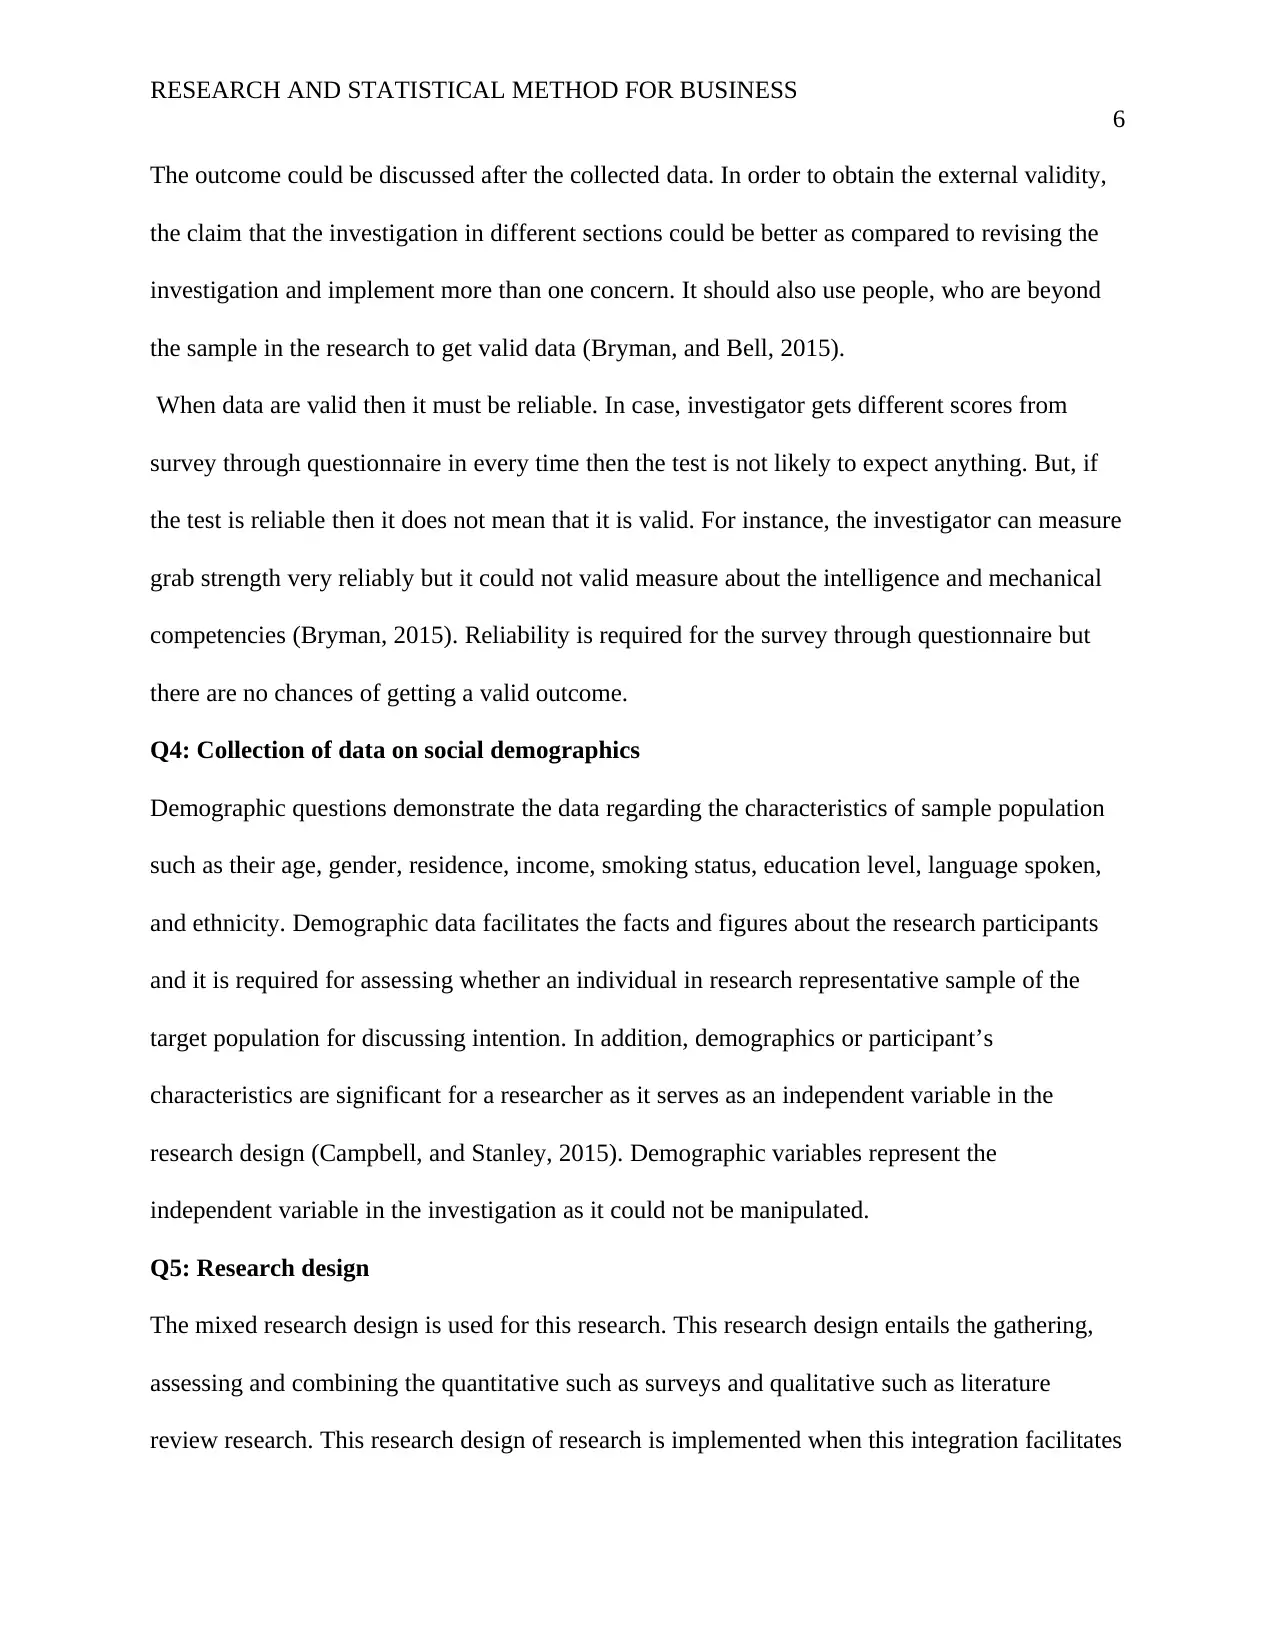
The outcome could be discussed after the collected data. In order to obtain the external validity,
the claim that the investigation in different sections could be better as compared to revising the
investigation and implement more than one concern. It should also use people, who are beyond
the sample in the research to get valid data (Bryman, and Bell, 2015).
When data are valid then it must be reliable. In case, investigator gets different scores from
survey through questionnaire in every time then the test is not likely to expect anything. But, if
the test is reliable then it does not mean that it is valid. For instance, the investigator can measure
grab strength very reliably but it could not valid measure about the intelligence and mechanical
competencies (Bryman, 2015). Reliability is required for the survey through questionnaire but
there are no chances of getting a valid outcome.
Q4: Collection of data on social demographics
Demographic questions demonstrate the data regarding the characteristics of sample population
such as their age, gender, residence, income, smoking status, education level, language spoken,
and ethnicity. Demographic data facilitates the facts and figures about the research participants
and it is required for assessing whether an individual in research representative sample of the
target population for discussing intention. In addition, demographics or participant’s
characteristics are significant for a researcher as it serves as an independent variable in the
research design (Campbell, and Stanley, 2015). Demographic variables represent the
independent variable in the investigation as it could not be manipulated.
Q5: Research design
The mixed research design is used for this research. This research design entails the gathering,
assessing and combining the quantitative such as surveys and qualitative such as literature
review research. This research design of research is implemented when this integration facilitates
6
The outcome could be discussed after the collected data. In order to obtain the external validity,
the claim that the investigation in different sections could be better as compared to revising the
investigation and implement more than one concern. It should also use people, who are beyond
the sample in the research to get valid data (Bryman, and Bell, 2015).
When data are valid then it must be reliable. In case, investigator gets different scores from
survey through questionnaire in every time then the test is not likely to expect anything. But, if
the test is reliable then it does not mean that it is valid. For instance, the investigator can measure
grab strength very reliably but it could not valid measure about the intelligence and mechanical
competencies (Bryman, 2015). Reliability is required for the survey through questionnaire but
there are no chances of getting a valid outcome.
Q4: Collection of data on social demographics
Demographic questions demonstrate the data regarding the characteristics of sample population
such as their age, gender, residence, income, smoking status, education level, language spoken,
and ethnicity. Demographic data facilitates the facts and figures about the research participants
and it is required for assessing whether an individual in research representative sample of the
target population for discussing intention. In addition, demographics or participant’s
characteristics are significant for a researcher as it serves as an independent variable in the
research design (Campbell, and Stanley, 2015). Demographic variables represent the
independent variable in the investigation as it could not be manipulated.
Q5: Research design
The mixed research design is used for this research. This research design entails the gathering,
assessing and combining the quantitative such as surveys and qualitative such as literature
review research. This research design of research is implemented when this integration facilitates
⊘ This is a preview!⊘
Do you want full access?
Subscribe today to unlock all pages.
Trusted by 1+ million students worldwide
RESEARCH AND STATISTICAL METHOD FOR BUSINESS
7
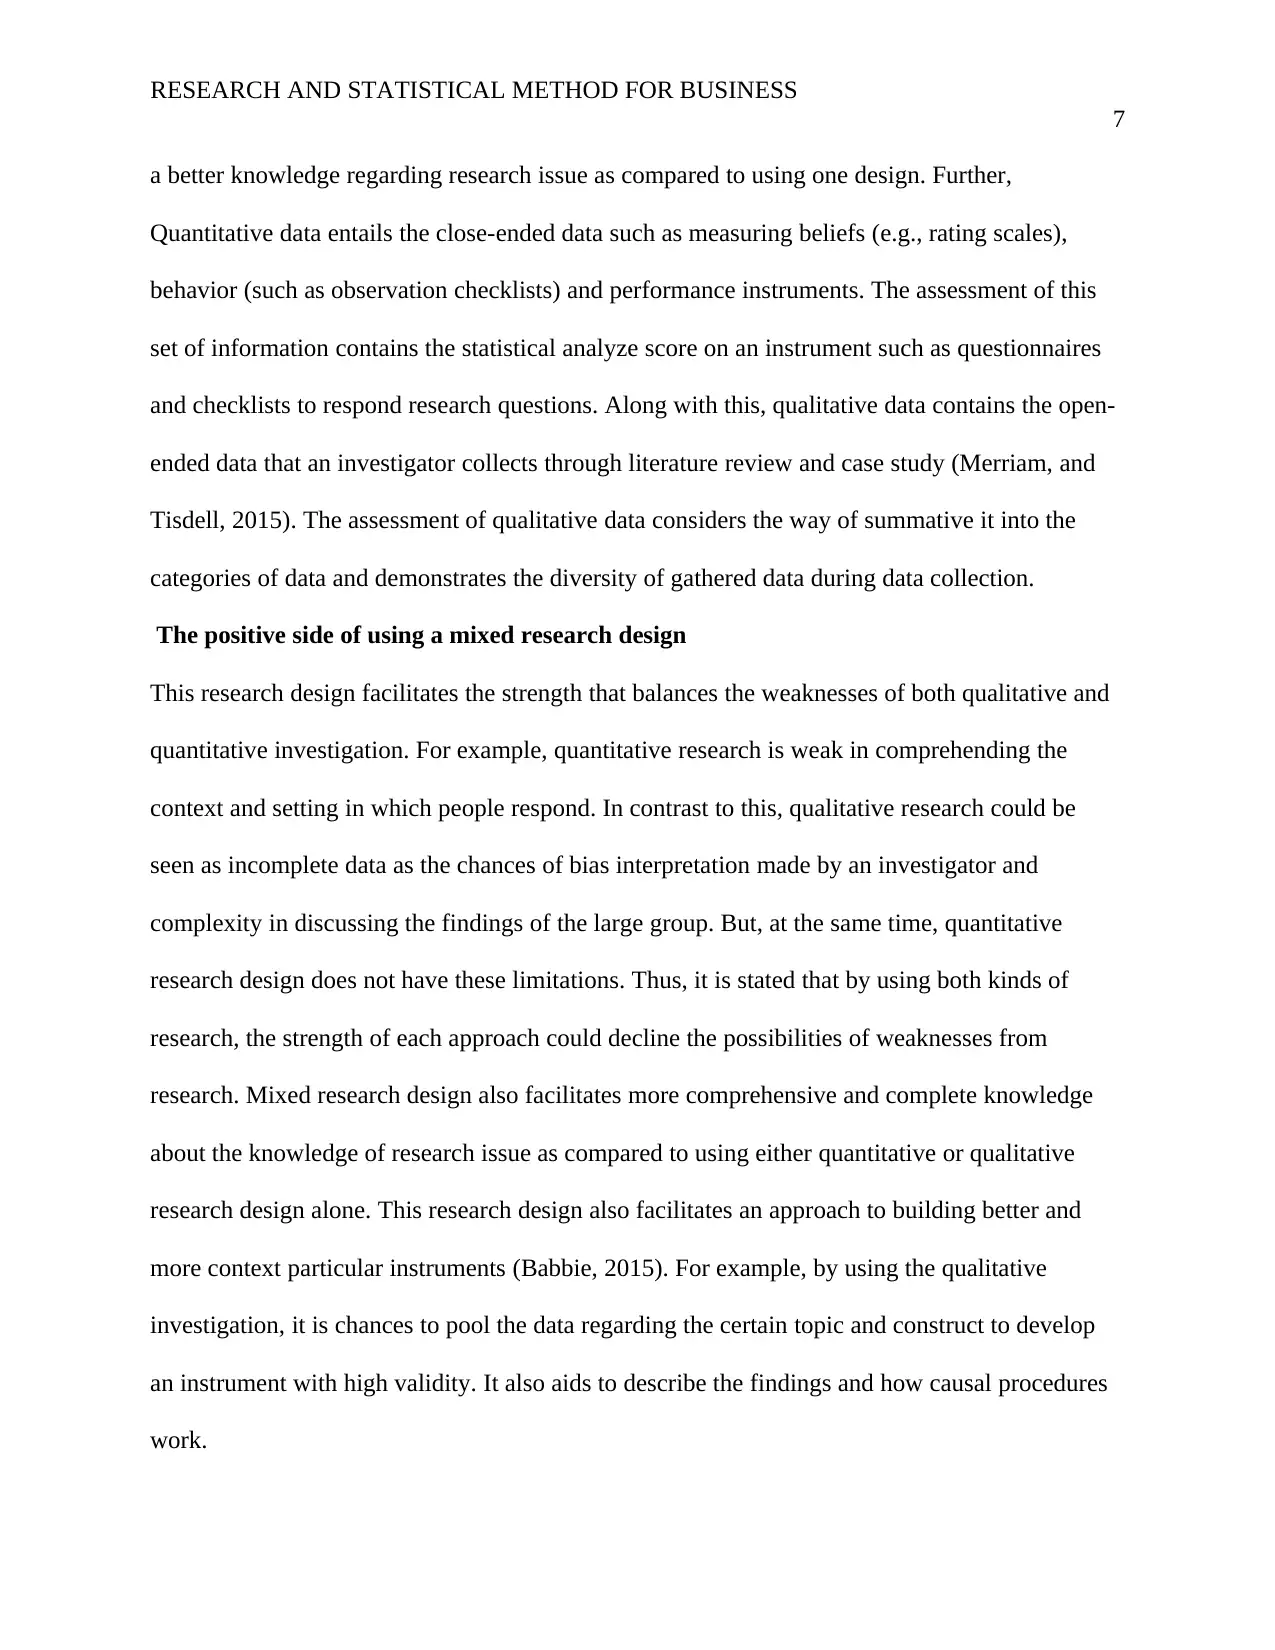
a better knowledge regarding research issue as compared to using one design. Further,
Quantitative data entails the close-ended data such as measuring beliefs (e.g., rating scales),
behavior (such as observation checklists) and performance instruments. The assessment of this
set of information contains the statistical analyze score on an instrument such as questionnaires
and checklists to respond research questions. Along with this, qualitative data contains the open-
ended data that an investigator collects through literature review and case study (Merriam, and
Tisdell, 2015). The assessment of qualitative data considers the way of summative it into the
categories of data and demonstrates the diversity of gathered data during data collection.
The positive side of using a mixed research design
This research design facilitates the strength that balances the weaknesses of both qualitative and
quantitative investigation. For example, quantitative research is weak in comprehending the
context and setting in which people respond. In contrast to this, qualitative research could be
seen as incomplete data as the chances of bias interpretation made by an investigator and
complexity in discussing the findings of the large group. But, at the same time, quantitative
research design does not have these limitations. Thus, it is stated that by using both kinds of
research, the strength of each approach could decline the possibilities of weaknesses from
research. Mixed research design also facilitates more comprehensive and complete knowledge
about the knowledge of research issue as compared to using either quantitative or qualitative
research design alone. This research design also facilitates an approach to building better and
more context particular instruments (Babbie, 2015). For example, by using the qualitative
investigation, it is chances to pool the data regarding the certain topic and construct to develop
an instrument with high validity. It also aids to describe the findings and how causal procedures
work.
7
a better knowledge regarding research issue as compared to using one design. Further,
Quantitative data entails the close-ended data such as measuring beliefs (e.g., rating scales),
behavior (such as observation checklists) and performance instruments. The assessment of this
set of information contains the statistical analyze score on an instrument such as questionnaires
and checklists to respond research questions. Along with this, qualitative data contains the open-
ended data that an investigator collects through literature review and case study (Merriam, and
Tisdell, 2015). The assessment of qualitative data considers the way of summative it into the
categories of data and demonstrates the diversity of gathered data during data collection.
The positive side of using a mixed research design
This research design facilitates the strength that balances the weaknesses of both qualitative and
quantitative investigation. For example, quantitative research is weak in comprehending the
context and setting in which people respond. In contrast to this, qualitative research could be
seen as incomplete data as the chances of bias interpretation made by an investigator and
complexity in discussing the findings of the large group. But, at the same time, quantitative
research design does not have these limitations. Thus, it is stated that by using both kinds of
research, the strength of each approach could decline the possibilities of weaknesses from
research. Mixed research design also facilitates more comprehensive and complete knowledge
about the knowledge of research issue as compared to using either quantitative or qualitative
research design alone. This research design also facilitates an approach to building better and
more context particular instruments (Babbie, 2015). For example, by using the qualitative
investigation, it is chances to pool the data regarding the certain topic and construct to develop
an instrument with high validity. It also aids to describe the findings and how causal procedures
work.
Paraphrase This Document
Need a fresh take? Get an instant paraphrase of this document with our AI Paraphraser
RESEARCH AND STATISTICAL METHOD FOR BUSINESS
8
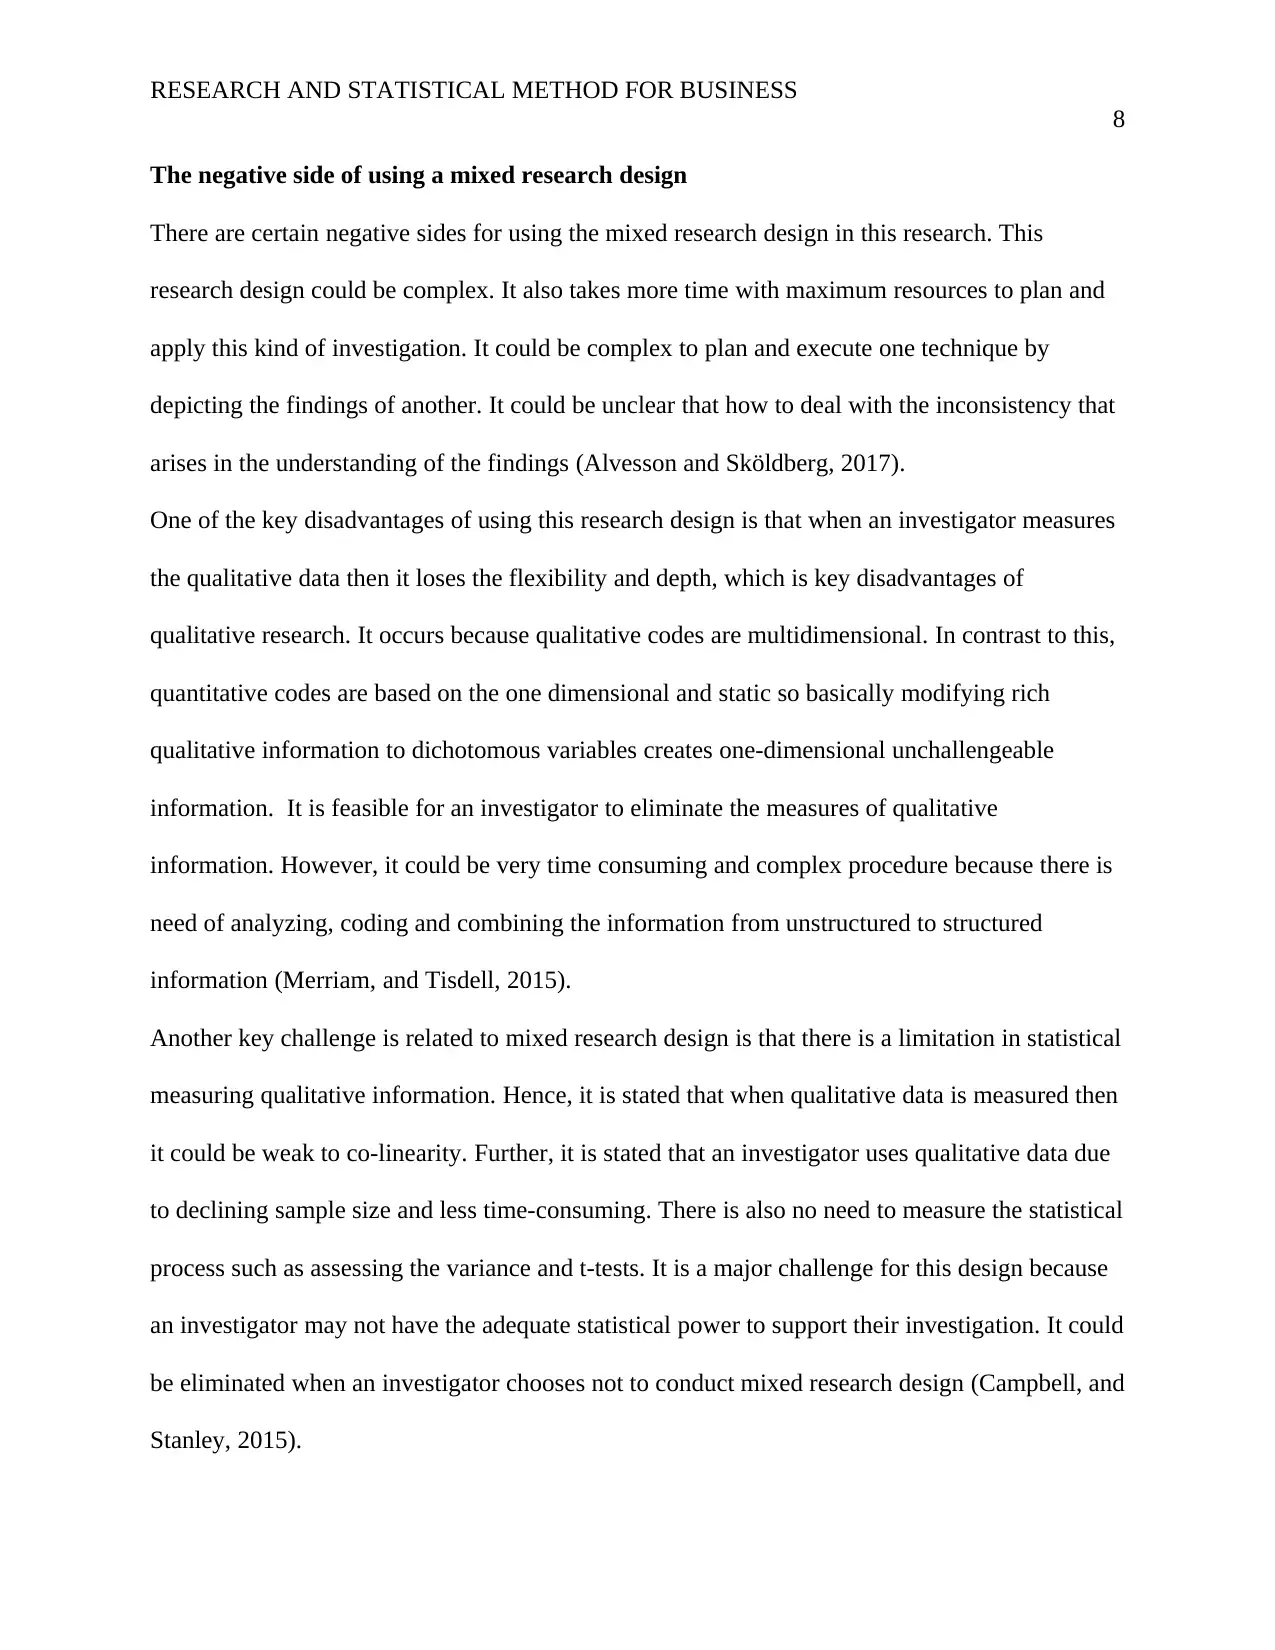
The negative side of using a mixed research design
There are certain negative sides for using the mixed research design in this research. This
research design could be complex. It also takes more time with maximum resources to plan and
apply this kind of investigation. It could be complex to plan and execute one technique by
depicting the findings of another. It could be unclear that how to deal with the inconsistency that
arises in the understanding of the findings (Alvesson and Sköldberg, 2017).
One of the key disadvantages of using this research design is that when an investigator measures
the qualitative data then it loses the flexibility and depth, which is key disadvantages of
qualitative research. It occurs because qualitative codes are multidimensional. In contrast to this,
quantitative codes are based on the one dimensional and static so basically modifying rich
qualitative information to dichotomous variables creates one-dimensional unchallengeable
information. It is feasible for an investigator to eliminate the measures of qualitative
information. However, it could be very time consuming and complex procedure because there is
need of analyzing, coding and combining the information from unstructured to structured
information (Merriam, and Tisdell, 2015).
Another key challenge is related to mixed research design is that there is a limitation in statistical
measuring qualitative information. Hence, it is stated that when qualitative data is measured then
it could be weak to co-linearity. Further, it is stated that an investigator uses qualitative data due
to declining sample size and less time-consuming. There is also no need to measure the statistical
process such as assessing the variance and t-tests. It is a major challenge for this design because
an investigator may not have the adequate statistical power to support their investigation. It could
be eliminated when an investigator chooses not to conduct mixed research design (Campbell, and
Stanley, 2015).
8
The negative side of using a mixed research design
There are certain negative sides for using the mixed research design in this research. This
research design could be complex. It also takes more time with maximum resources to plan and
apply this kind of investigation. It could be complex to plan and execute one technique by
depicting the findings of another. It could be unclear that how to deal with the inconsistency that
arises in the understanding of the findings (Alvesson and Sköldberg, 2017).
One of the key disadvantages of using this research design is that when an investigator measures
the qualitative data then it loses the flexibility and depth, which is key disadvantages of
qualitative research. It occurs because qualitative codes are multidimensional. In contrast to this,
quantitative codes are based on the one dimensional and static so basically modifying rich
qualitative information to dichotomous variables creates one-dimensional unchallengeable
information. It is feasible for an investigator to eliminate the measures of qualitative
information. However, it could be very time consuming and complex procedure because there is
need of analyzing, coding and combining the information from unstructured to structured
information (Merriam, and Tisdell, 2015).
Another key challenge is related to mixed research design is that there is a limitation in statistical
measuring qualitative information. Hence, it is stated that when qualitative data is measured then
it could be weak to co-linearity. Further, it is stated that an investigator uses qualitative data due
to declining sample size and less time-consuming. There is also no need to measure the statistical
process such as assessing the variance and t-tests. It is a major challenge for this design because
an investigator may not have the adequate statistical power to support their investigation. It could
be eliminated when an investigator chooses not to conduct mixed research design (Campbell, and
Stanley, 2015).
RESEARCH AND STATISTICAL METHOD FOR BUSINESS
9
Sequential explanatory design
Under the mixed research design, the sequential explanatory design is used by a researcher. This
design entails the assortment and assessment of qualitative data. The priority is provided to
quantitative data as well as the findings are integrated during the evaluation phase of the
research. This kind of mixed research design is to explain, interpret and contextualize the
quantitative findings. It is also used to assess the potential result in more detain through
quantitative study (Campbell, and Stanley, 2015).
The positive side of using Sequential explanatory design
The positive side of using this research design is that it is easy to execute as the steps fall into
unambiguous separate phases. This design is also easy to define and the outcome easy to report
(Merriam, and Tisdell, 2015).
The negative side of using Sequential explanatory design
The negative side of using this research design is that it required a substantial length of time for
attaining the all pooled data into two separate stages (Bryman, 2015).
Example:
The research gathers the data regarding Associations between Quantitative and Qualitative Job
Insecurity and Well-being using survey through a questionnaire. This survey is conducted in the
large sample size to get more detail about the research concern.
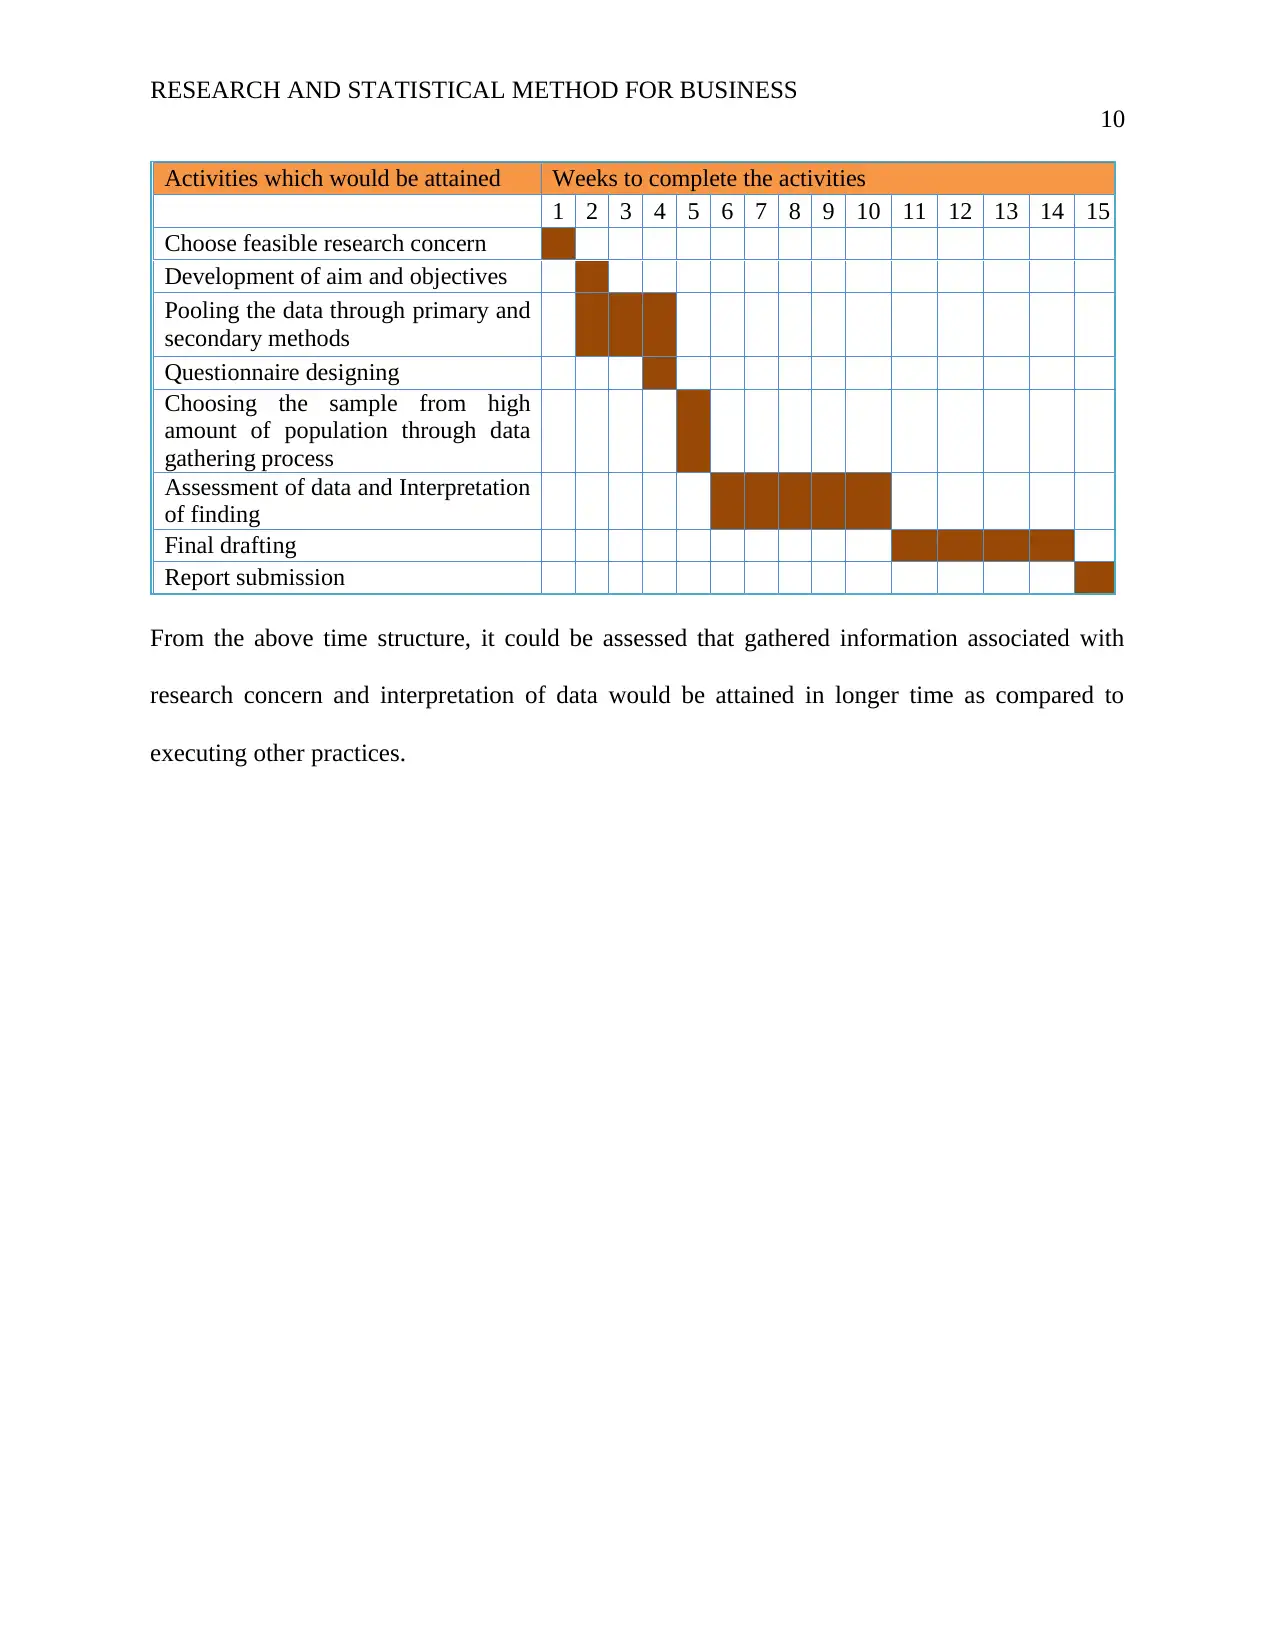
Table 1: Research Timeframe for completing the project
Gantt chart depicts the graphical representation of the action plan that is implemented to explain
how the research activities would be implemented step by step (Campbell, and Stanley, 2015). It
could be demonstrated as follow:
9
Sequential explanatory design
Under the mixed research design, the sequential explanatory design is used by a researcher. This
design entails the assortment and assessment of qualitative data. The priority is provided to
quantitative data as well as the findings are integrated during the evaluation phase of the
research. This kind of mixed research design is to explain, interpret and contextualize the
quantitative findings. It is also used to assess the potential result in more detain through
quantitative study (Campbell, and Stanley, 2015).
The positive side of using Sequential explanatory design
The positive side of using this research design is that it is easy to execute as the steps fall into
unambiguous separate phases. This design is also easy to define and the outcome easy to report
(Merriam, and Tisdell, 2015).
The negative side of using Sequential explanatory design
The negative side of using this research design is that it required a substantial length of time for
attaining the all pooled data into two separate stages (Bryman, 2015).
Example:
The research gathers the data regarding Associations between Quantitative and Qualitative Job
Insecurity and Well-being using survey through a questionnaire. This survey is conducted in the
large sample size to get more detail about the research concern.
Table 1: Research Timeframe for completing the project
Gantt chart depicts the graphical representation of the action plan that is implemented to explain
how the research activities would be implemented step by step (Campbell, and Stanley, 2015). It
could be demonstrated as follow:
⊘ This is a preview!⊘
Do you want full access?
Subscribe today to unlock all pages.
Trusted by 1+ million students worldwide
RESEARCH AND STATISTICAL METHOD FOR BUSINESS
10
Activities which would be attained Weeks to complete the activities
1 2 3 4 5 6 7 8 9 10 11 12 13 14 15
Choose feasible research concern
Development of aim and objectives
Pooling the data through primary and
secondary methods
Questionnaire designing
Choosing the sample from high
amount of population through data
gathering process
Assessment of data and Interpretation
of finding
Final drafting
Report submission
From the above time structure, it could be assessed that gathered information associated with
research concern and interpretation of data would be attained in longer time as compared to
executing other practices.
Paraphrase This Document
Need a fresh take? Get an instant paraphrase of this document with our AI Paraphraser
RESEARCH AND STATISTICAL METHOD FOR BUSINESS
11
References
Alvesson, M., & Sköldberg, K. (2017). Reflexive methodology: New vistas for qualitative
research. USA: Sage.
Ary, D., Jacobs, L. C., Irvine, C. K. S., & Walker, D. (2018). Introduction to research in
education. USA: Cengage Learning.
Babbie, E. (2015). The practice of social research. UK: Nelson Education.
Bryman, A. (2015). Social research methods. USA: Oxford university press.
Bryman, A., & Bell, E. (2015). Business research methods. USA: Oxford University Press.
Campbell, D. T., & Stanley, J. C. (2015). Experimental and quasi-experimental designs for
research. UK: Ravenio Books.
Creswell, J. W., & Creswell, J. D. (2017). Research design: Qualitative, quantitative, and mixed
methods approaches. USA: Sage publications.
Denzin, N. K. (2017). The research act: A theoretical introduction to sociological methods. UK:
Routledge.
Glaser, B. G., & Strauss, A. L. (2017). Discovery of grounded theory: Strategies for qualitative
research. UK: Routledge.
Lewis, S. (2015). Qualitative inquiry and research design: Choosing among five approaches.
Health promotion practice, 16(4), 473-475.
Merriam, S. B., & Tisdell, E. J. (2015). Qualitative research: A guide to design and
implementation. USA: John Wiley & Sons.
Neuman, W. L., & Robson, K. (2014). Basics of social research. Canada: Pearson.
Sekaran, U., & Bougie, R. (2016). Research methods for business: A skill building approach.
USA: John Wiley & Sons.
RESEARCH AND STATISTICAL METHOD FOR BUSINESS
12
Silverman, D. (Ed.). (2016). Qualitative research. USA: Sage.
Smith, J. A. (Ed.). (2015). Qualitative psychology: A practical guide to research methods. USA:
Sage.
Taylor, S. J., Bogdan, R., & DeVault, M. (2015). Introduction to qualitative research methods: A
guidebook and resource. USA: John Wiley & Sons.
⊘ This is a preview!⊘
Do you want full access?
Subscribe today to unlock all pages.
Trusted by 1+ million students worldwide
1 out of 13
Related Documents


Your All-in-One AI-Powered Toolkit for Academic Success.
+13062052269
info@desklib.com
Available 24*7 on WhatsApp / Email
![[object Object]](/_next/static/media/star-bottom.7253800d.svg)
Unlock your academic potential
Copyright © 2020–2026 A2Z Services. All Rights Reserved. Developed and managed by ZUCOL.