BUACC5931: Research and Statistical Methods - Job Insecurity
VerifiedAdded on 2023/06/13
|9
|2465
|405
Homework Assignment
AI Summary
This assignment solution addresses key questions related to research and statistical methods in business, specifically focusing on a study investigating the association between quantitative and qualitative job insecurity and well-being. It discusses the importance of sample size determination, evaluates the appropriateness of simple random sampling, and assesses the reliability and validity of variables such as quantitative job insecurity, qualitative job insecurity, and psychological distress. The solution also examines the role of control variables like gender, age, and education level, and analyzes the advantages and disadvantages of using a correlational research design. The assignment leverages the study by De Witte et al. (2010) in the Belgian banking sector to provide context and examples.
RESEARCH AND STATISTICAL METHODS FOR BUSINESS
Assignment
Student Id and Name
[Pick the date]
Assignment
Student Id and Name
[Pick the date]
Paraphrase This Document
Need a fresh take? Get an instant paraphrase of this document with our AI Paraphraser
Question 1
A key problem that researches often face is with regards to determining the sample size
which would be required for conducting the research. It should be noteworthy that the key
objective of the sampling process is that the chosen sample should be representative of the
actual population. As a general rule, it is better that a higher sample size is selected as it
enhances the chance of the sample being representative of the population even though this
depends on the underlying sampling method deployed. However, a higher sample size leads
to a smaller standard error which captures the difference between the population parameter
and sample statistic. But a key problem associated with a large sample is the high amount of
time and resources that would be required in collecting and analysing data collected from
such large sample (Hair, et.al., 2015).
Hence, the above theoretical discussion clearly reflects that there is an inherent trade off
involved with regards to sample size whereby on one side the higher sample size can
potentially deliver higher precision and accuracy but at a higher cost while on the other side a
lower sample size would lower the accuracy but the cost involved would be lesser. In this
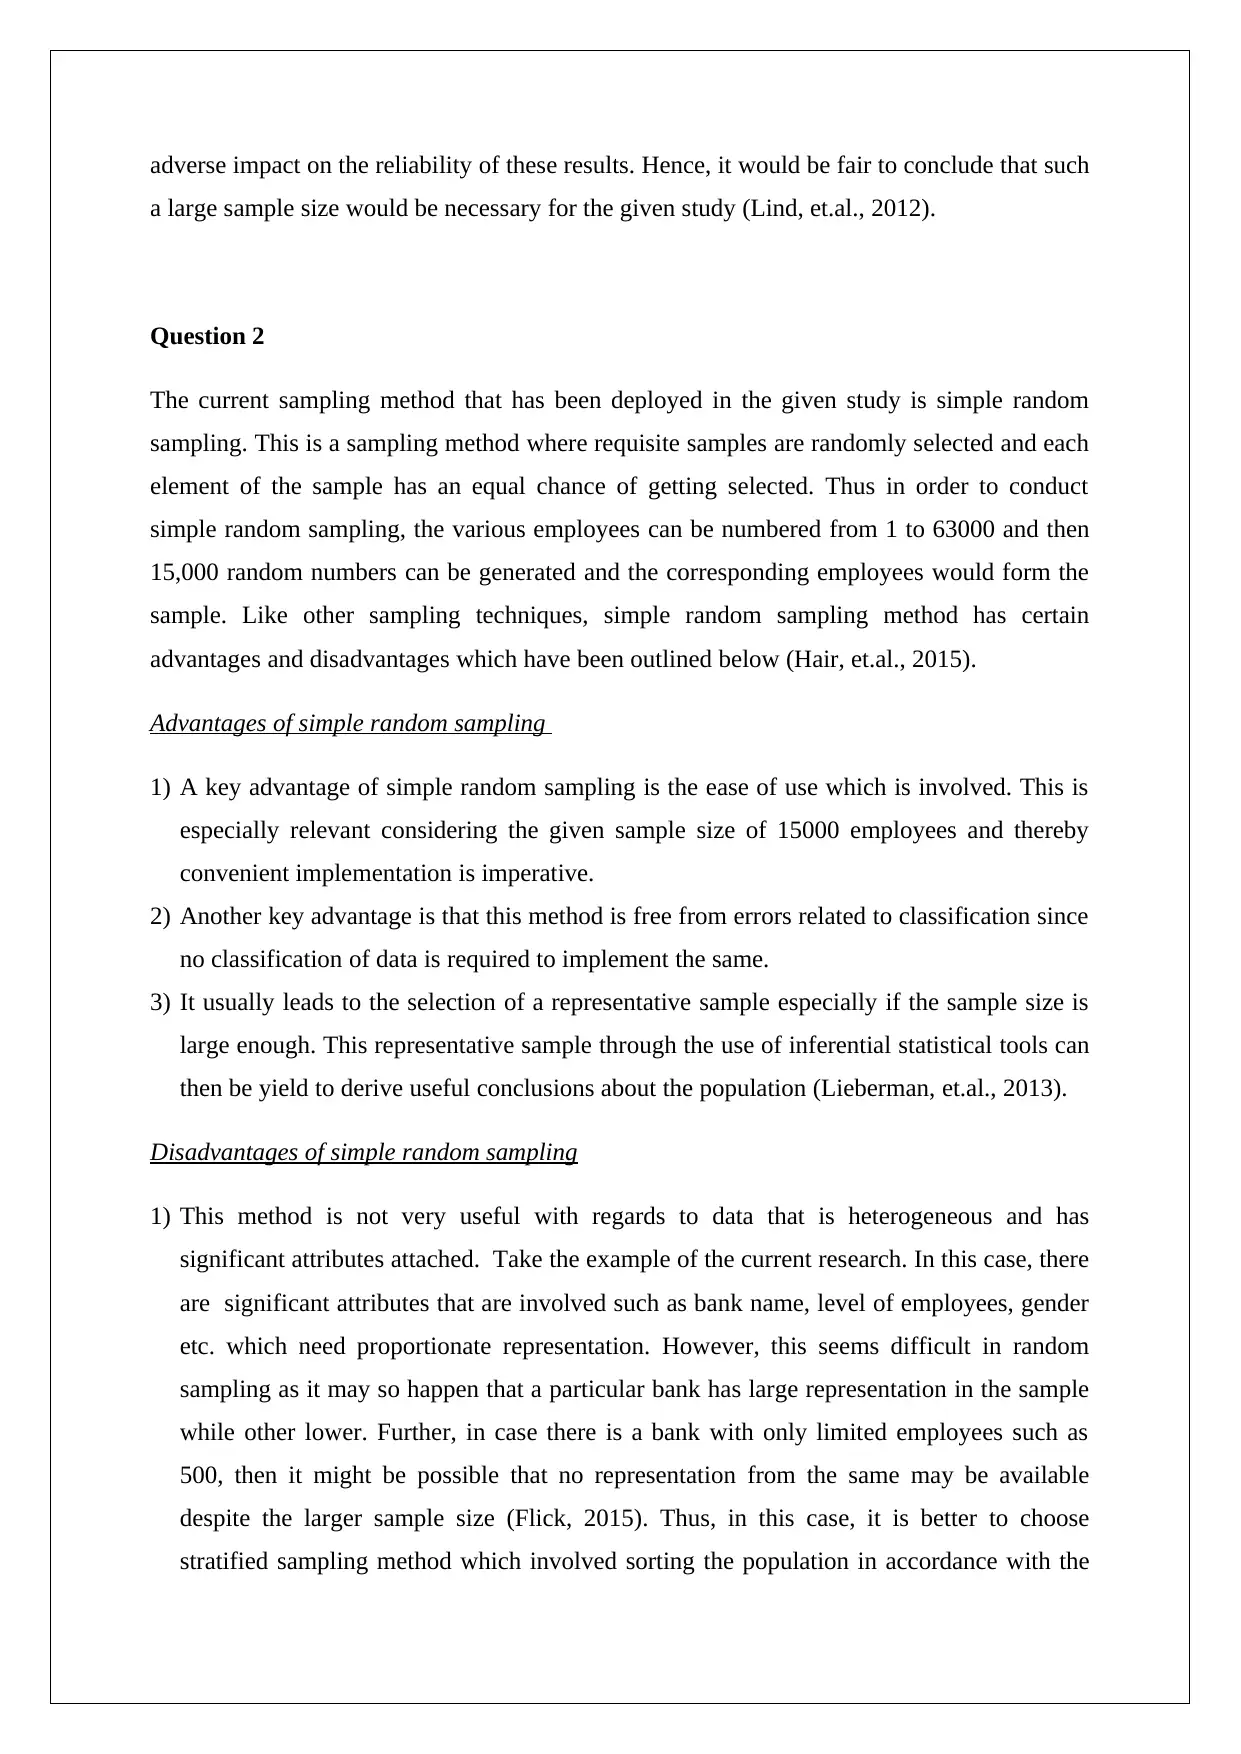
trade off, it is imperative that a suitable middle ground be attained. In this regards, the
following formula for minimum sample size is useful (Lind, et.al., 2012).
It is apparent from above that the minimum sample size depends on the level of accuracy
desired coupled with the level of heterogeneity in the population data. The higher the
heterogeneity level, higher would be the minimal sample required. MOE requires the margin
of error and the sample is inversely related to the square of the MOE (Flick, 2015).
For the given case, the population comprises of 69000 employees and out of these about 21%
employees or 15,000 employees have been chosen for the sample. The sample size does not
seem high to me considering that the underlying population seems to be heterogeneous
considering that in total this has employees from 63 banks and additionally different levels.
Hence, considering the number of organisations and levels involved, it makes sense to choose
a higher sample size as lower sample size can potentially lead to misrepresentation of some
banks and underrepresentation of others. Thus, these sampling errors can potentially have an
A key problem that researches often face is with regards to determining the sample size
which would be required for conducting the research. It should be noteworthy that the key
objective of the sampling process is that the chosen sample should be representative of the
actual population. As a general rule, it is better that a higher sample size is selected as it
enhances the chance of the sample being representative of the population even though this
depends on the underlying sampling method deployed. However, a higher sample size leads
to a smaller standard error which captures the difference between the population parameter
and sample statistic. But a key problem associated with a large sample is the high amount of
time and resources that would be required in collecting and analysing data collected from
such large sample (Hair, et.al., 2015).
Hence, the above theoretical discussion clearly reflects that there is an inherent trade off
involved with regards to sample size whereby on one side the higher sample size can
potentially deliver higher precision and accuracy but at a higher cost while on the other side a
lower sample size would lower the accuracy but the cost involved would be lesser. In this
trade off, it is imperative that a suitable middle ground be attained. In this regards, the
following formula for minimum sample size is useful (Lind, et.al., 2012).
It is apparent from above that the minimum sample size depends on the level of accuracy
desired coupled with the level of heterogeneity in the population data. The higher the
heterogeneity level, higher would be the minimal sample required. MOE requires the margin
of error and the sample is inversely related to the square of the MOE (Flick, 2015).
For the given case, the population comprises of 69000 employees and out of these about 21%
employees or 15,000 employees have been chosen for the sample. The sample size does not
seem high to me considering that the underlying population seems to be heterogeneous
considering that in total this has employees from 63 banks and additionally different levels.
Hence, considering the number of organisations and levels involved, it makes sense to choose
a higher sample size as lower sample size can potentially lead to misrepresentation of some
banks and underrepresentation of others. Thus, these sampling errors can potentially have an
adverse impact on the reliability of these results. Hence, it would be fair to conclude that such
a large sample size would be necessary for the given study (Lind, et.al., 2012).
Question 2
The current sampling method that has been deployed in the given study is simple random
sampling. This is a sampling method where requisite samples are randomly selected and each
element of the sample has an equal chance of getting selected. Thus in order to conduct
simple random sampling, the various employees can be numbered from 1 to 63000 and then
15,000 random numbers can be generated and the corresponding employees would form the
sample. Like other sampling techniques, simple random sampling method has certain
advantages and disadvantages which have been outlined below (Hair, et.al., 2015).
Advantages of simple random sampling
1) A key advantage of simple random sampling is the ease of use which is involved. This is
especially relevant considering the given sample size of 15000 employees and thereby
convenient implementation is imperative.
2) Another key advantage is that this method is free from errors related to classification since
no classification of data is required to implement the same.
3) It usually leads to the selection of a representative sample especially if the sample size is
large enough. This representative sample through the use of inferential statistical tools can
then be yield to derive useful conclusions about the population (Lieberman, et.al., 2013).
Disadvantages of simple random sampling
1) This method is not very useful with regards to data that is heterogeneous and has
significant attributes attached. Take the example of the current research. In this case, there
are significant attributes that are involved such as bank name, level of employees, gender
etc. which need proportionate representation. However, this seems difficult in random
sampling as it may so happen that a particular bank has large representation in the sample
while other lower. Further, in case there is a bank with only limited employees such as
500, then it might be possible that no representation from the same may be available
despite the larger sample size (Flick, 2015). Thus, in this case, it is better to choose
stratified sampling method which involved sorting the population in accordance with the
⊘ This is a preview!⊘
Do you want full access?
Subscribe today to unlock all pages.
Trusted by 1+ million students worldwide
key attributes that require representation. Once the sorting of data is done, then the sample
can be selected randomly in a manner that each requisite attribute has the same
representation in the sample as compared to the population.
2) The simple random sampling method can lead to higher standard error especially if the
population is not homogeneous and hence the stratified sampling is more suitable as has
been explained above (Lieberman, et.al., 2013).
Question 3
The discussion on the reliability and validity of the given variables is carried out as
highlighted below (Fehr, & Grossman, 2003).
Quantitative job insecurity – For the given variable, the reliability is measured
through the cronbach’s alpha which has a value of 0.89. Considering that a value
above 0.8 is considered to be quite acceptable for quantitative variables, hence for the
given variable reliability is not an issue. Thus, even when the study is repeated with
different sample, it would be expected to yield a comparable result for this particular
variable. In relation to the validity of the given variable, the measure seems objective
and has a basis in a previous study which implies that it can suitably measure the
given variable.
Qualitative job insecurity - For the given variable, the reliability is measured through
the cronbach’s alpha which has a value of 0.87. Considering that a value above 0.7 is
considered to be quite acceptable for qualitative variables, hence for the given
variable reliability is not an issue. Thus, even when the study is repeated with
different sample, it would be expected to yield a comparable result for this particular
variable. In relation to the validity of the given variable, the measure seems credible
considering the previous use of the items in reputed studies. Hence, neither reliability
nor validity is concern for this measure (Hair, et.al., 2015).
Psychological distress – The reliability is not an issue with this variable also as the
cronbach alpha is greater than 0.8. Hence, even if the study is repeated with a
different sample of participants, it would be expected that the result would be similar.
The validity of the 12 item measure is also present since the measure has been
previously used in a study. However, one concern may arise in relation to validity is
Paraphrase This Document
Need a fresh take? Get an instant paraphrase of this document with our AI Paraphraser
the relevance of the measure considering it was used in a study which dates back to
almost four decades. This hence needs to be considered.
Besides another measure used was job satisfaction which deploys the standard scale from
1 to 5 in term of increasing satisfaction levels. Hence, from the above discussion, it is
apparent that the given variables used in the study are both valid and reliable for the
underling purpose.
Question 4
It is apparent that the objective of the study is to highlight the potential association between
the qualitative and quantitative measures of well-being and job insecurity. However, it is
interesting to note that additional variables in the form of gender, age and education level
have also been considered. It makes sense to consider these variables as these are control
variables and the change in these could adversely impact the validity of the results obtained
from the study. It is imperative to note that the control variables are not the primary concern
of the researcher as the objective is to measure the relation between independent and
dependent variable. However, the control variables have the ability to alter or skew the
underlying relationship if kept unchecked. As a result, the researcher ensures that the control
variables are kept constant throughout the study so as to ensure that the underlying
relationship between the dependent and independent variables is not altered by these
variables (Medhi, 2001).
In the given study, the impact of change in these variables can easily be highlighted. For
instance consider the variable age. For employees with higher age, it is expected that the
quantitative measures would be more significant considering that after working for quite a
long period, the employees may not have the inclination to work at other places and also
might fear that they may not get a job easily. Further, these employees would be less
concerned with the qualitative measures of job dissatisfaction as over time, they would have
got used to the working conditions and associated policies of the organisation. For the
younger age, it would be expected that the qualitative measures of job dissatisfaction would
be comparatively more vital considering that they would have higher mobility in the job
market owing to their young age and adaptability. Their concern with the quantitative
variables would be comparatively less as they would be confident of securing employment
elsewhere (Medhi, 2001).
Similarly, the gender and education level would potentially make a huge difference. The
highly educated employees would have higher expectations and hence qualitative measures
of job dissatisfaction would be more critical considering the fact that they would have very
less trouble in finding another job. Hence their dissatisfaction with the quantitative measures
is comparatively lesser in comparison to the educated people. Further, considering the gender
roles, quantitative factors should be more significant for males since they tend to act as the
primary bread earner in most families. For the female employees, it is the qualitative
variables that are supposedly more pivotal. Hence, considering the above, it makes sense to
have these control variables so that valid results can be obtained between the requisite
variables of primary interest to the researcher (Hair, et.al., 2015).
Question 5
The research design that has been used for the given study is a correlational research design.
The various advantages and disadvantages associated with this research design are outlined
below.
Advantages of correlational research design
1) One advantage is that it allows the researchers to collect more data that in case of other
experimental studies. This is because the objective is to understand the trend and strength
o the association between the given variables and hence potential causal relationships
between different variables can be identified (Eriksson & Kovalainen, 2015).
2) Another advantage is that this design could serve as potential starting ground for other
researches which can then explore a particular aspect of the potential causal relation
between two given variables and explore the same in detail using a descriptive research
design.
3) Further, the correlational studies allow simplification of future studies since the direction
and strength of relation between given variables is determined which can then contribute
to model building and testing based on the results obtained from correlational research
design (Hillier, 2006).
Disadvantages of correlational research design
⊘ This is a preview!⊘
Do you want full access?
Subscribe today to unlock all pages.
Trusted by 1+ million students worldwide
1) One major disadvantage of correlation research design is that it merely discover the
direction and nature of association relationship but does not provide any conclusive
reason for the association observed. Also, the association relationship does not
automatically transfer into a causal relationship which is a key limitation. Additional
studies are required to build on the results that are derived from these studies.
2) These studies can only be used when there are two variables that can be measured on
a scale. Correlational studies cannot accommodate a higher number of variables for
which other research designs are required (Hastie, Tibshirani & Friedman, 2011).
Paraphrase This Document
Need a fresh take? Get an instant paraphrase of this document with our AI Paraphraser
References
Eriksson, P. & Kovalainen, A. (2015). Quantitative methods in business research (3rd ed.).
London: Sage Publications.
Fehr, F. H., & Grossman, G. (2003). An introduction to sets, probability and hypothesis
testing (3rd ed.). Ohio: Heath.
Flick, U. (2015). Introducing research methodology: A beginner's guide to doing a research
project (4th ed.). New York: Sage Publications.
Hair, J. F., Wolfinbarger, M., Money, A. H., Samouel, P., & Page, M. J. (2015). Essentials of
business research methods (2nd ed.). New York: Routledge.
Hastie, T., Tibshirani, R. & Friedman, J. (2011). The Elements of Statistical Learning (4th
ed.). New York: Springer Publications.
Hillier, F. (2006). Introduction to Operations Research. (6th ed.). New York: McGraw Hill
Publications.
Lieberman, F. J., Nag, B., Hiller, F.S. & Basu, P. (2013). Introduction To Operations
Research (5th ed.). New Delhi: Tata McGraw Hill Publishers.
Lind, A.D., Marchal, G.W. & Wathen, A.S. (2012). Statistical Techniques in Business and
Economics (15th ed.). New York : McGraw-Hill/Irwin.
Medhi, J. (2001). Statistical Methods: An Introductory Text (4th ed.). Sydney: New Age
International.

⊘ This is a preview!⊘
Do you want full access?
Subscribe today to unlock all pages.
Trusted by 1+ million students worldwide
1 out of 9
Related Documents


Your All-in-One AI-Powered Toolkit for Academic Success.
+13062052269
info@desklib.com
Available 24*7 on WhatsApp / Email
![[object Object]](/_next/static/media/star-bottom.7253800d.svg)
Unlock your academic potential
Copyright © 2020–2026 A2Z Services. All Rights Reserved. Developed and managed by ZUCOL.