Research Methods Assignment: Measurement, Stats, and SPSS Analysis
VerifiedAdded on 2023/01/11
|7
|1519
|64
Homework Assignment
AI Summary
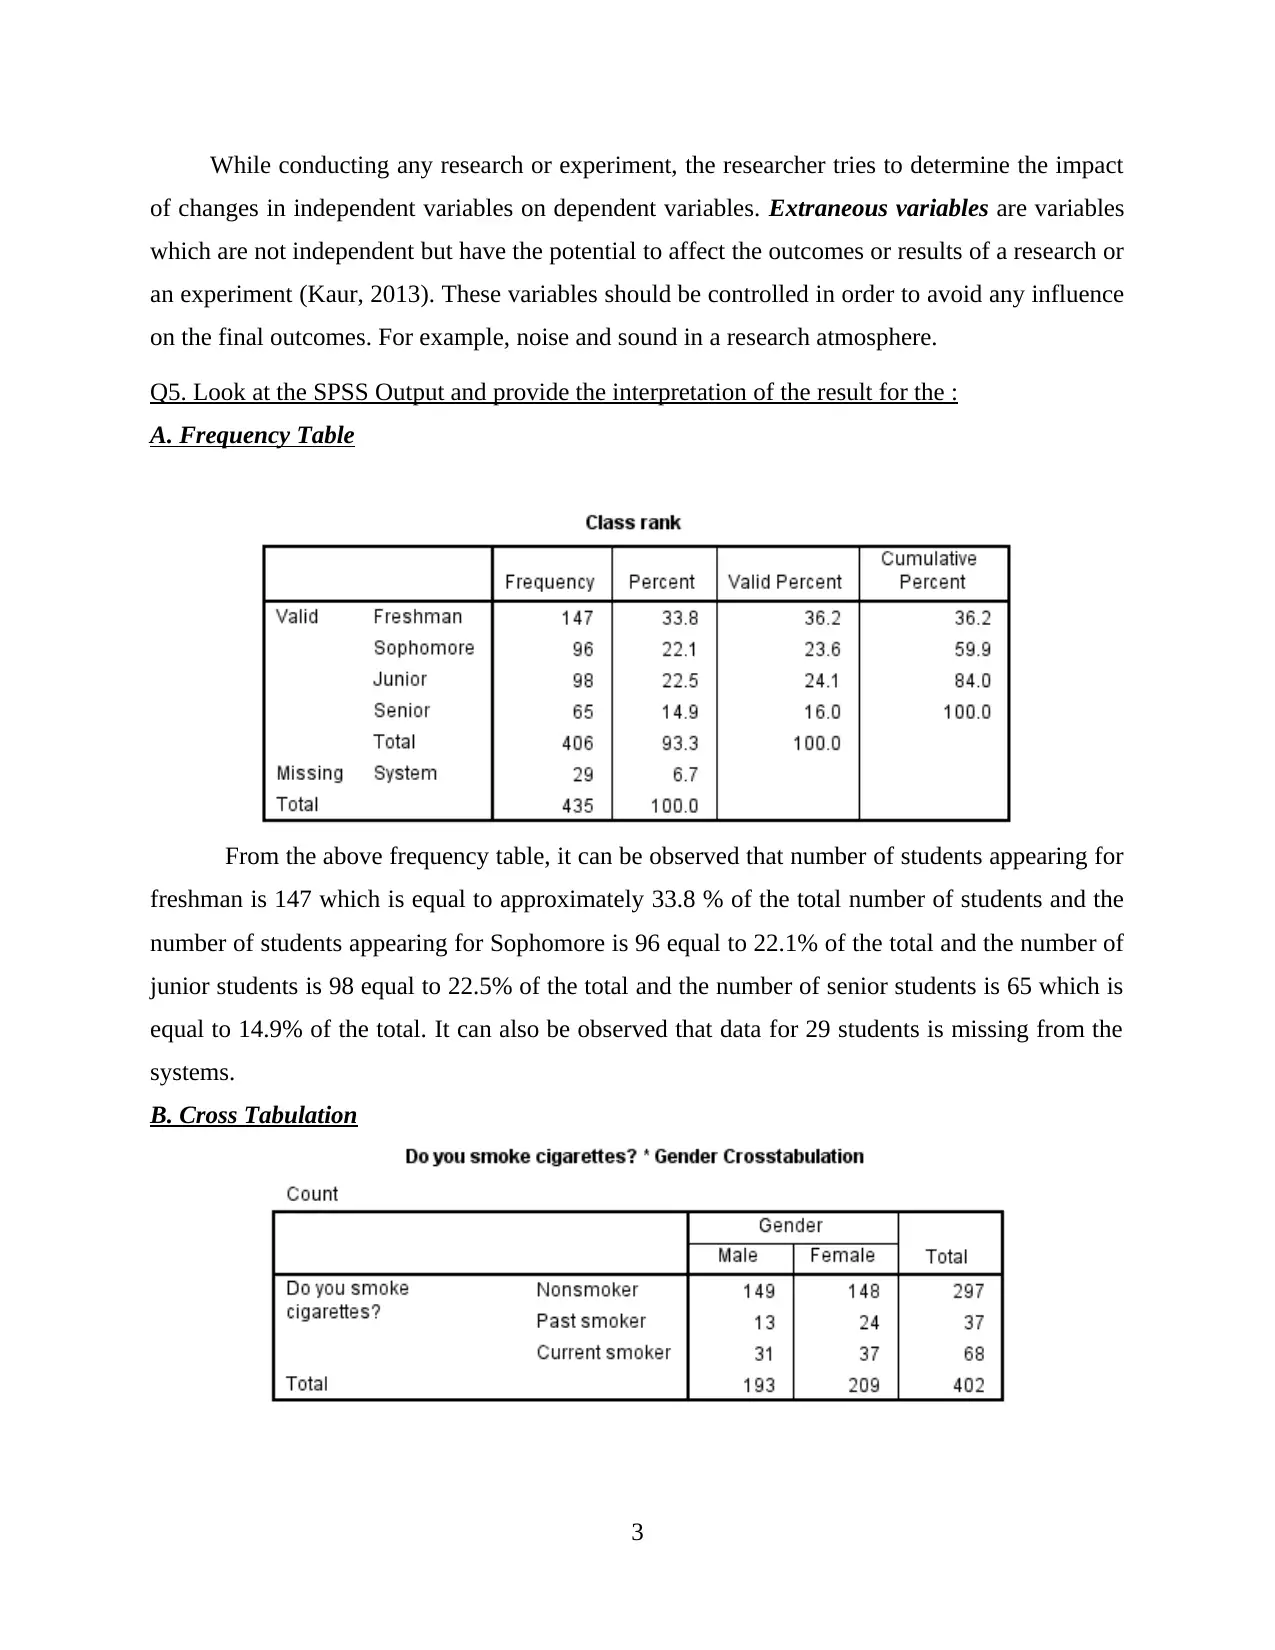
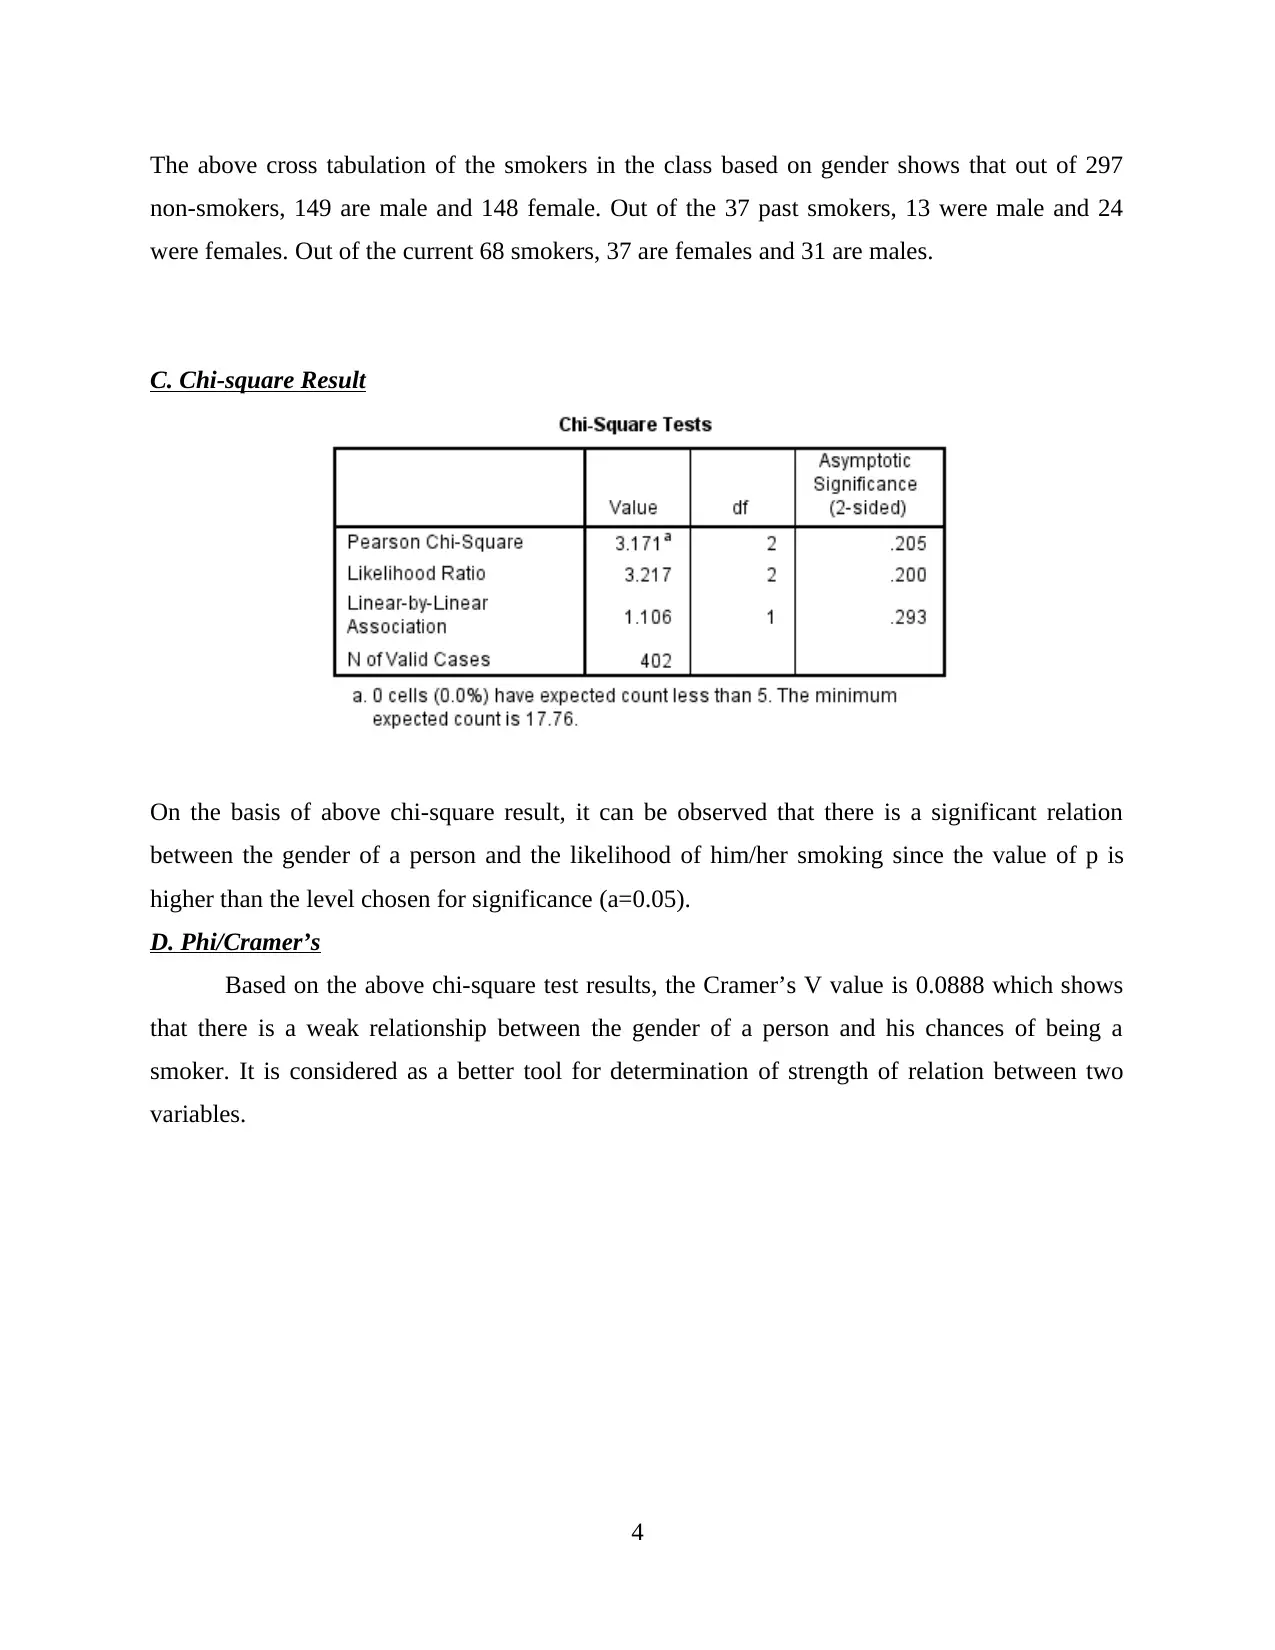
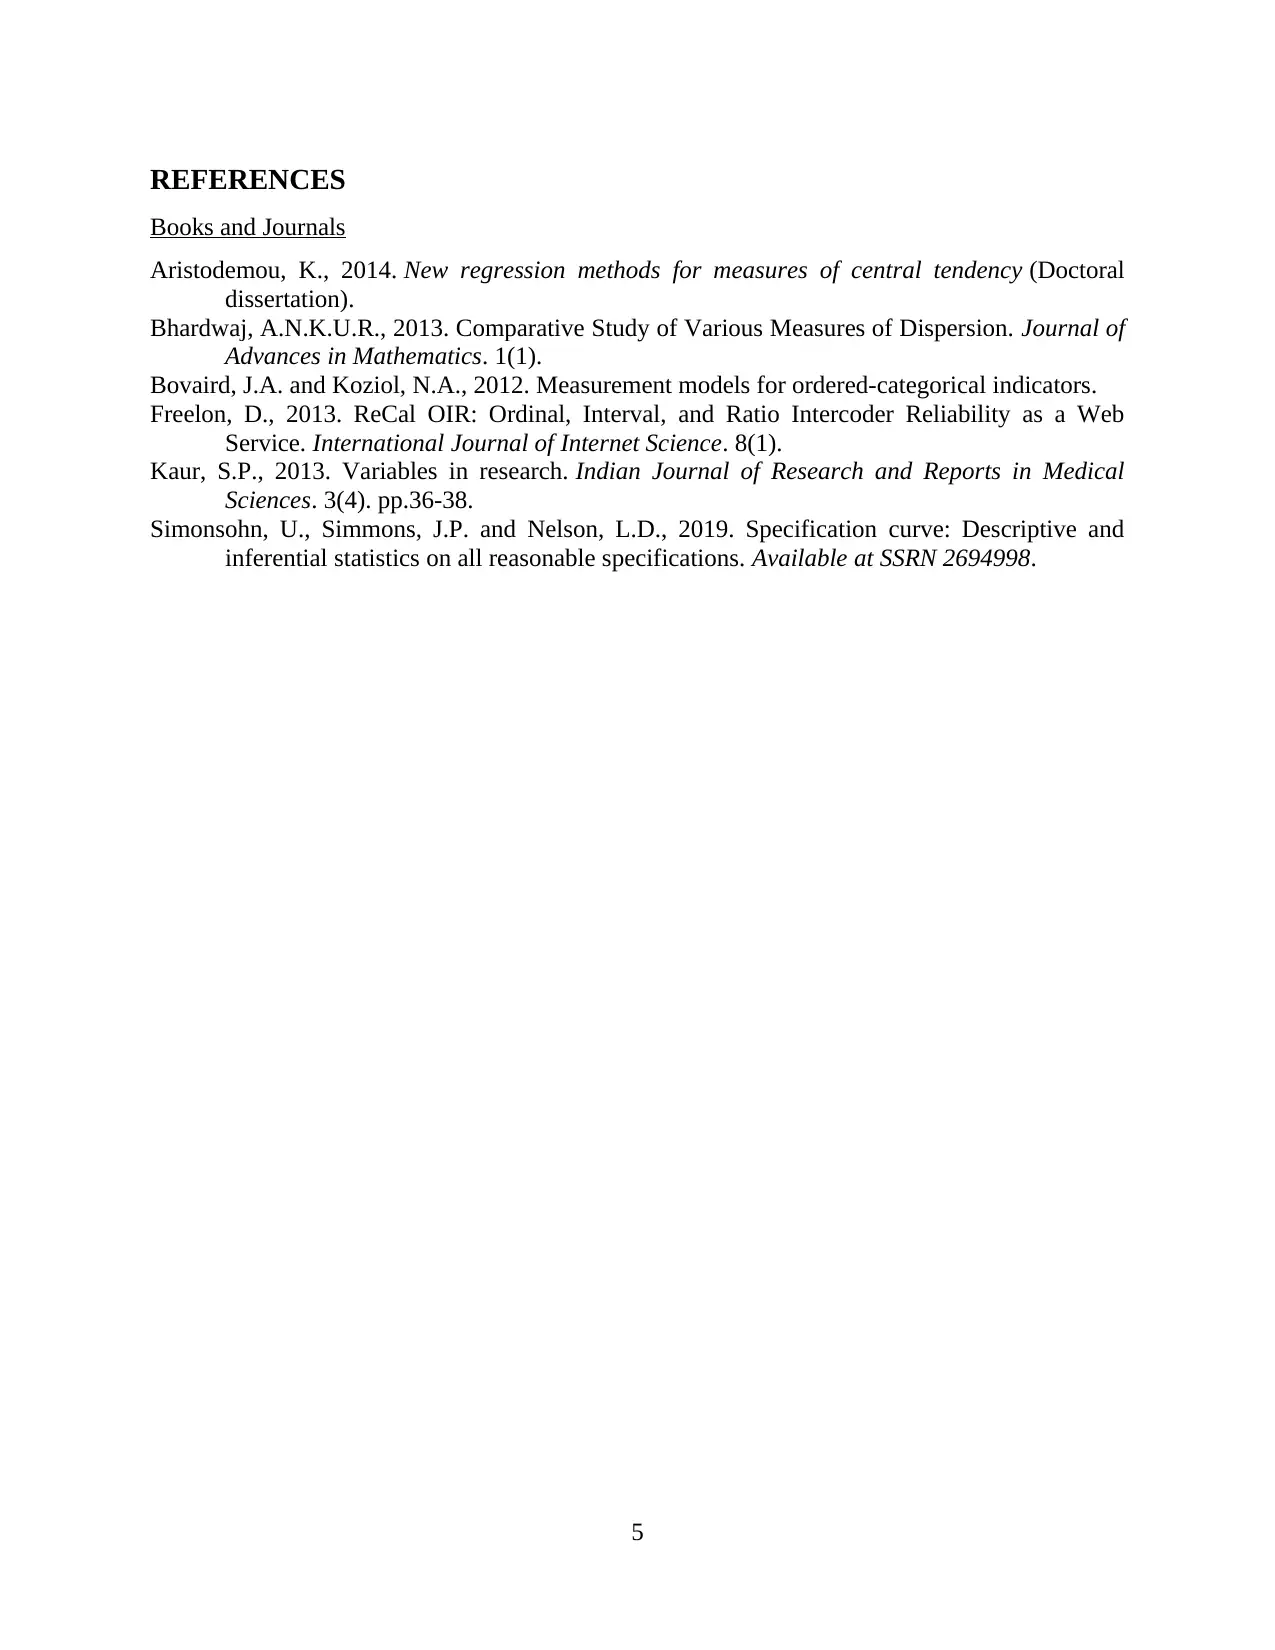
This research methods assignment addresses key concepts in research methodology. It begins by defining and explaining the four levels of measurement: nominal, ordinal, interval, and ratio, providing examples for each. The assignment then clarifies the meaning of measures of central tendency (mean, median, mode) and dispersion (range, standard deviation, variance). A crucial distinction between descriptive and inferential statistics is made. The assignment further defines and explains key terms such as hypothesis, null hypothesis, independent and dependent variables, and extraneous variables. Finally, the assignment provides an interpretation of SPSS output, including frequency tables, cross-tabulation, chi-square results, and Phi/Cramer's V, offering insights into the relationships between variables, such as gender and smoking habits. The document includes a list of cited references.

Research Methods
Paraphrase This Document
Need a fresh take? Get an instant paraphrase of this document with our AI Paraphraser

Contents
TASK...............................................................................................................................................1
Q1. Identify and explain the four levels of measurement, giving an example of each one.........1
Q2. Explain what is meant by Measures of Central Tendency and Measures of Dispersion......1
Q3. What is the difference between Descriptive Statistics and Inferential Statistics?................2
Q4. Explain the following terms:.................................................................................................2
Q5. Look at the SPSS Output and provide the interpretation of the result for the :....................3
REFERENCES................................................................................................................................5

TASK
Q1. Identify and explain the four levels of measurement, giving an example of each one.
Any variable can be measured with the help of using four different levels of measurement
which are being described as follows:
Nominal: In the first measurement level which is nominal measurement, numbers are used
as tags or labels for identification or classification of a data. In this type of measurement, the
numbers don’t serve any purpose other than identification of the data (Bovaird and Koziol,
2012). For example, numbers may be used to identify a particular student from a group of 5
students participating in a race but the number here doesn’t represent any characteristic of the
student.
Ordinal: Ordinal measurement is the second level of measurement which is used to
describe a particular order or ranking between a group of variables. However, it doesn’t specify
the degree of variation between the variables. For example, in a class of 10 students, a student
who scored highest marks in a test can be ranked using number 1 and the student who scored
least marks can be ranked using number 10. Here, the numbers are not only used for
identification but also gives information about the relative marks scored by a student in a test.
Interval: Interval measurement is not only used for identification and ordering of the
variables but also presents information about the difference between the numbers which are used
for interval measurement is equal between adjacent categories. For example, in the Fahrenheit
scale of temperature, the difference of 1 degree between 47 and 48 degrees is equivalent to the
difference of 1 degree between 60 and 61 degrees.
Ratio: Ratio level of measurement is considered to be the most informative because it
helps in identification, also provides ranking, also denotes the same difference between two
intervals and in addition it also has a zero point or position (Freelon, 2013). The zero relates to
the absence of the variable. For example, a person has money in his pocket which can be 50
Euros, 60 Euros or zero. The zero here represents the absence of money or no money with the
person.
Q2. Explain what is meant by Measures of Central Tendency and Measures of Dispersion.
Measures of central tendency refers to a set of statistical tools such as mean, median or mode
which provides information about the middle or central value of a set of data or distribution
1
⊘ This is a preview!⊘
Do you want full access?
Subscribe today to unlock all pages.

Trusted by 1+ million students worldwide

(Aristodemou, 2014). It helps in determination of the central point or the point where most of the
values in a given set of data or distribution falls. For example, mode represents the value or the
variable which has the highest frequency or appears the most number of times in a data.
Measures of dispersion refers to the set of statistical tools such as range, standard deviation or
variance which provides information about the dispersion or the scattering of a dataset or
distribution (Bhardwaj, 2013). It helps in determining the variation of values in a data set from
each other and from the central value or the mean. For example, range of a data represents the
difference between the highest value in the data and the smallest value in the data.
Q3. What is the difference between Descriptive Statistics and Inferential Statistics?
One of the most important difference between descriptive and inferential statistics is the
fact that Descriptive Statistics provides information or describes a given set of data or
distribution. For example, the height of students in a class of 30 students. Whereas, Inferential
statistics involves collection of a data from any given sample and on the basis of characteristics
of the sample, it makes inferences related to the larger population where the data or sample was
obtained from (Simonsohn, Simmons and Nelson, 2019). For example, making inferences about
the preference of population to shop from a particular brand based on a sample size of 100
people.
Q4. Explain the following terms:
A. The hypothesis and null hypothesis
A hypothesis is a theory or an argument which has been put forward by a researcher and
lacks evidence and upon further testing and experiments, it can either proved to be false or true.
Whereas, A Null hypothesis is a hypothesis which puts forward the argument that the two
variables in the hypothesis are insignificant to each other and there is no connection between
them. A researches tries to disprove the null hypothesis.
B. Independent and dependent variable
An independent variable is a variable which doesn’t change or alter as a result of
changes in other variables in the function where as a dependent variable alters or adjusts itself
according to the changes in other variables or factors. For example, the age of a person can be
termed as an independent variable and their habits such as eating junk can be termed as
dependent variable.
C. Extraneous variables
2
Paraphrase This Document
Need a fresh take? Get an instant paraphrase of this document with our AI Paraphraser

While conducting any research or experiment, the researcher tries to determine the impact
of changes in independent variables on dependent variables. Extraneous variables are variables
which are not independent but have the potential to affect the outcomes or results of a research or
an experiment (Kaur, 2013). These variables should be controlled in order to avoid any influence
on the final outcomes. For example, noise and sound in a research atmosphere.
Q5. Look at the SPSS Output and provide the interpretation of the result for the :
A. Frequency Table
From the above frequency table, it can be observed that number of students appearing for
freshman is 147 which is equal to approximately 33.8 % of the total number of students and the
number of students appearing for Sophomore is 96 equal to 22.1% of the total and the number of
junior students is 98 equal to 22.5% of the total and the number of senior students is 65 which is
equal to 14.9% of the total. It can also be observed that data for 29 students is missing from the
systems.
B. Cross Tabulation
3

The above cross tabulation of the smokers in the class based on gender shows that out of 297
non-smokers, 149 are male and 148 female. Out of the 37 past smokers, 13 were male and 24
were females. Out of the current 68 smokers, 37 are females and 31 are males.
C. Chi-square Result
On the basis of above chi-square result, it can be observed that there is a significant relation
between the gender of a person and the likelihood of him/her smoking since the value of p is
higher than the level chosen for significance (a=0.05).
D. Phi/Cramer’s
Based on the above chi-square test results, the Cramer’s V value is 0.0888 which shows
that there is a weak relationship between the gender of a person and his chances of being a
smoker. It is considered as a better tool for determination of strength of relation between two
variables.
4
⊘ This is a preview!⊘
Do you want full access?
Subscribe today to unlock all pages.

Trusted by 1+ million students worldwide

REFERENCES
Books and Journals
Aristodemou, K., 2014. New regression methods for measures of central tendency (Doctoral
dissertation).
Bhardwaj, A.N.K.U.R., 2013. Comparative Study of Various Measures of Dispersion. Journal of
Advances in Mathematics. 1(1).
Bovaird, J.A. and Koziol, N.A., 2012. Measurement models for ordered-categorical indicators.
Freelon, D., 2013. ReCal OIR: Ordinal, Interval, and Ratio Intercoder Reliability as a Web
Service. International Journal of Internet Science. 8(1).
Kaur, S.P., 2013. Variables in research. Indian Journal of Research and Reports in Medical
Sciences. 3(4). pp.36-38.
Simonsohn, U., Simmons, J.P. and Nelson, L.D., 2019. Specification curve: Descriptive and
inferential statistics on all reasonable specifications. Available at SSRN 2694998.
5
1 out of 7
Related Documents
Your All-in-One AI-Powered Toolkit for Academic Success.
+13062052269
info@desklib.com
Available 24*7 on WhatsApp / Email
Unlock your academic potential
Copyright © 2020–2025 A2Z Services. All Rights Reserved. Developed and managed by ZUCOL.

