MGT723 Research Project: Data Collection and Analysis Report - 2XXX

Verified

Added on  2021/06/18

|7
|1807
|128
Report
AI Summary
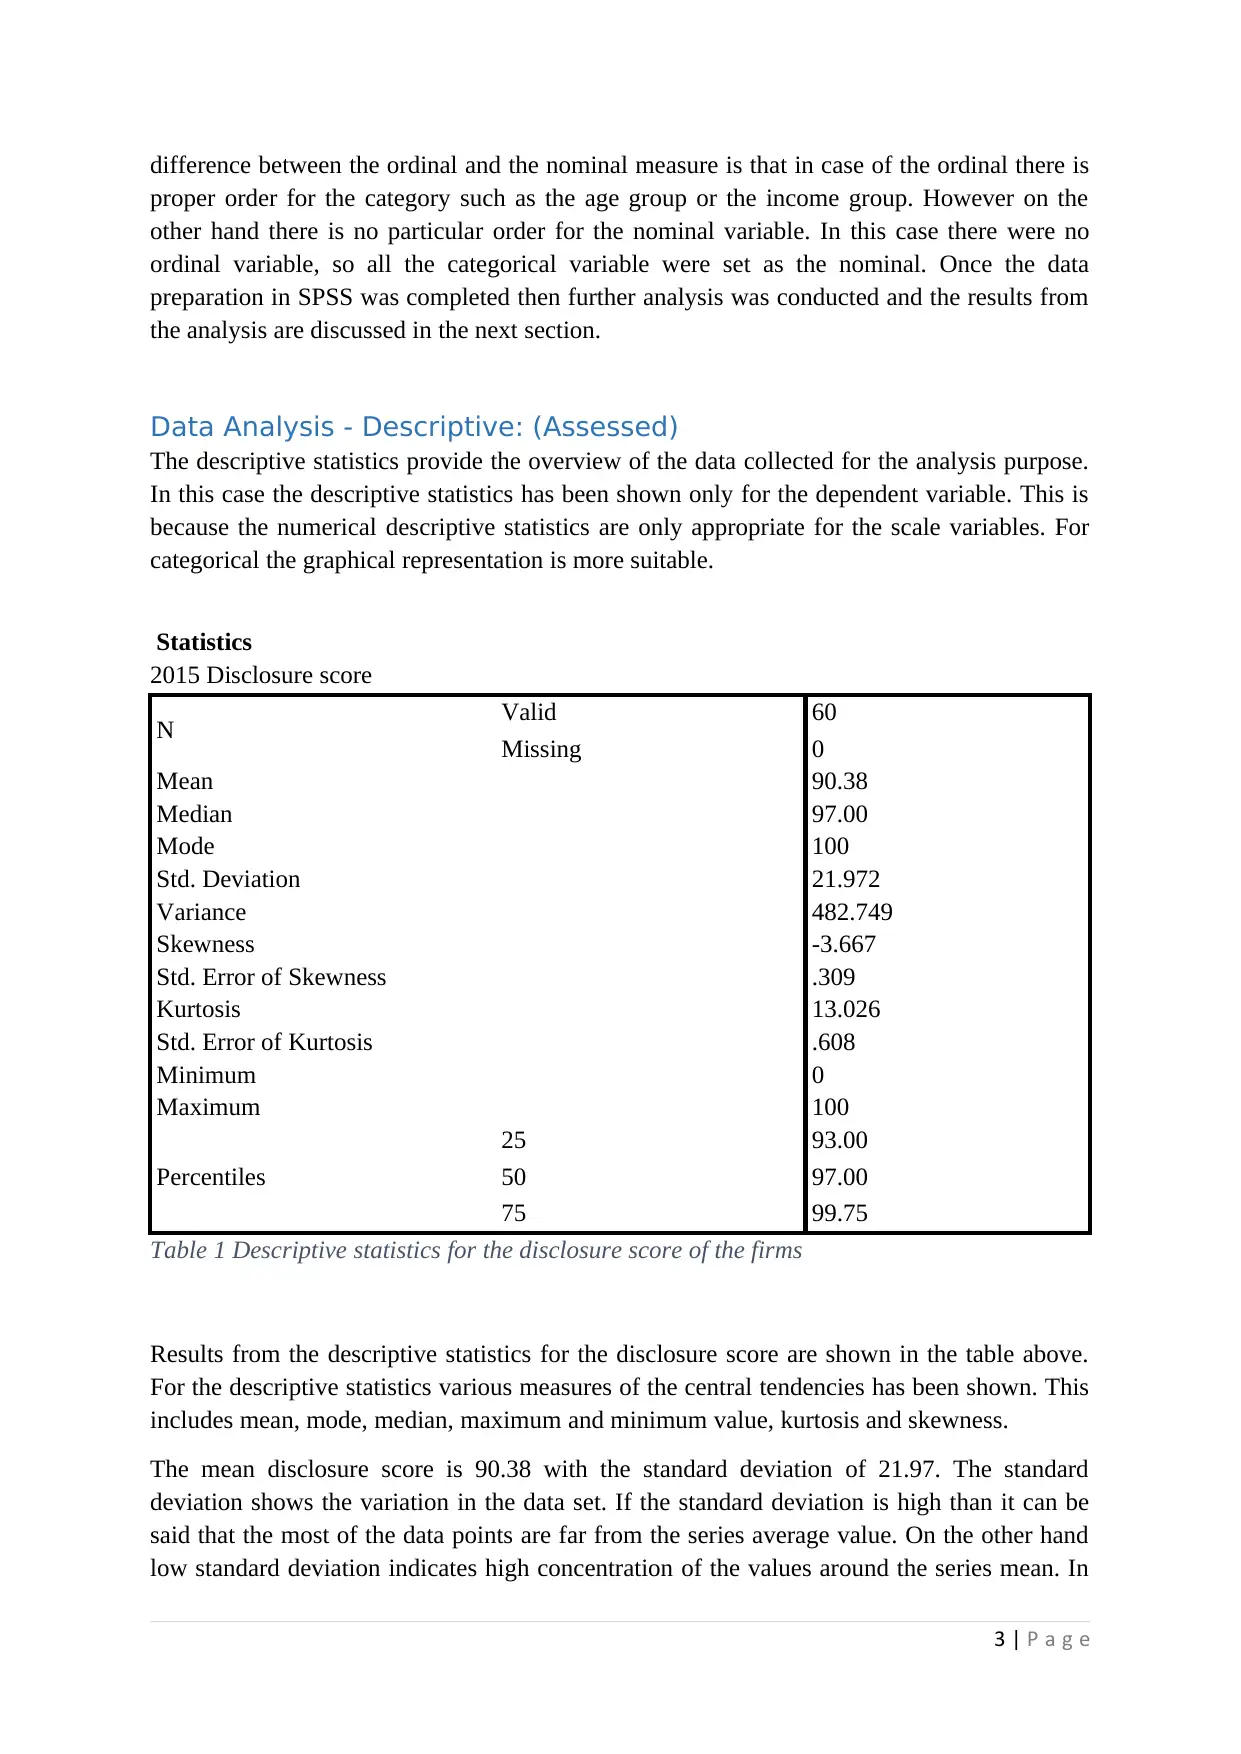
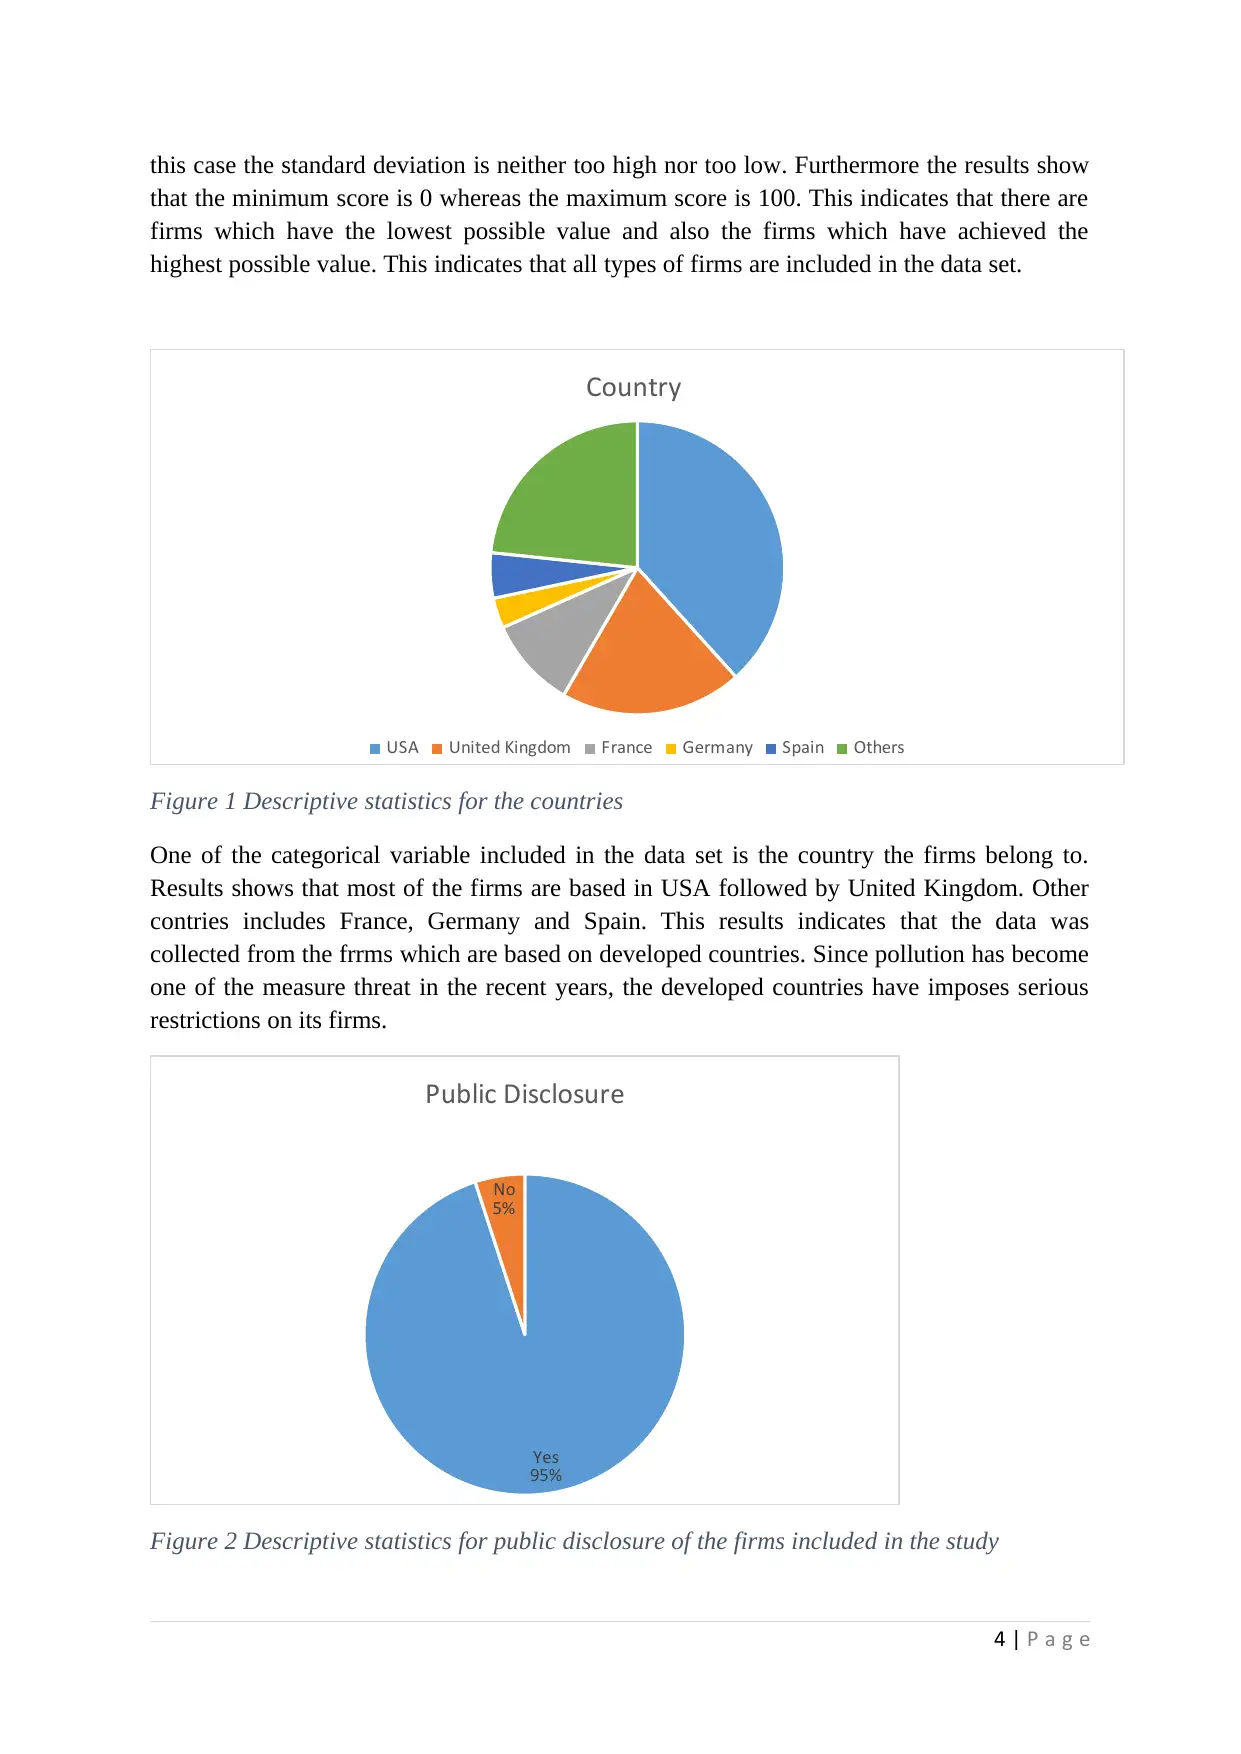
This report presents the data collection and analysis for a research project (MGT723) examining the relationship between board effectiveness and voluntary carbon disclosure. The study utilizes secondary data from 60 firms across different countries and industries, employing random sampling to ensure generalizability. The data underwent cleaning and processing, including handling missing values. The report details the descriptive statistics of the disclosure score, showing measures of central tendency and distribution. It also includes descriptive statistics for categorical variables such as country, public disclosure, and the highest level of direct responsibility. Inferential analysis involves chi-square tests to examine differences in disclosure scores across countries and correlation analysis to investigate the relationship between the disclosure score and the highest level of direct responsibility. The results indicate no statistically significant difference in disclosure scores across countries, and a positive, but not strong, correlation between disclosure score and board responsibility. The report concludes with an interpretation of the findings and implications for further research.
Document Page
MGT723 Research Project
Semester X 2XXX
Assessment Task 2: Data Collection
Student Name:
Title:
Submission Date:
Acknowledgement:
I certify that I have carefully reviewed the university’s academic misconduct policy. I understand that
the source of ideas must be referenced and that quotation marks and a reference are required when
directly quoting anyone else’s words.
tabler-icon-diamond-filled.svg

Paraphrase This Document

Need a fresh take? Get an instant paraphrase of this document with our AI Paraphraser
Document Page
Introduction: (Not assessed)
What is your research problem?
Literature Review – Summary (Not Assessed)
Provide your summary (maximum 1 page) of the theoretical argument leading to the conceptual
model with theoretical constructs clearly identified.
Conceptual Model: (Not Assessed)
Provide a diagram to show the relationships between the key theoretical constructs.
Hypotheses: (Not assessed)
Indicate your hypotheses – they will be assessed in your Assessment Task 1 for ACC620.
Data Collection (Assessed)
The main aim of the current research is to examine the relationship between the effectiveness
of the Board and the Voluntary Disclosure of the carbon causing the climate change. For the
analysis purpose the secondary data has been collected for 60 firms in different countries in
different industries. For selecting the data from the master file random sampling method was
used so that the sample is not biased and the results from the analysis can be generalized to
the entire population.
Data processing and missing values
Once the final sample from the master data has been extracted, it was an important task to
clean the data so that the robust results can be obtained. For the data processing the sample
data was extracted to the a new excel sheet. The data set contains huge amount of
information, so first only the required variables were retained and rest of the variables were
removed from the final data. The variables which were retained include the voluntary
disclosure score (dependent variable), highest body making the decision for voluntary
disclosure (independent variable) and other control variable such as the name of the country
and the whether the disclosure has been made or not. After the variables were short listed the
missing data part was addressed. There were missing data for the independent variable and
the missing data were coded as -99 so that it can be easily identified. Once the data has been
cleaned the data was imported to SPSS for further analysis.
Once the data was imported to SPSS the name of the variable was given as per the excel
sheet. Similarly the scale of the variables was set accordingly. For example the disclosure
score is the continuous variable so the scale measure was set for this variable. For the
categorical variable it can be either the nominal variable or the ordinal variable. The only
2 | P a g e
Document Page
difference between the ordinal and the nominal measure is that in case of the ordinal there is
proper order for the category such as the age group or the income group. However on the
other hand there is no particular order for the nominal variable. In this case there were no
ordinal variable, so all the categorical variable were set as the nominal. Once the data
preparation in SPSS was completed then further analysis was conducted and the results from
the analysis are discussed in the next section.
Data Analysis - Descriptive: (Assessed)
The descriptive statistics provide the overview of the data collected for the analysis purpose.
In this case the descriptive statistics has been shown only for the dependent variable. This is
because the numerical descriptive statistics are only appropriate for the scale variables. For
categorical the graphical representation is more suitable.
Statistics
2015 Disclosure score
N Valid 60
Missing 0
Mean 90.38
Median 97.00
Mode 100
Std. Deviation 21.972
Variance 482.749
Skewness -3.667
Std. Error of Skewness .309
Kurtosis 13.026
Std. Error of Kurtosis .608
Minimum 0
Maximum 100
Percentiles
25 93.00
50 97.00
75 99.75
Table 1 Descriptive statistics for the disclosure score of the firms
Results from the descriptive statistics for the disclosure score are shown in the table above.
For the descriptive statistics various measures of the central tendencies has been shown. This
includes mean, mode, median, maximum and minimum value, kurtosis and skewness.
The mean disclosure score is 90.38 with the standard deviation of 21.97. The standard
deviation shows the variation in the data set. If the standard deviation is high than it can be
said that the most of the data points are far from the series average value. On the other hand
low standard deviation indicates high concentration of the values around the series mean. In
3 | P a g e
Document Page
this case the standard deviation is neither too high nor too low. Furthermore the results show
that the minimum score is 0 whereas the maximum score is 100. This indicates that there are
firms which have the lowest possible value and also the firms which have achieved the
highest possible value. This indicates that all types of firms are included in the data set.
Country
USA United Kingdom France Germany Spain Others
Figure 1 Descriptive statistics for the countries
One of the categorical variable included in the data set is the country the firms belong to.
Results shows that most of the firms are based in USA followed by United Kingdom. Other
contries includes France, Germany and Spain. This results indicates that the data was
collected from the frrms which are based on developed countries. Since pollution has become
one of the measure threat in the recent years, the developed countries have imposes serious
restrictions on its firms.
Yes
95%
No
5%
Public Disclosure
Figure 2 Descriptive statistics for public disclosure of the firms included in the study
4 | P a g e
tabler-icon-diamond-filled.svg

Paraphrase This Document

Need a fresh take? Get an instant paraphrase of this document with our AI Paraphraser
Document Page
One of the variable included was whether the firms make the public disclosure or not. As
shown in the figure above, results shows that 95 % of the firms disclose the score publicly.
9%
91%
Highest level of direct responsbility
Senior manager
Board
Figure 3 Descriptive statistics for the highest level of direct responsibility
One of the important variable of interest in the current research is the highest level of direct
responsibility for the disclosure. As shown in the figure above the highest body 91 % of the
firms is board and only for the 9 % it is the senior manager. This indicates that the directly
responsibility is of board which is the highest decision making body for any organization.
This also shows how serious the problem of climate change has become.
Inferential analysis
For the inferential analysis the chi square test and the correlation analysis has been conducted
and the results from the each analysis has been discussed below.
Chi square test
The chi square test is used to examine whether there is any statistical difference between the
mean values of the dependent variable for different categories. So in this case at least one of
the variable should be the categorical variable. In the current case, chi square has been
conducted to examine whether there is statistically significant difference in the disclosure
score for different countries. Results from the analysis are shown in the table below.
Chi-Square Tests
Value df Asymp. Sig.
(2-sided)
Pearson Chi-Square 74.059a 80 .666
5 | P a g e
Document Page
Likelihood Ratio 75.370 80 .626
Linear-by-Linear
Association
.830 1 .362
N of Valid Cases 60
a. 101 cells (99.0%) have expected count less than 5. The
minimum expected count is .03.
Table 2 Results from the chi square test
As shown in the above table the chi square value of 74.059 with 80 degrees of freedom is not
statistically significant. This is because the p value is more than 0.05. So the null hypothesis
cannot be rejected. In other words there is no statistically significant difference in the
disclosure for firms in different countries. In other words, all the countries included in the
study have similar disclosure score. This is may be because all the countries are developed
and they have similar type of regulations for disclosure.
Symmetric Measures
Value Approx.
Sig.
Nominal by
Nominal
Phi 1.111 .666
Cramer's
V
.497 .666
N of Valid Cases 60
Table 3 Results from the chi square test
Furthermore the results from the symmetric measures also shows that the significance value
are more than 0.05 so the null hypothesis can be rejected.
Data Analysis - Inferential: (Assessed)
Correlation analysis
The correlation analysis is conducted to investigate how the two variable are related. The
variable can be either positively related or negatively. If the variables moves in the same
direction then it can be said that they are positively related whereas if they move in different
direction, then the coefficient is negative. The value of the correlation coefficient lies
between -1 and +1. Coefficients close to +1 indicated significant and positive correlation
between the two variables. Whereas on the other hand correlation coefficient close to -1
indicates negative and strong correlation etween the two values.
For the current research also to examine the relationship between the disclosure score and the
highest level of direct responsibility the correlation analysis was conducted and the results are
shown in the table below.
6 | P a g e
Document Page
Correlations
Public
Disclosure
Highest level
of direct
responsibilty
2015
Disclosure
score
Public Disclosure
Pearson
Correlation
1 -.276* -.952**
Sig. (2-tailed) .041 .000
N 60 55 60
Highest level of direct
responsibilty
Pearson
Correlation
-.276* 1 .243
Sig. (2-tailed) .041 .074
N 55 55 55
2015 Disclosure score
Pearson
Correlation
-.952** .243 1
Sig. (2-tailed) .000 .074
N 60 55 60
*. Correlation is significant at the 0.05 level (2-tailed).
**. Correlation is significant at the 0.01 level (2-tailed).
Table 4 Results from correlation analysis
The correlation matrix suggests that the correlation coefficient between the dependent and the
independent variable is 0.243. This indicates that there exists a positive relationship between
the two variables. However the coefficient is not very strong, as the coefficient is not close to
1. This indicates that if the board member of the firms decide to disclose the score then the
score is high, whereas sometimes the board’s decision to not publish the score negatively
affect the disclosure score. Correlation coefficients of other variables are also shown in the
table above and they can also be interpreted in similar way.
7 | P a g e
chevron_up_icon
1 out of 7
circle_padding
hide_on_mobile
zoom_out_icon
[object Object]