Research Report: Data Collection, Design, and Analysis
VerifiedAdded on 2023/06/03
|24
|3049
|393
Report
AI Summary
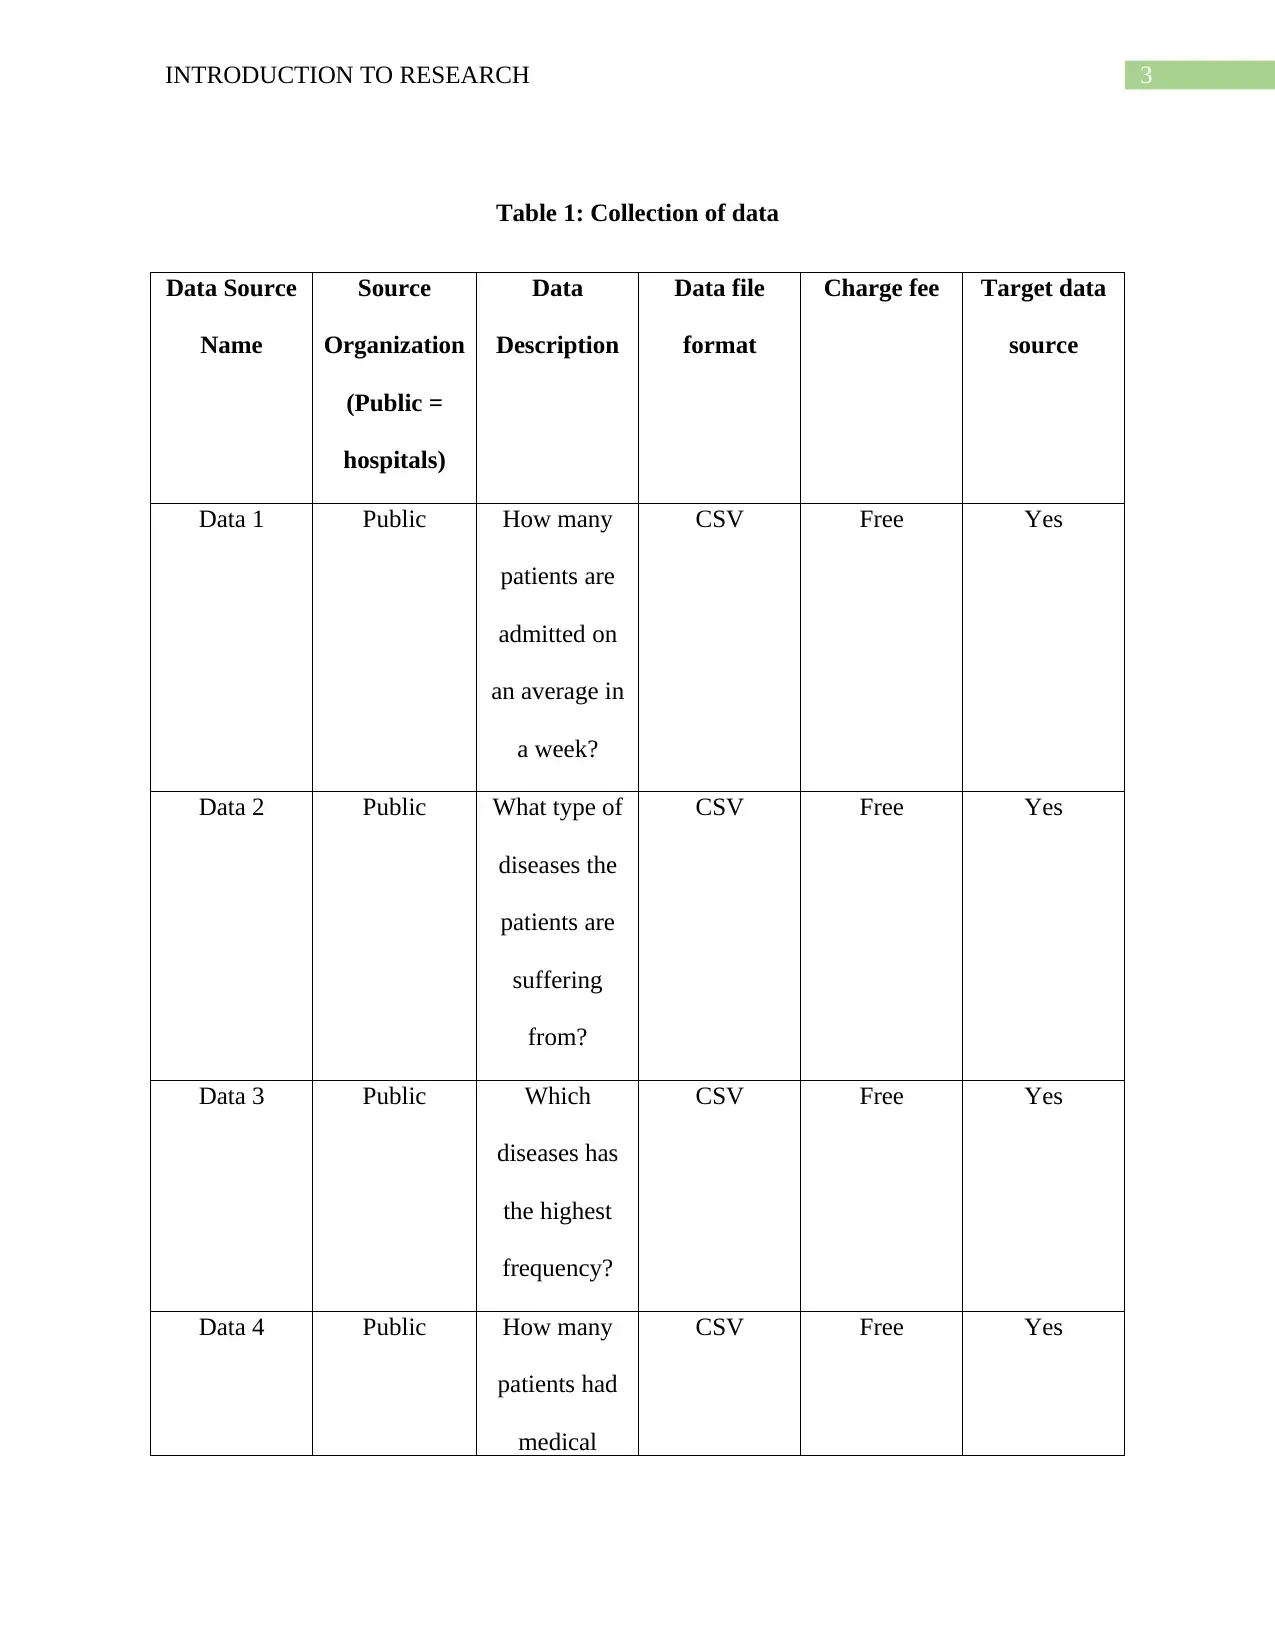
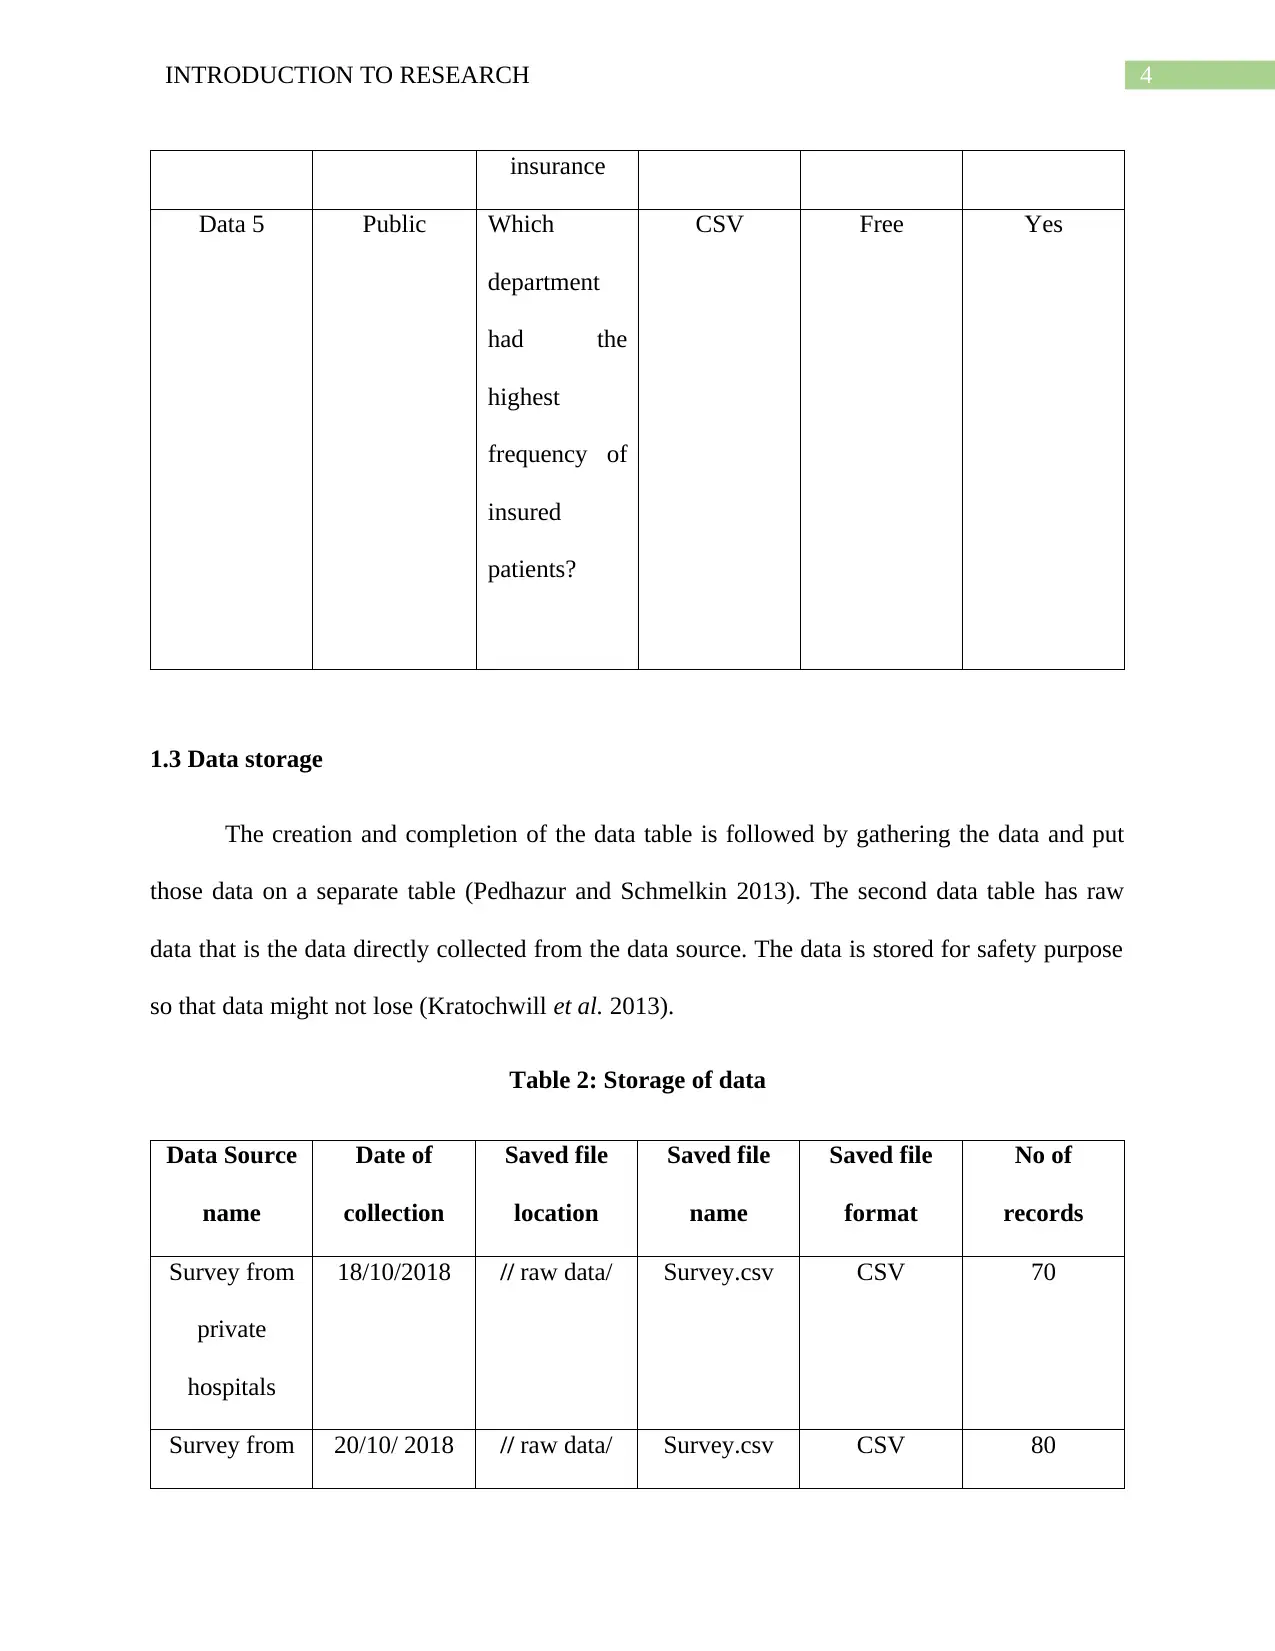
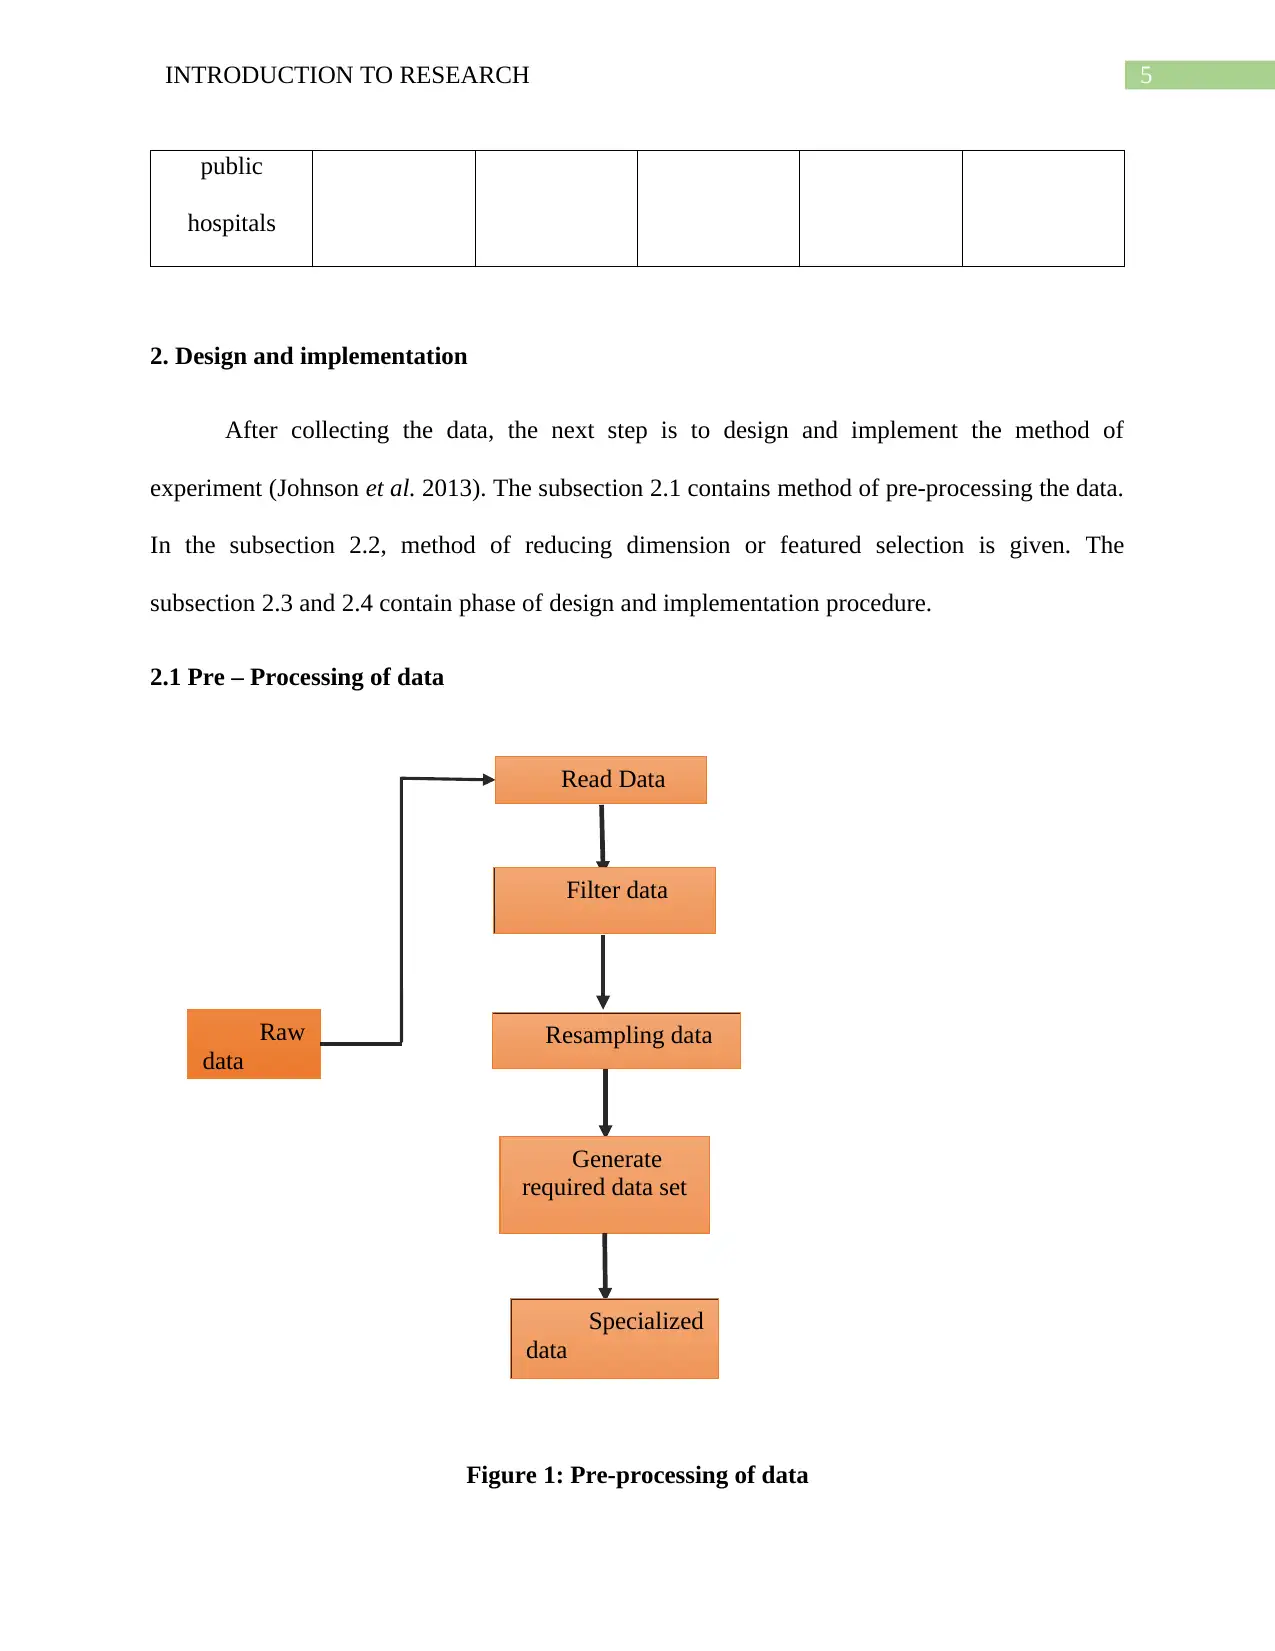
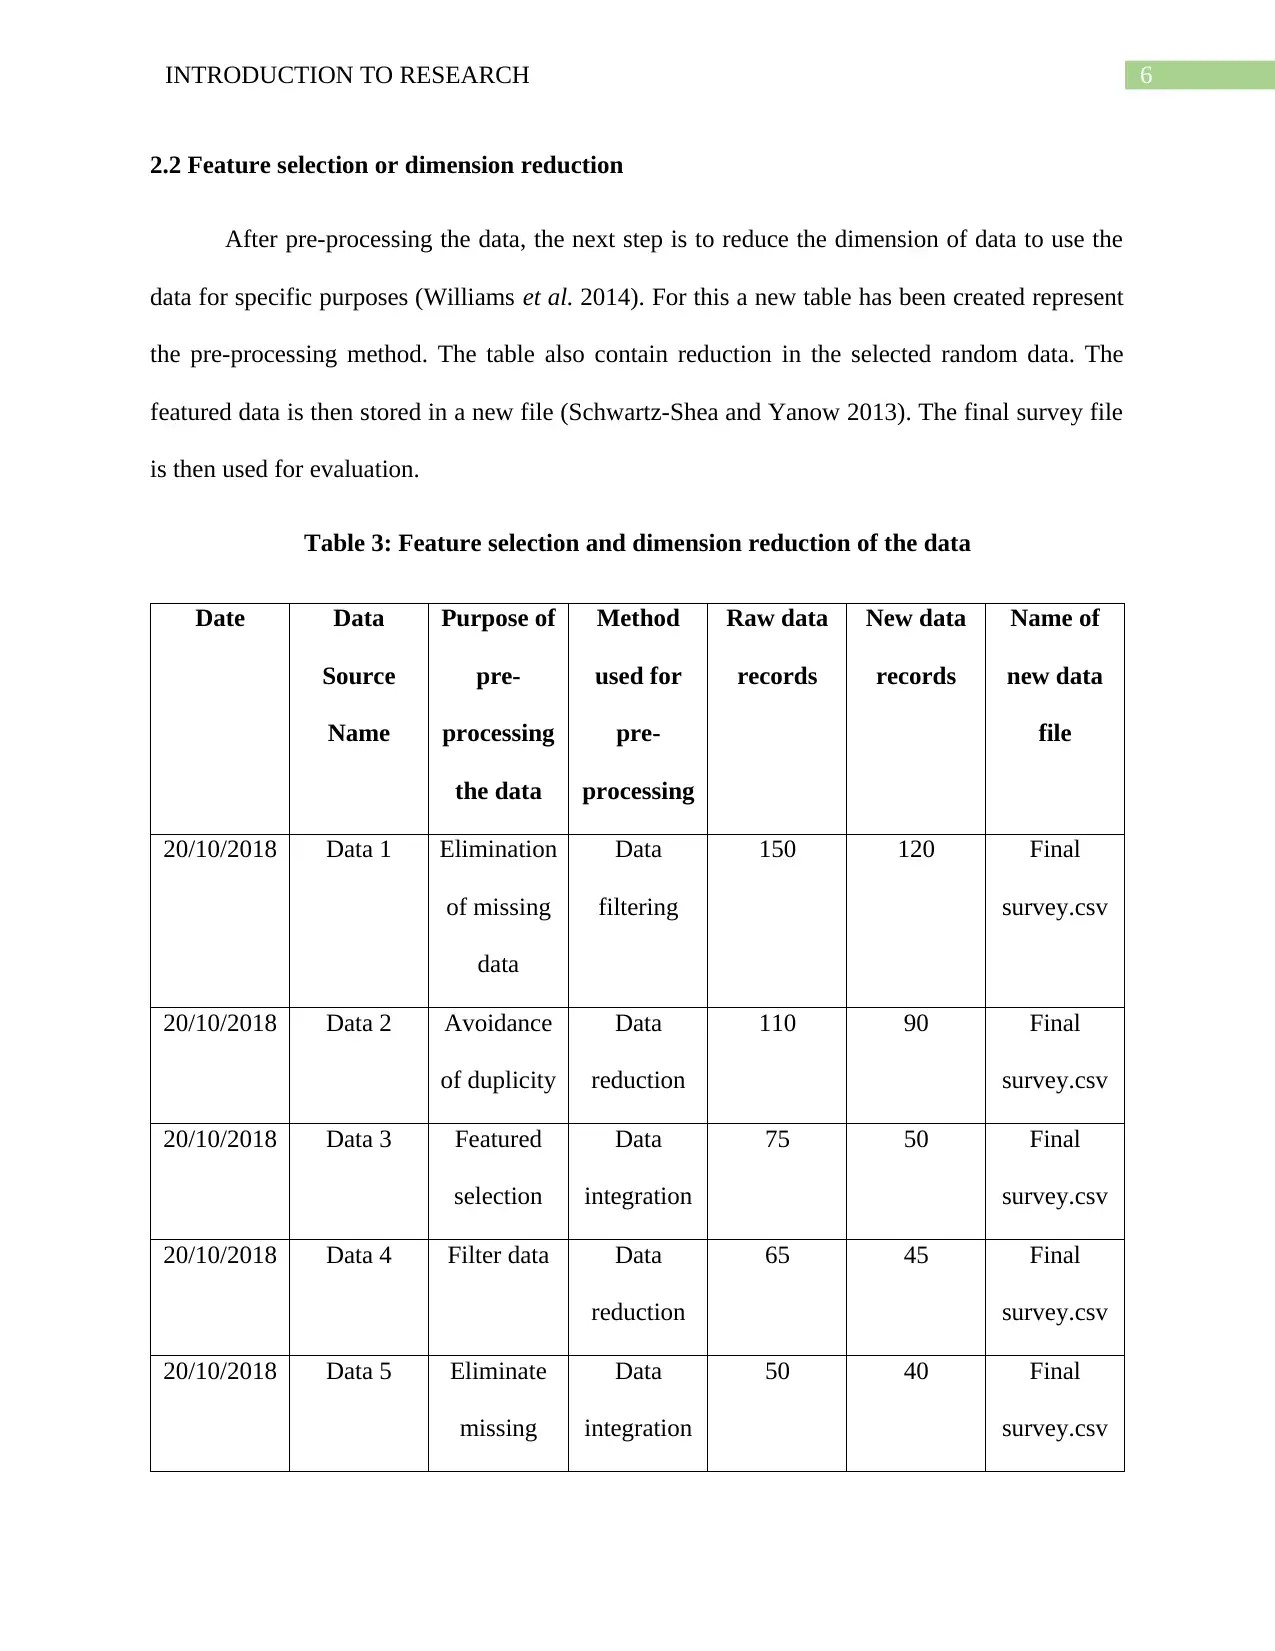
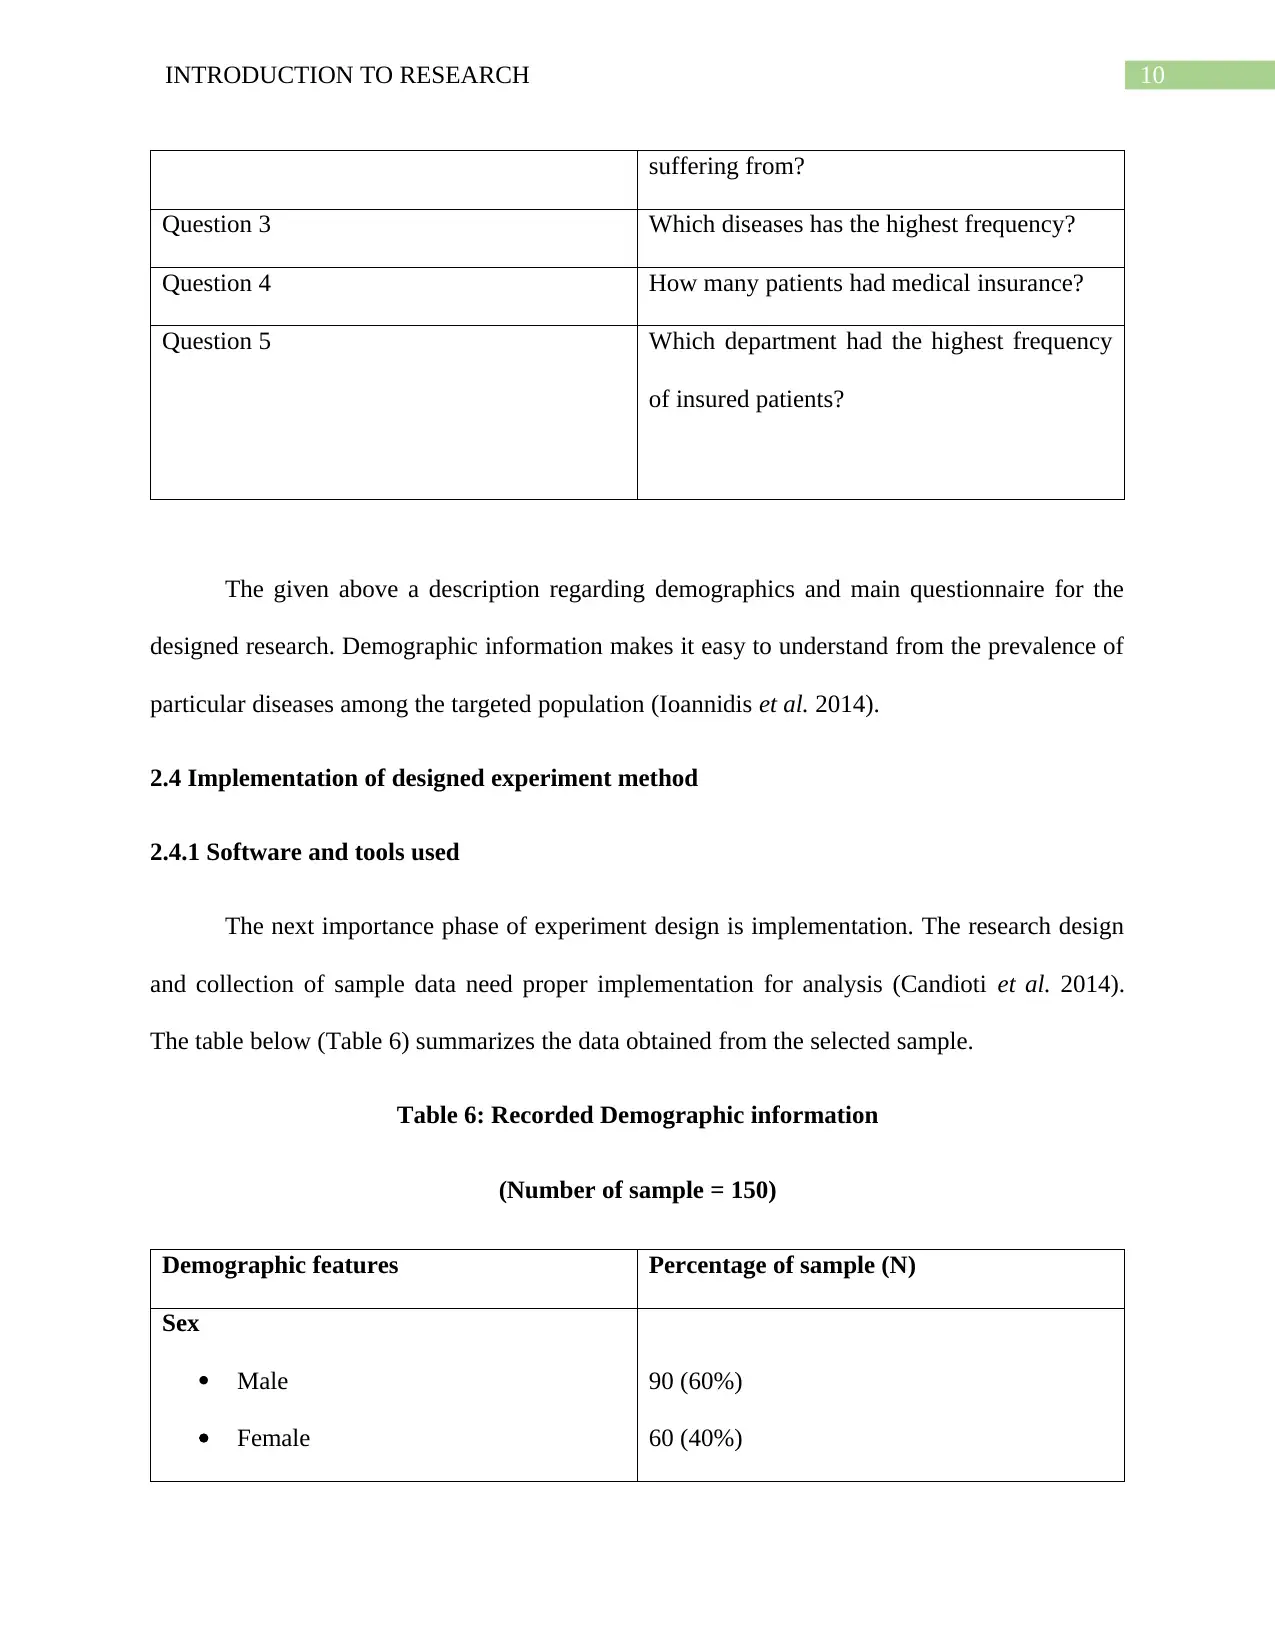
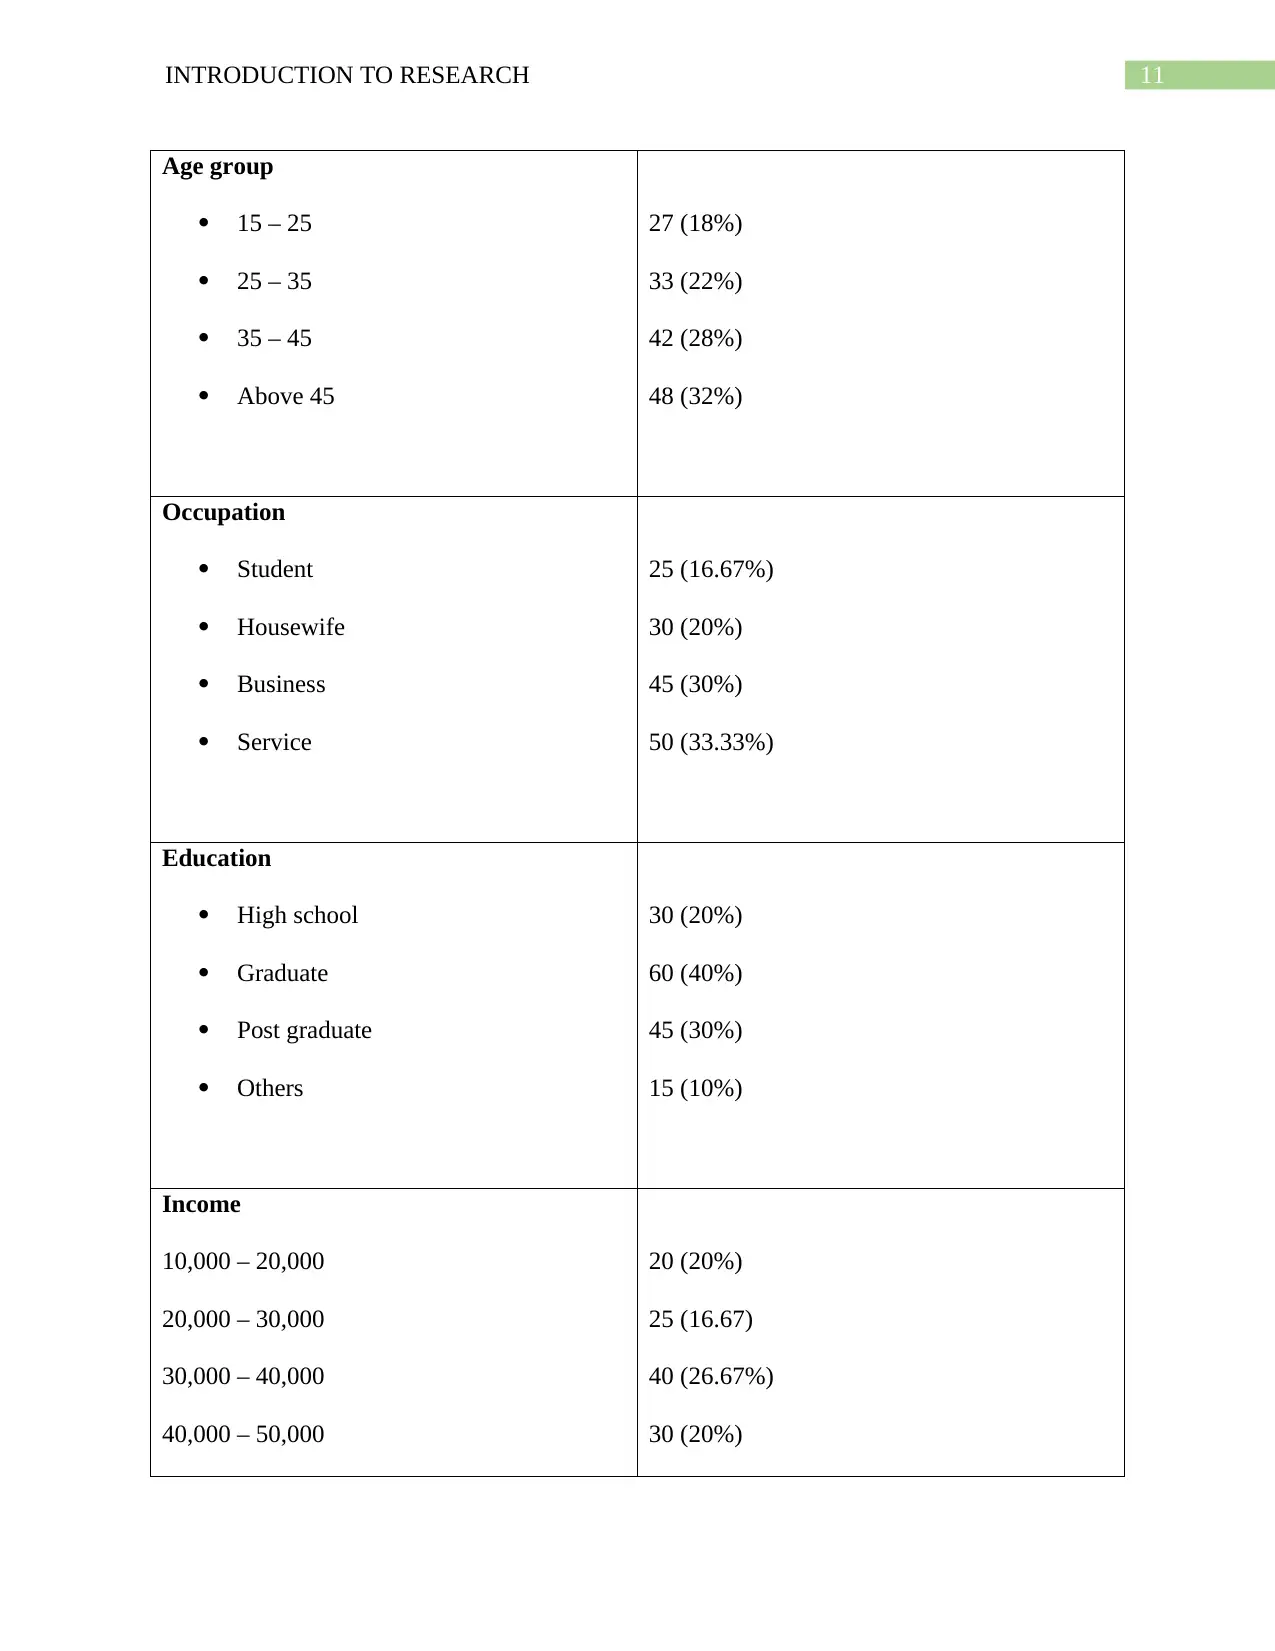
This report details a research study focused on data collection, experiment design, and result analysis, primarily within a healthcare context. The study involves collecting data from public and private hospitals, including patient demographics, disease types, and medical insurance information. The methodology includes pre-processing, feature selection, and experiment design using both qualitative and quantitative methods. The findings reveal insights into patient demographics, disease prevalence, and insurance coverage across different departments. The study analyzes data from 150 patients, providing a comprehensive overview of healthcare patterns, including average patient numbers per week, disease distribution, and insurance coverage rates. The report concludes with a summary of the results, highlighting key observations regarding patient demographics, disease prevalence, and insurance trends.

Running head: INTRODUCTION TO RESEARCH
Introduction to Research
Name of the Student
Name of the University
Course ID
Introduction to Research
Name of the Student
Name of the University
Course ID
Paraphrase This Document
Need a fresh take? Get an instant paraphrase of this document with our AI Paraphraser

1INTRODUCTION TO RESEARCH
Table of Contents
1. Collection of data.........................................................................................................................2
1.1Data source.............................................................................................................................2
1.2 Data collection.......................................................................................................................2
1.3 Data storage...........................................................................................................................4
2. Design and implementation.........................................................................................................5
2.1 Pre – Processing of data.........................................................................................................5
2.2 Feature selection or dimension reduction..............................................................................6
2.3 Experiment Design................................................................................................................7
2.4 Implementation of designed experiment method................................................................10
3. Analysis of Result......................................................................................................................17
3.1 Estimation of obtained results.............................................................................................17
3.2 Summary of the obtained results.........................................................................................18
4. Brief Outline of Experiment and Result Analysis.....................................................................19
5. Reference list.............................................................................................................................20

2INTRODUCTION TO RESEARCH
1. Collection of data
Proper design of method of experiment and result analysis from the experiment should
be done before performing experiment and obtaining result. The first task in conducting
experiment process is to collect data that would be used in the experiment. There are different
sources for gathering data (Tang and Zhang 2013). The detailed information regarding selected
data source is given in section 1.1. The most appropriate data source is then selected and is used
for analysis. All the data are then put into the table to prepare a record (Deutsch et al. 2013). The
data file is created in the subsection 1.1.3. The collected data are stored in the created file. The
data file is saved is to be saved in the computer.
1.1 Data source
Before starting the experiment process, research needs to be conducted regarding research
problem, design of the experiment and selection in data sources (Montgomery 2017). The
particular study targets common people of different age. Data collected from public and private
hospital.
Public hospital
Private hospital
1.2 Data collection
The following table is prepared to collect data and prepare record for the experiment. The
details regarding data source, name of the organization and data description, type of data, format
for collected data, fees and appropriateness of the data is given in the table (Creswell and
Creswell 2017).
⊘ This is a preview!⊘
Do you want full access?
Subscribe today to unlock all pages.

Trusted by 1+ million students worldwide

3INTRODUCTION TO RESEARCH
Table 1: Collection of data
Data Source
Name
Source
Organization
(Public =
hospitals)
Data
Description
Data file
format
Charge fee Target data
source
Data 1 Public How many
patients are
admitted on
an average in
a week?
CSV Free Yes
Data 2 Public What type of
diseases the
patients are
suffering
from?
CSV Free Yes
Data 3 Public Which
diseases has
the highest
frequency?
CSV Free Yes
Data 4 Public How many
patients had
medical
CSV Free Yes
Paraphrase This Document
Need a fresh take? Get an instant paraphrase of this document with our AI Paraphraser

4INTRODUCTION TO RESEARCH
insurance
Data 5 Public Which
department
had the
highest
frequency of
insured
patients?
CSV Free Yes
1.3 Data storage
The creation and completion of the data table is followed by gathering the data and put
those data on a separate table (Pedhazur and Schmelkin 2013). The second data table has raw
data that is the data directly collected from the data source. The data is stored for safety purpose
so that data might not lose (Kratochwill et al. 2013).
Table 2: Storage of data
Data Source
name
Date of
collection
Saved file
location
Saved file
name
Saved file
format
No of
records
Survey from
private
hospitals
18/10/2018 // raw data/ Survey.csv CSV 70
Survey from 20/10/ 2018 // raw data/ Survey.csv CSV 80

Read Data
Filter data
Resampling data
Generate
required data set
Specialized
data
Raw
data
5INTRODUCTION TO RESEARCH
public
hospitals
2. Design and implementation
After collecting the data, the next step is to design and implement the method of
experiment (Johnson et al. 2013). The subsection 2.1 contains method of pre-processing the data.
In the subsection 2.2, method of reducing dimension or featured selection is given. The
subsection 2.3 and 2.4 contain phase of design and implementation procedure.
2.1 Pre – Processing of data
Figure 1: Pre-processing of data
⊘ This is a preview!⊘
Do you want full access?
Subscribe today to unlock all pages.

Trusted by 1+ million students worldwide

6INTRODUCTION TO RESEARCH
2.2 Feature selection or dimension reduction
After pre-processing the data, the next step is to reduce the dimension of data to use the
data for specific purposes (Williams et al. 2014). For this a new table has been created represent
the pre-processing method. The table also contain reduction in the selected random data. The
featured data is then stored in a new file (Schwartz-Shea and Yanow 2013). The final survey file
is then used for evaluation.
Table 3: Feature selection and dimension reduction of the data
Date Data
Source
Name
Purpose of
pre-
processing
the data
Method
used for
pre-
processing
Raw data
records
New data
records
Name of
new data
file
20/10/2018 Data 1 Elimination
of missing
data
Data
filtering
150 120 Final
survey.csv
20/10/2018 Data 2 Avoidance
of duplicity
Data
reduction
110 90 Final
survey.csv
20/10/2018 Data 3 Featured
selection
Data
integration
75 50 Final
survey.csv
20/10/2018 Data 4 Filter data Data
reduction
65 45 Final
survey.csv
20/10/2018 Data 5 Eliminate
missing
Data
integration
50 40 Final
survey.csv
Paraphrase This Document
Need a fresh take? Get an instant paraphrase of this document with our AI Paraphraser

7INTRODUCTION TO RESEARCH
data
2.3 Experiment Design
2.3.1 Detailed step for designing
Experiments were conducted based on the methodology that is proposed for the research.
The hybrid methodology is regarded as the combination of the qualitative and quantitative
method (Michels et al. 2013). The data were collected from electronic record stored in private
and public hospital, based on which the questionnaire were prepared. A list of five questions
were prepared in the questionnaire that formed the main question in the survey (Merriam and
Tisdell 2015).
Prior to conducting survey, certain general features were designed that were categorized
under the heads of gender, age, education, occupation and income. These features were made it
easy to obtain the approximate idea regarding the people and their preference, which ultimately
resulted in reduction in dimension or selection of features (Dougherty and Shuker 2014). The
statistical tools were used to record the data.

Methodology Collect data
Data Analysis
Data Evaluation
8INTRODUCTION TO RESEARCH
2.3.2 Results of the experiment
Figure 2: Steps for developing Questionnaire
Table 4: Information on demographics
Sex Male
Female
Age group 15 – 25
25 – 35
35 – 45
Above 45
Data Analysis
Data Evaluation
8INTRODUCTION TO RESEARCH
2.3.2 Results of the experiment
Figure 2: Steps for developing Questionnaire
Table 4: Information on demographics
Sex Male
Female
Age group 15 – 25
25 – 35
35 – 45
Above 45
⊘ This is a preview!⊘
Do you want full access?
Subscribe today to unlock all pages.

Trusted by 1+ million students worldwide

9INTRODUCTION TO RESEARCH
Occupation Student
Housewife
Business
Service
Education High school
Graduate
Post graduate
Others
Income 10,000 – 20,000
20,000 – 30,000
30,000 – 40,000
40,000 – 50,000
Above 50,000
Table 5: Questionnaire for survey
Question no Description of the Question
Question 1 How many patients are admitted on an
average in a week?
Question 2 What type of diseases the patients are
Paraphrase This Document
Need a fresh take? Get an instant paraphrase of this document with our AI Paraphraser

10INTRODUCTION TO RESEARCH
suffering from?
Question 3 Which diseases has the highest frequency?
Question 4 How many patients had medical insurance?
Question 5 Which department had the highest frequency
of insured patients?
The given above a description regarding demographics and main questionnaire for the
designed research. Demographic information makes it easy to understand from the prevalence of
particular diseases among the targeted population (Ioannidis et al. 2014).
2.4 Implementation of designed experiment method
2.4.1 Software and tools used
The next importance phase of experiment design is implementation. The research design
and collection of sample data need proper implementation for analysis (Candioti et al. 2014).
The table below (Table 6) summarizes the data obtained from the selected sample.
Table 6: Recorded Demographic information
(Number of sample = 150)
Demographic features Percentage of sample (N)
Sex
Male
Female
90 (60%)
60 (40%)

11INTRODUCTION TO RESEARCH
Age group
15 – 25
25 – 35
35 – 45
Above 45
27 (18%)
33 (22%)
42 (28%)
48 (32%)
Occupation
Student
Housewife
Business
Service
25 (16.67%)
30 (20%)
45 (30%)
50 (33.33%)
Education
High school
Graduate
Post graduate
Others
30 (20%)
60 (40%)
45 (30%)
15 (10%)
Income
10,000 – 20,000
20,000 – 30,000
30,000 – 40,000
40,000 – 50,000
20 (20%)
25 (16.67)
40 (26.67%)
30 (20%)
⊘ This is a preview!⊘
Do you want full access?
Subscribe today to unlock all pages.

Trusted by 1+ million students worldwide
1 out of 24
Related Documents

Your All-in-One AI-Powered Toolkit for Academic Success.
+13062052269
info@desklib.com
Available 24*7 on WhatsApp / Email
Unlock your academic potential
Copyright © 2020–2025 A2Z Services. All Rights Reserved. Developed and managed by ZUCOL.