University Research Psychology Report: T-Test on Coin Amounts

Verified

Added on  2023/06/10

|5
|855
|252
Report
AI Summary
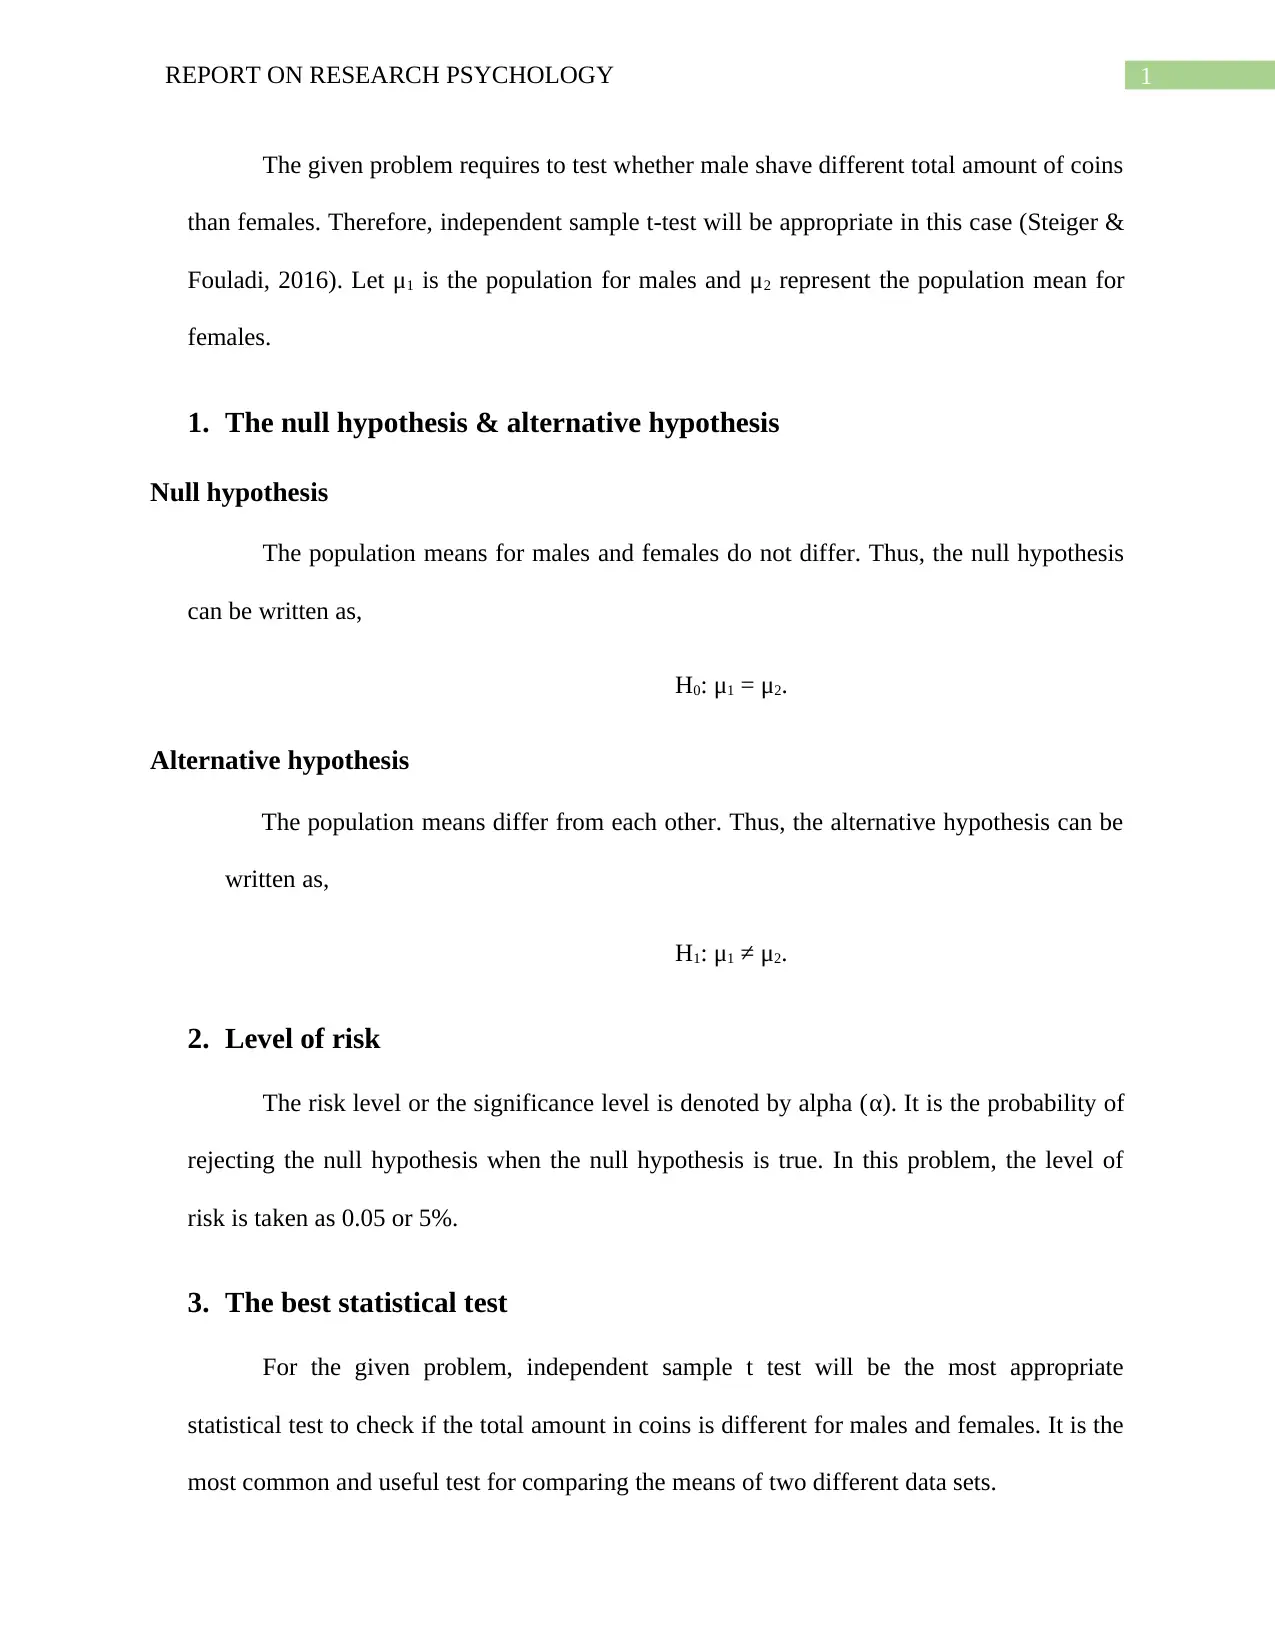
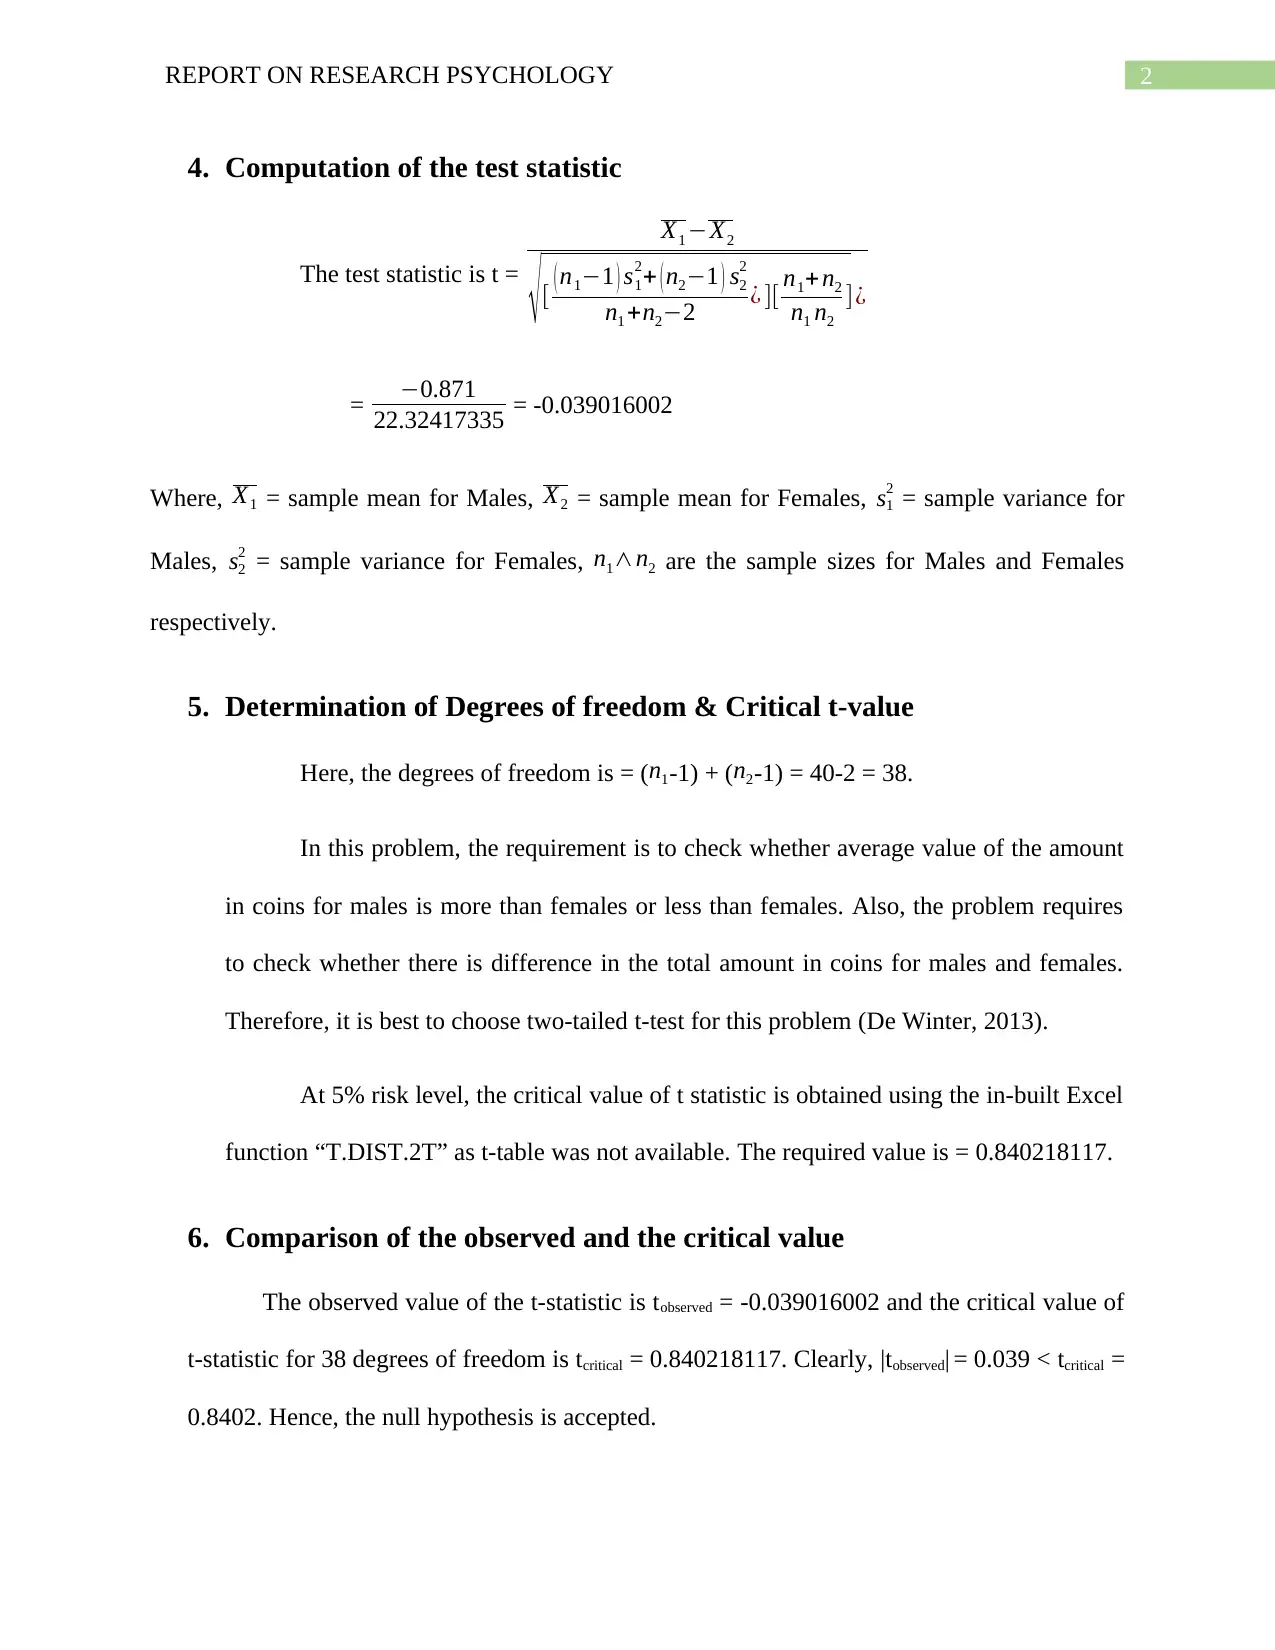
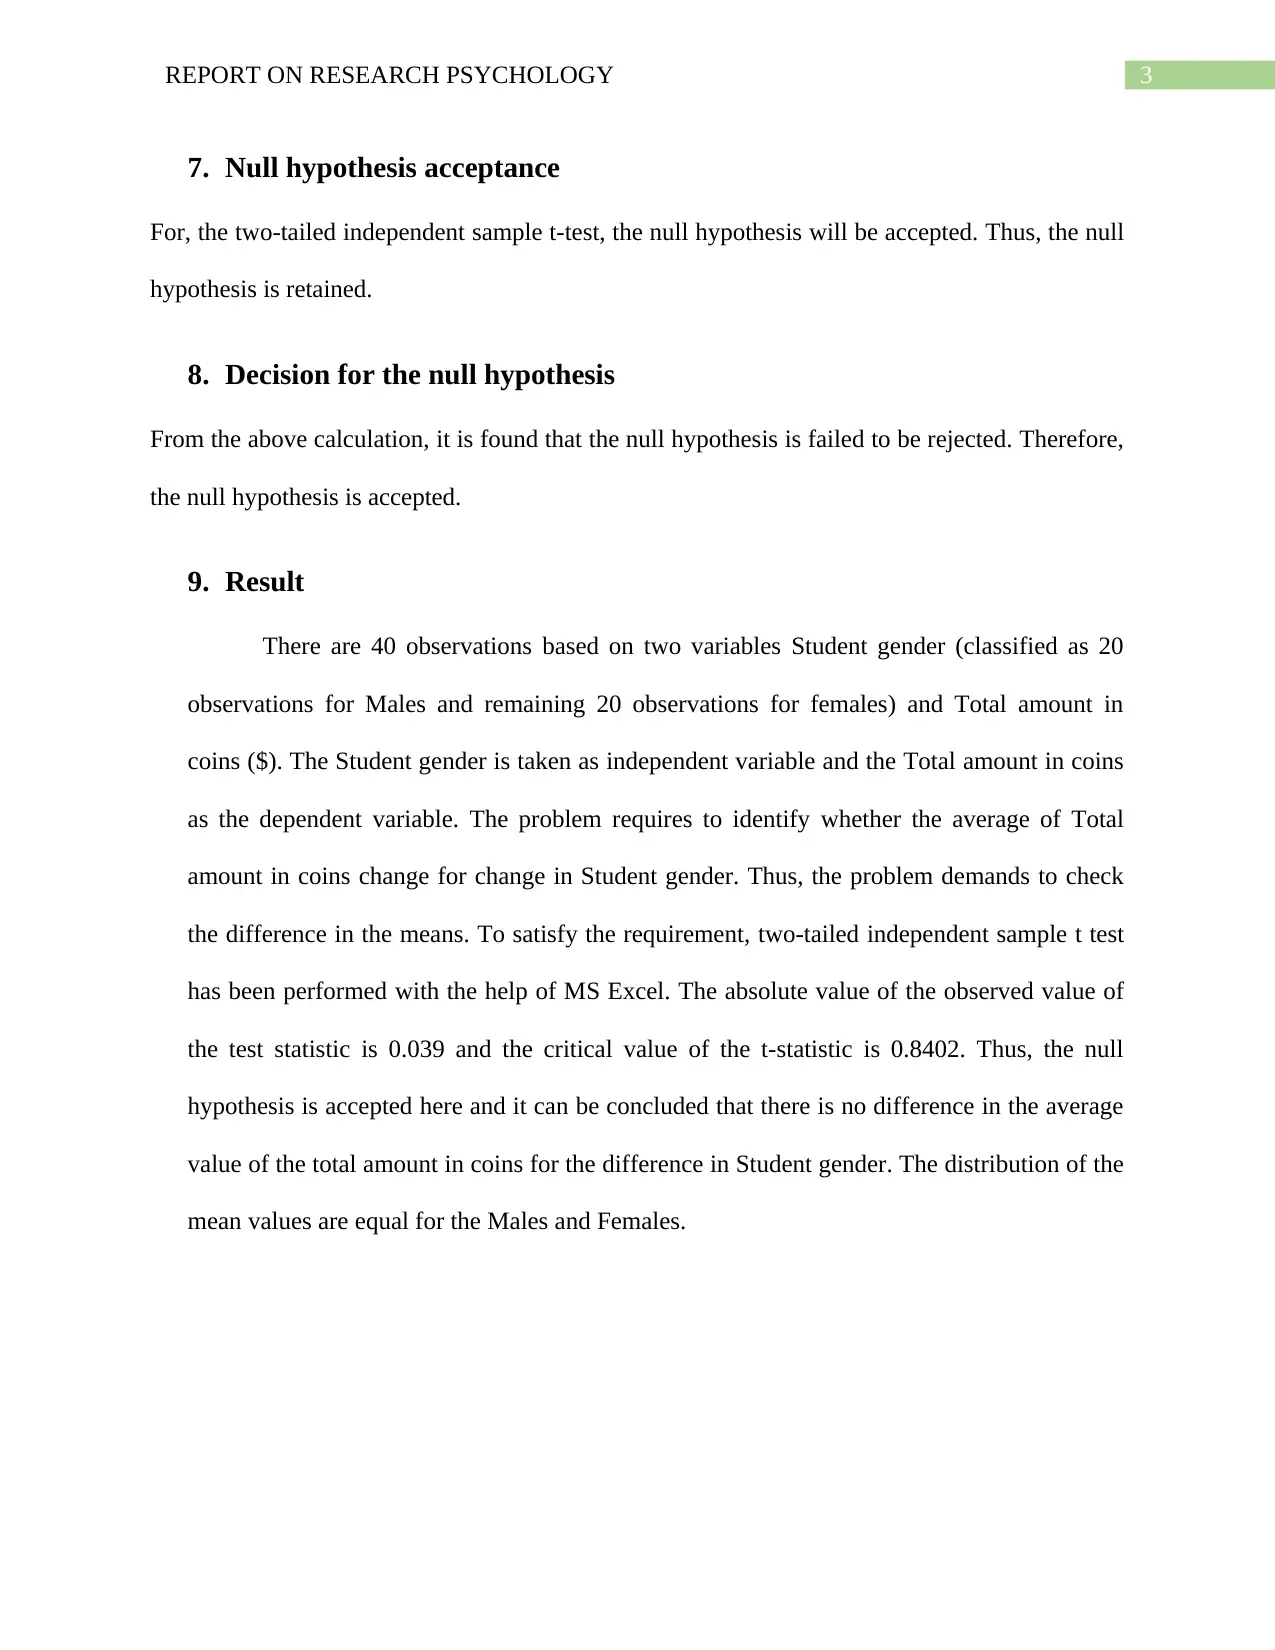
This report presents the findings of an independent samples t-test conducted to determine if there is a significant difference in the total amount of coins carried by male and female students. The study utilizes data collected from 40 participants, with 20 males and 20 females. The null hypothesis posits no difference in the population means for males and females, while the alternative hypothesis suggests a difference. The report details the statistical test, including the calculation of the t-statistic, determination of degrees of freedom, and comparison of the observed t-value with the critical value. The analysis, performed using MS Excel, reveals that the observed t-statistic (0.039) is less than the critical t-value (0.8402), leading to the acceptance of the null hypothesis. The conclusion indicates no statistically significant difference in the average amount of coins carried by male and female students. The report includes all the steps and results of the t-test.
Document Page
Running head: REPORT ON RESEARCH PSYCHOLOGY
Report on Research Psychology
Name of the Student:
Name of the University:
Author Note:
tabler-icon-diamond-filled.svg

Paraphrase This Document

Need a fresh take? Get an instant paraphrase of this document with our AI Paraphraser
Document Page
1REPORT ON RESEARCH PSYCHOLOGY
The given problem requires to test whether male shave different total amount of coins
than females. Therefore, independent sample t-test will be appropriate in this case (Steiger &
Fouladi, 2016). Let μ1 is the population for males and μ2 represent the population mean for
females.
1. The null hypothesis & alternative hypothesis
Null hypothesis
The population means for males and females do not differ. Thus, the null hypothesis
can be written as,
H0: μ1 = μ2.
Alternative hypothesis
The population means differ from each other. Thus, the alternative hypothesis can be
written as,
H1: μ1 μ2.
2. Level of risk
The risk level or the significance level is denoted by alpha (α). It is the probability of
rejecting the null hypothesis when the null hypothesis is true. In this problem, the level of
risk is taken as 0.05 or 5%.
3. The best statistical test
For the given problem, independent sample t test will be the most appropriate
statistical test to check if the total amount in coins is different for males and females. It is the
most common and useful test for comparing the means of two different data sets.
Document Page
2REPORT ON RESEARCH PSYCHOLOGY
4. Computation of the test statistic
The test statistic is t =
X1 X2
[ ( n11 ) s1
2+ ( n21 ) s2
2
n1 +n22 ¿ ][ n1+ n2
n1 n2
]¿
= 0.871
22.32417335 = -0.039016002
Where, X1 = sample mean for Males, X2 = sample mean for Females, s1
2 = sample variance for
Males, s2
2 = sample variance for Females, n1n2 are the sample sizes for Males and Females
respectively.
5. Determination of Degrees of freedom & Critical t-value
Here, the degrees of freedom is = ( n1-1) + ( n2-1) = 40-2 = 38.
In this problem, the requirement is to check whether average value of the amount
in coins for males is more than females or less than females. Also, the problem requires
to check whether there is difference in the total amount in coins for males and females.
Therefore, it is best to choose two-tailed t-test for this problem (De Winter, 2013).
At 5% risk level, the critical value of t statistic is obtained using the in-built Excel
function “T.DIST.2T” as t-table was not available. The required value is = 0.840218117.
6. Comparison of the observed and the critical value
The observed value of the t-statistic is tobserved = -0.039016002 and the critical value of
t-statistic for 38 degrees of freedom is tcritical = 0.840218117. Clearly, |tobserved| = 0.039 < tcritical =
0.8402. Hence, the null hypothesis is accepted.
Document Page
3REPORT ON RESEARCH PSYCHOLOGY
7. Null hypothesis acceptance
For, the two-tailed independent sample t-test, the null hypothesis will be accepted. Thus, the null
hypothesis is retained.
8. Decision for the null hypothesis
From the above calculation, it is found that the null hypothesis is failed to be rejected. Therefore,
the null hypothesis is accepted.
9. Result
There are 40 observations based on two variables Student gender (classified as 20
observations for Males and remaining 20 observations for females) and Total amount in
coins ($). The Student gender is taken as independent variable and the Total amount in coins
as the dependent variable. The problem requires to identify whether the average of Total
amount in coins change for change in Student gender. Thus, the problem demands to check
the difference in the means. To satisfy the requirement, two-tailed independent sample t test
has been performed with the help of MS Excel. The absolute value of the observed value of
the test statistic is 0.039 and the critical value of the t-statistic is 0.8402. Thus, the null
hypothesis is accepted here and it can be concluded that there is no difference in the average
value of the total amount in coins for the difference in Student gender. The distribution of the
mean values are equal for the Males and Females.
tabler-icon-diamond-filled.svg

Paraphrase This Document

Need a fresh take? Get an instant paraphrase of this document with our AI Paraphraser
Document Page
4REPORT ON RESEARCH PSYCHOLOGY
References
De Winter, J. C. (2013). Using the Student's t-test with extremely small sample sizes. Practical
Assessment, Research & Evaluation, 18(10).
Steiger, J. H., & Fouladi, R. T. (2016). Noncentrality interval estimation and the evaluation of
statistical models. What if there were no significance tests, 197-229.
chevron_up_icon
1 out of 5
circle_padding
hide_on_mobile
zoom_out_icon
[object Object]