Royal Roads University: Measures to Improve Sales at Tim Hortons
VerifiedAdded on 2022/08/12
|21
|5046
|26
Report
AI Summary
This research report meticulously examines the sales performance of Tim Hortons, a prominent quick-service restaurant chain in Canada and globally. The study identifies a decline in sales attributed to a lack of a robust operational efficiency strategy. It establishes a critical link between operational efficiency and financial performance, recommending that Tim Hortons adopt strategies to enhance operational efficiency to boost sales. The research leverages empirical literature to demonstrate the correlation between financial performance and operational efficiency, emphasizing that improved operations directly translate into better sales figures. The report advocates for the implementation of operational efficiency strategies, drawing parallels with successful approaches used by competitors like McDonald's and Arby's. The analysis underscores the necessity of operational efficiency, particularly within the competitive coffee and beverage market, for maintaining market share and ensuring long-term financial success. The research employs secondary data analysis, drawing upon annual revenue reports, empirical studies, and literature reviews to support its findings and recommendations.
1
Running head: MEASURES TO IMPROVISE THE SALES AT TIM HORTONS
Measures to Improvise the Sales at Tim Hortons
Running head: MEASURES TO IMPROVISE THE SALES AT TIM HORTONS
Measures to Improvise the Sales at Tim Hortons
Paraphrase This Document
Need a fresh take? Get an instant paraphrase of this document with our AI Paraphraser
2MEASURES TO IMPROVISE THE SALES AT TIM HORTONS
Executive Summary:
This research paper focuses on analysing the market condition of a popular QSR in Canada as
well as other countries, Tim Hortons. Through analysis it was found that Tim Hortons is
experiencing sudden fall in its sales and it is due to their lack of the presence of a proper
operational efficiency strategy that is helpful in establishing a stable financial performance in the
organization. Tim Hortons was failing to have a profit margin in their cue to meet customer
satisfaction and this is why through an establishment of the relationship between operational
efficiency and financial statement, this research project recommended the organization to use the
strategy of improved efficiency in their operations and gain a rise in their sales. Several empirical
literatures proved the correlation between financial performance and operational efficiency and it
is also stated that a uniform financial performance would imply proper sale. The project
recommended the organization to utilize the operational efficiency strategy since this strategy is
also being adopted by several other major organizations of QSR like the McDonald’s and
Arby’s. In order to stay in the competitive market especially in the arena of coffee and
beverages, attaining operational efficiency is the best option.
3MEASURES TO IMPROVISE THE SALES AT TIM HORTONS
Table of Contents
Introduction:....................................................................................................................................4
Literature Review:...........................................................................................................................5
Presentation of Research Findings:.................................................................................................7
Data Collection:...........................................................................................................................8
Data Analysis:..............................................................................................................................8
Discussion of Research Findings:..................................................................................................10
Recommendations / Implementation:............................................................................................12
Conclusion:....................................................................................................................................13
Reflections:....................................................................................................................................14
References:....................................................................................................................................16
Appendix:......................................................................................................................................19
Appendix 1:...............................................................................................................................19
Appendix 2:...............................................................................................................................19
Appendix 3:...............................................................................................................................20
Appendix 4:...............................................................................................................................21
⊘ This is a preview!⊘
Do you want full access?
Subscribe today to unlock all pages.
Trusted by 1+ million students worldwide
4MEASURES TO IMPROVISE THE SALES AT TIM HORTONS
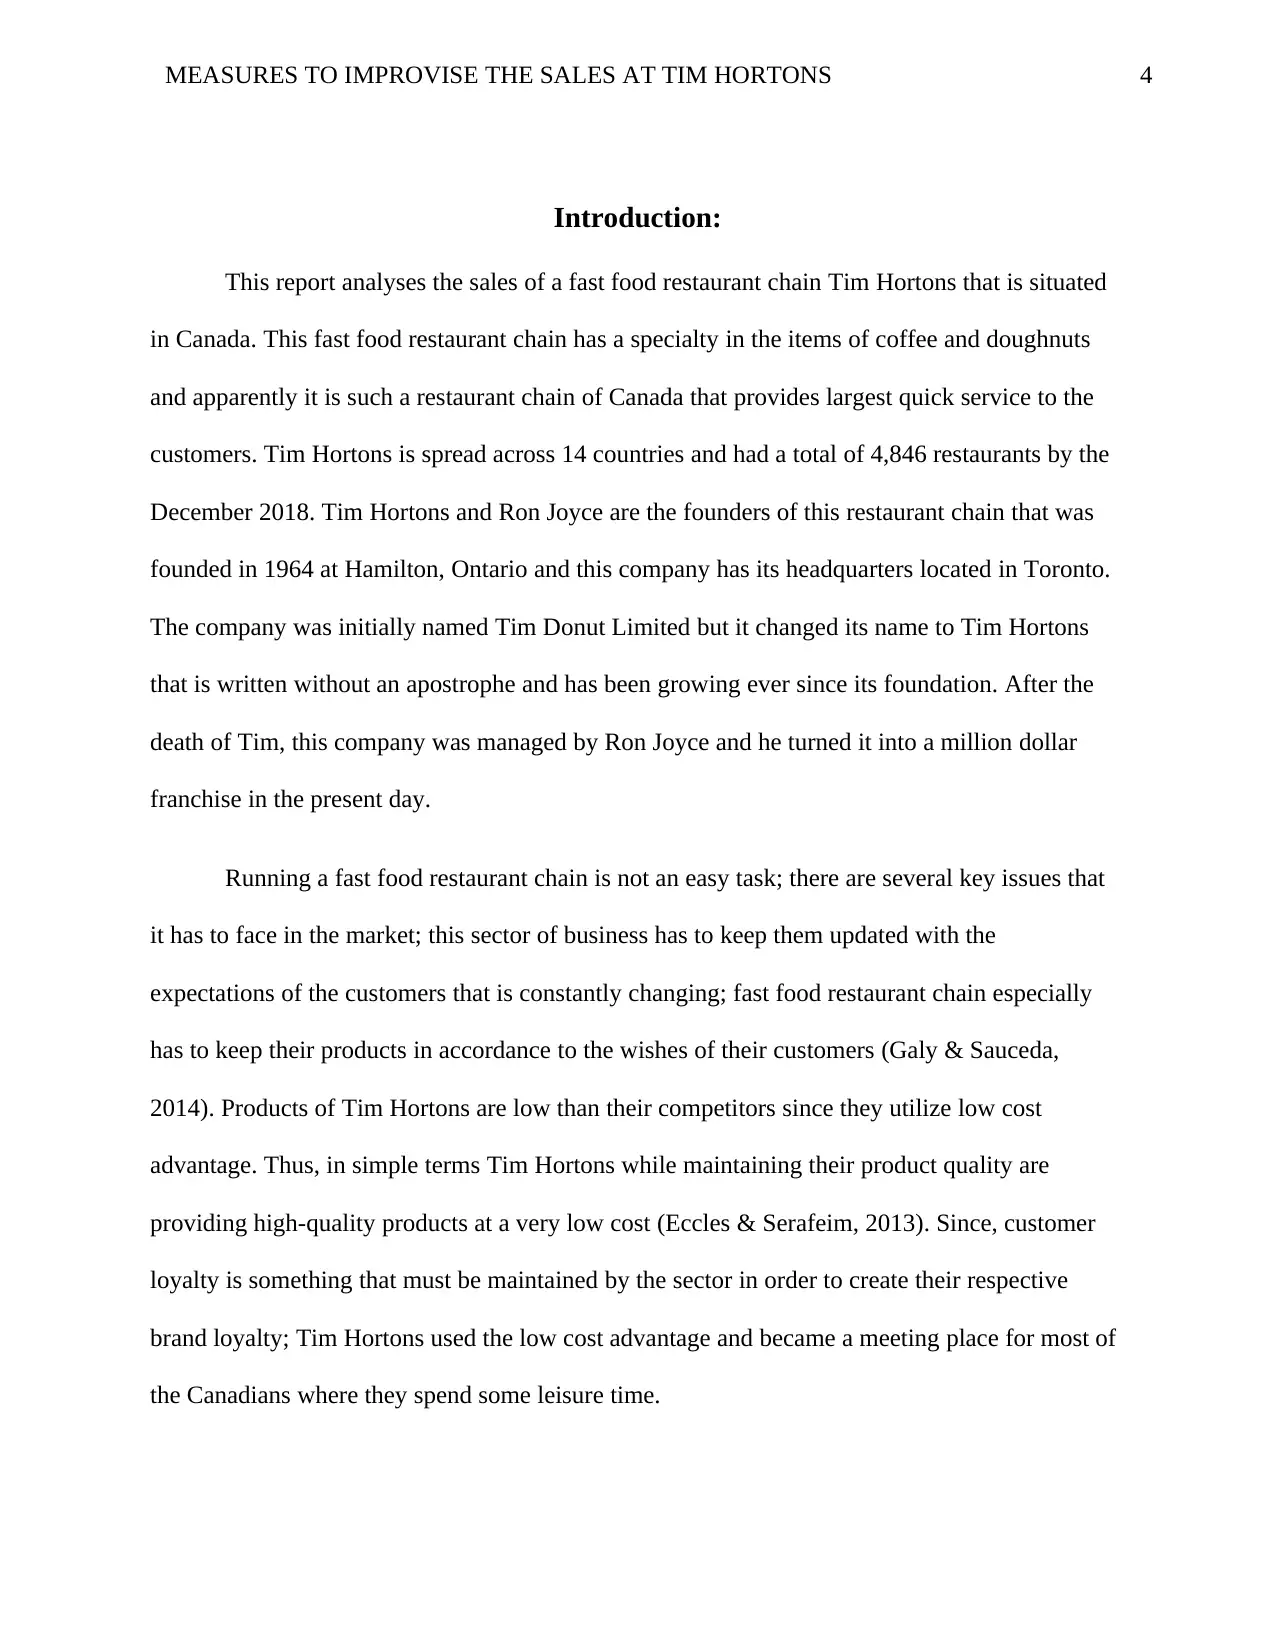
Introduction:
This report analyses the sales of a fast food restaurant chain Tim Hortons that is situated
in Canada. This fast food restaurant chain has a specialty in the items of coffee and doughnuts
and apparently it is such a restaurant chain of Canada that provides largest quick service to the
customers. Tim Hortons is spread across 14 countries and had a total of 4,846 restaurants by the
December 2018. Tim Hortons and Ron Joyce are the founders of this restaurant chain that was
founded in 1964 at Hamilton, Ontario and this company has its headquarters located in Toronto.
The company was initially named Tim Donut Limited but it changed its name to Tim Hortons
that is written without an apostrophe and has been growing ever since its foundation. After the
death of Tim, this company was managed by Ron Joyce and he turned it into a million dollar
franchise in the present day.
Running a fast food restaurant chain is not an easy task; there are several key issues that
it has to face in the market; this sector of business has to keep them updated with the
expectations of the customers that is constantly changing; fast food restaurant chain especially
has to keep their products in accordance to the wishes of their customers (Galy & Sauceda,
2014). Products of Tim Hortons are low than their competitors since they utilize low cost
advantage. Thus, in simple terms Tim Hortons while maintaining their product quality are
providing high-quality products at a very low cost (Eccles & Serafeim, 2013). Since, customer
loyalty is something that must be maintained by the sector in order to create their respective
brand loyalty; Tim Hortons used the low cost advantage and became a meeting place for most of
the Canadians where they spend some leisure time.
Paraphrase This Document
Need a fresh take? Get an instant paraphrase of this document with our AI Paraphraser
5MEASURES TO IMPROVISE THE SALES AT TIM HORTONS
This research project identifies the loss of revenues of Tim Hortons due to their improper
usage of low cost advantage, meeting their customer’s needs and several other reasons. It is
important to resolve this issue of revenue or else the company can face bankruptcy and might
have to lose its position in the market. This research has been undertaken exploring other
empirical documents which would potentially throw light on measures that should be
implemented to optimize the operational efficiency. It is significant to know what measures Tim
Hortons are deploying to improve their operational efficiency to increase their sales across the
four franchise restaurants in four diverse locations.
Literature Review:
Keeping in mind the way in which Tim Hortons is trying to satisfy the needs of their
customers, it is evident that this company requires improvement in their operational efficiency.
Operational efficiency can be defined as the capability of an organization to deliver their services
and products in a cost effective manner to their customers; all this while they will ensure that
high quality of their products are maintained and along with it, the services and support that they
provide are also of high quality (Beal, 2020). This kind of efficiency is significant for an
organization in order to respond to the changing forces of market continually and effectively
through a cost-effective way. There are ways to attain such efficiency and in order to do so; the
organization has to minimize their redundancy as well as the waste since it contributes in high
internal costs (Yoder, Visich & Rustambekov, 2016). When internal costs will be reduced, an
organization will automatically be able to achieve higher margins of profit and also be successful
in competitive markets. This efficiency of operation in an organization depends on certain factors
6MEASURES TO IMPROVISE THE SALES AT TIM HORTONS
like proficient workers, skilful employees, and progression of technology in a proper manner,
controlled supply chain and many others.
Financial performance can be defined as a measure that calculates how well an
organization utilizes its resources from its basic business in order to generate returns. Elevation
in any company’s financial performance reflects that the company has high management
efficiency and effectiveness in terms of their utilization of the company’s resources. According
to Ndolo (2015) there is an existing relationship between Operational efficiency and Financial
Performance. If the company’s internal aspects are mainly responsible for the variation in their
financial performance, the companies are expected to bring in changes on the basis of some
finest operational practices which will be applied to their infrastructural and structural elements
so that a selected performance goal is attained (Ndolo, 2015). The operational efficiency of an
organization in its relation to an efficient usage of their assets is visibly reflected in the
organization’s net margin. According to the calculation of Dillon (2012) with the help of Karle
Pearson’s tool of coefficient correlation as shown in Appendix 1, it was deduced that an
insignificant positive correlation exists between overall profitability and operational efficiency.
This operational efficiency can be measured through several methods of ratios; Total
Asset Turnover ratio measure’s the organization’s ability to generate sales with the investment in
their total assets (Shehadeh et al., 2016). The formula for this ratio is to divide the net sales by
their average of the total assets. Fixed- Asset Turnover ratio is another method which is also
gained by dividing the net sales by average of net fixed assets except that in this method only
fixed assets are taken into account. The Equity Turnover method can also be used to calculate the
ratio of net sales by dividing it with the average of the total equity. All the above ratios show
whether the organization is being able to manage its operational cost efficiently and ultimately
⊘ This is a preview!⊘
Do you want full access?
Subscribe today to unlock all pages.
Trusted by 1+ million students worldwide
7MEASURES TO IMPROVISE THE SALES AT TIM HORTONS
this will have an impact upon the profitability of the organization itself. Ndolo (2015) mention
that amongst many factors that has an impact on the financial performance of the organization,
operational efficiency is one of them. The basic business practice reveals that operational
efficiency plays a significant role in improving the future as well as present performance of the
firm. In order to do so, a business or a firm must have some achievable targets which depend on
its assets. Any organization can have their key to success if they are efficient in managing their
financial field effectively (Qiang et al., 2014). Operational efficiency is one of the many factors
that can help in achieving this objective but it must be kept in mind that efficiency in the
operational does not indicate reducing costs only, it also includes providing high quality services
and products by keeping a decent number of customer and revenue (Abuzayed & Molyneux,
2009). There are arguments that show that operational efficiency does not have any strong
positive or negative influence on the performance of the organization, however, there are ample
literary proves to argue against the statement. With effective financial management, an
organization is bound to experience some positive outcomes that are favorable for their profit
margin.
Presentation of Research Findings:
This research project has undertaken secondary data research method to conduct the
analysis on Tim Hortons. The analysis of the company was done through the help of empirical
documents, data which is collected from pre-existing surveys and from literature review. As per
the opinion of Dul and Hak (2008), research design is basically an arrangement of data collection
and analysis in such a way that it helps in combining the data with the level of relevance on the
topic of study. Research design is a pattern of general project which helps in specifying in the
Paraphrase This Document
Need a fresh take? Get an instant paraphrase of this document with our AI Paraphraser
8MEASURES TO IMPROVISE THE SALES AT TIM HORTONS
kind of information that is to be collected, the kind of sources that needs to be used and the kind
of procedures that are needed to be applied.
Data Collection:
This is a significant process in a research study through which specific information is
gathered in a systematic and conventional manner that helps the researcher to answer the
research problem. Secondary data collection is the method of researching through gathering of
notion that is already researched by other researchers or through data that is obtained from
several other sources (Capurso, 2016). For this project, secondary data was collected from annual
revenue report of Tim Hortons and through literature review of empirical documents and
researches that stated a relationship between operational efficiency and financial performance,
which Tim Hortons need to implement in order to increase its sale revenue.
Data Analysis:
The objective of the literature review was to establish a positive relationship between
operational efficiency and financial performance. Through the empirical researches, the
correlation is established that would be applied in context to Tim Hortons’ marketing strategy.
This correlation would determine what kind of steps Tim Hortons need to implement within their
four restaurants franchise location that would impose increment in their sales at all the four
locations (Richelieu & Korai, 2014). Figure 3 of Appendix 3 shows the correlation analysis table
that is described in detailed in order to strengthen the relationship between operational efficiency
and financial performance. The analysis leads to the result that operational efficiency can have
both positive and negative impact on the financial performance; however, unlike some scholars
who believe that there is no existence of any impact for operational efficiency on financial
performance is not true. The Karle Pearson product correlation coefficient measures the strength
9MEASURES TO IMPROVISE THE SALES AT TIM HORTONS
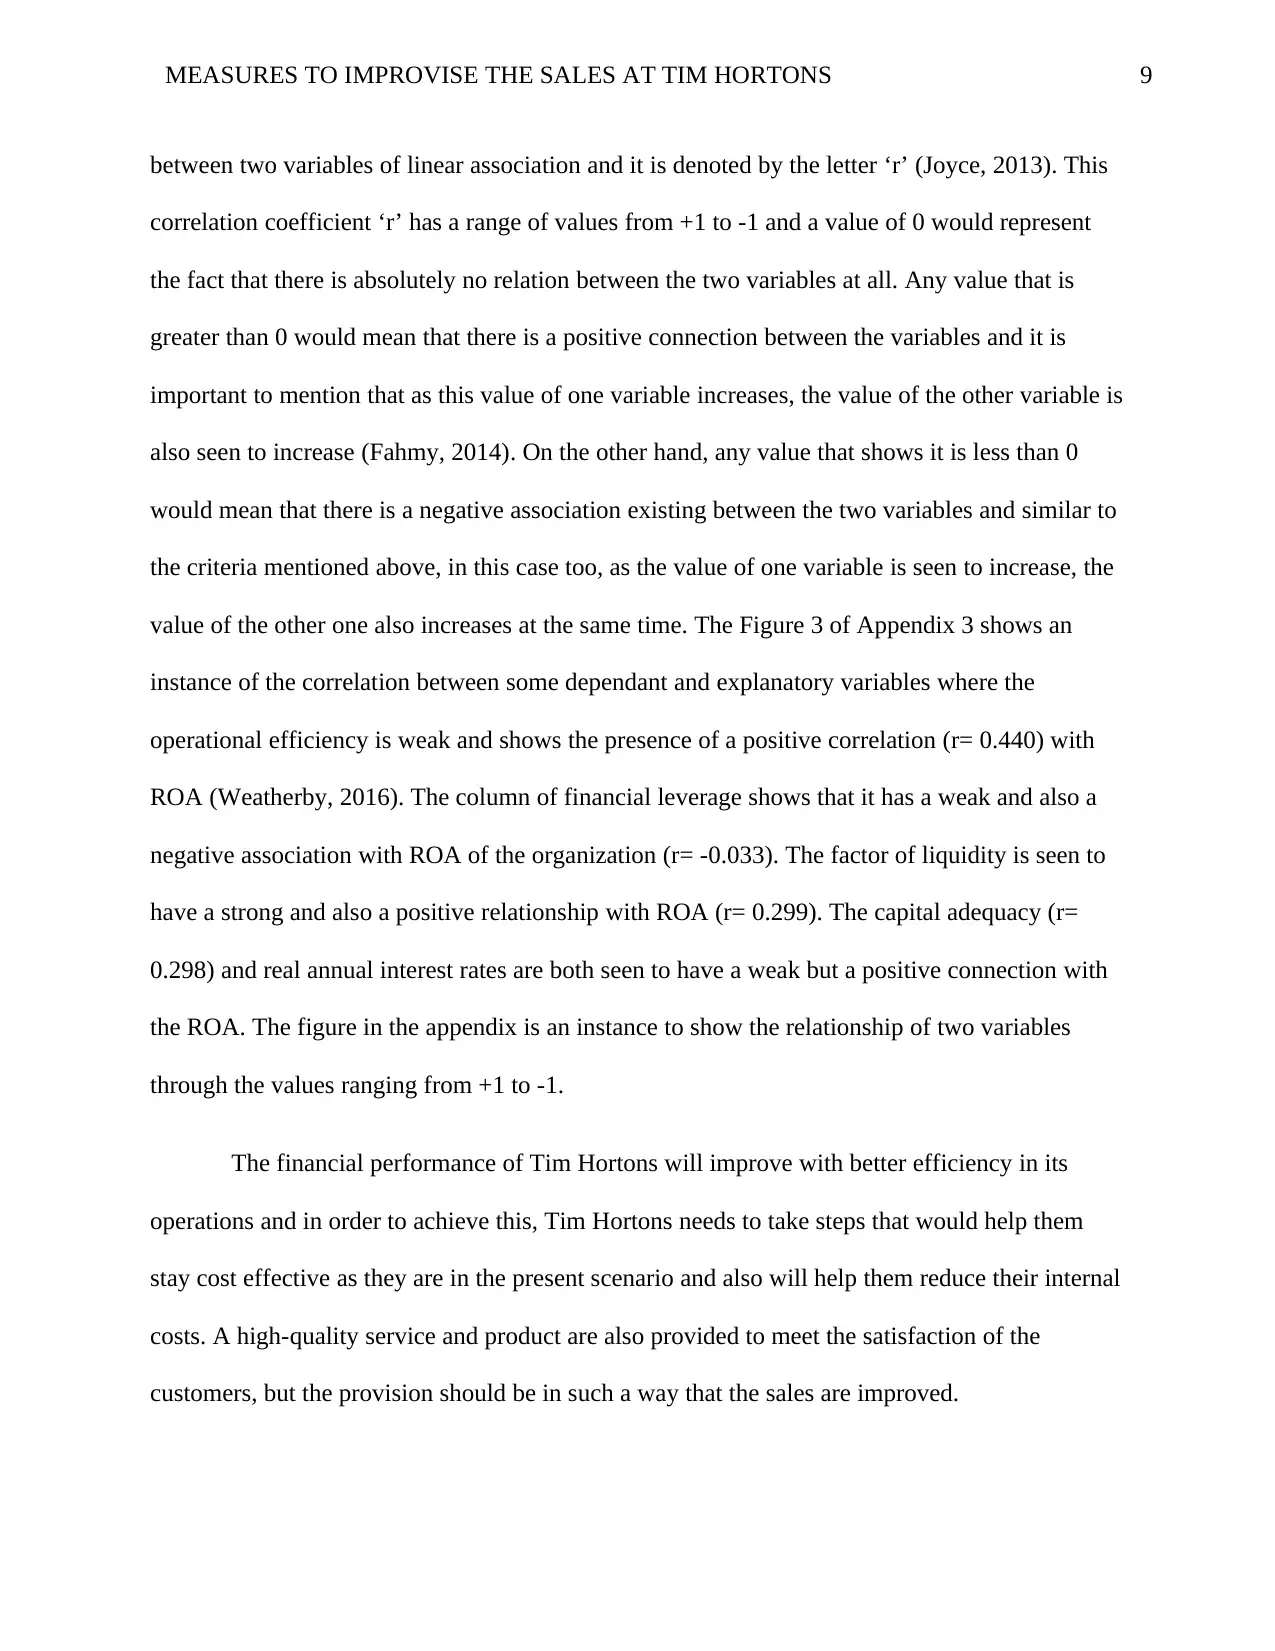
between two variables of linear association and it is denoted by the letter ‘r’ (Joyce, 2013). This
correlation coefficient ‘r’ has a range of values from +1 to -1 and a value of 0 would represent
the fact that there is absolutely no relation between the two variables at all. Any value that is
greater than 0 would mean that there is a positive connection between the variables and it is
important to mention that as this value of one variable increases, the value of the other variable is
also seen to increase (Fahmy, 2014). On the other hand, any value that shows it is less than 0
would mean that there is a negative association existing between the two variables and similar to
the criteria mentioned above, in this case too, as the value of one variable is seen to increase, the
value of the other one also increases at the same time. The Figure 3 of Appendix 3 shows an
instance of the correlation between some dependant and explanatory variables where the
operational efficiency is weak and shows the presence of a positive correlation (r= 0.440) with
ROA (Weatherby, 2016). The column of financial leverage shows that it has a weak and also a
negative association with ROA of the organization (r= -0.033). The factor of liquidity is seen to
have a strong and also a positive relationship with ROA (r= 0.299). The capital adequacy (r=
0.298) and real annual interest rates are both seen to have a weak but a positive connection with
the ROA. The figure in the appendix is an instance to show the relationship of two variables
through the values ranging from +1 to -1.
The financial performance of Tim Hortons will improve with better efficiency in its
operations and in order to achieve this, Tim Hortons needs to take steps that would help them
stay cost effective as they are in the present scenario and also will help them reduce their internal
costs. A high-quality service and product are also provided to meet the satisfaction of the
customers, but the provision should be in such a way that the sales are improved.
⊘ This is a preview!⊘
Do you want full access?
Subscribe today to unlock all pages.
Trusted by 1+ million students worldwide
10MEASURES TO IMPROVISE THE SALES AT TIM HORTONS
Discussion of Research Findings:
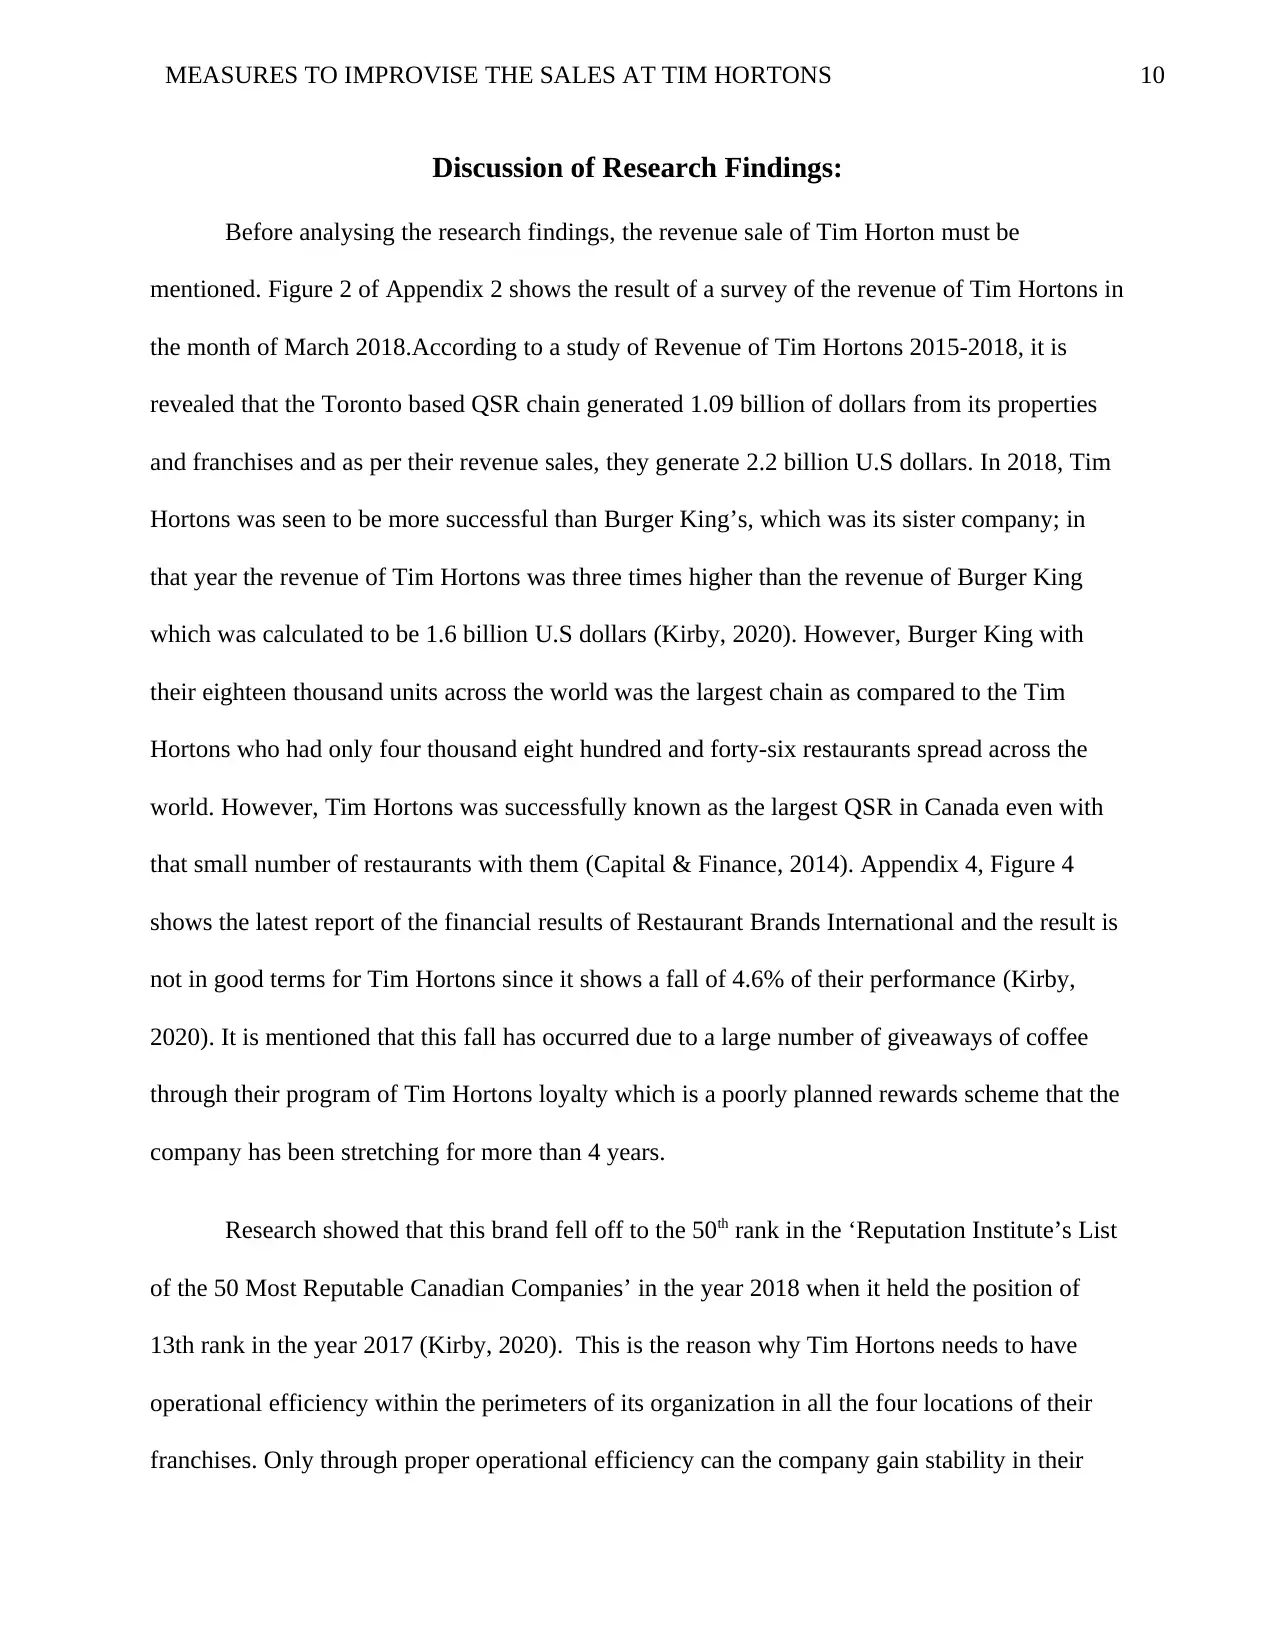
Before analysing the research findings, the revenue sale of Tim Horton must be
mentioned. Figure 2 of Appendix 2 shows the result of a survey of the revenue of Tim Hortons in
the month of March 2018.According to a study of Revenue of Tim Hortons 2015-2018, it is
revealed that the Toronto based QSR chain generated 1.09 billion of dollars from its properties
and franchises and as per their revenue sales, they generate 2.2 billion U.S dollars. In 2018, Tim
Hortons was seen to be more successful than Burger King’s, which was its sister company; in
that year the revenue of Tim Hortons was three times higher than the revenue of Burger King
which was calculated to be 1.6 billion U.S dollars (Kirby, 2020). However, Burger King with
their eighteen thousand units across the world was the largest chain as compared to the Tim
Hortons who had only four thousand eight hundred and forty-six restaurants spread across the
world. However, Tim Hortons was successfully known as the largest QSR in Canada even with
that small number of restaurants with them (Capital & Finance, 2014). Appendix 4, Figure 4
shows the latest report of the financial results of Restaurant Brands International and the result is
not in good terms for Tim Hortons since it shows a fall of 4.6% of their performance (Kirby,
2020). It is mentioned that this fall has occurred due to a large number of giveaways of coffee
through their program of Tim Hortons loyalty which is a poorly planned rewards scheme that the
company has been stretching for more than 4 years.
Research showed that this brand fell off to the 50th rank in the ‘Reputation Institute’s List
of the 50 Most Reputable Canadian Companies’ in the year 2018 when it held the position of
13th rank in the year 2017 (Kirby, 2020). This is the reason why Tim Hortons needs to have
operational efficiency within the perimeters of its organization in all the four locations of their
franchises. Only through proper operational efficiency can the company gain stability in their
Discussion of Research Findings:
Before analysing the research findings, the revenue sale of Tim Horton must be
mentioned. Figure 2 of Appendix 2 shows the result of a survey of the revenue of Tim Hortons in
the month of March 2018.According to a study of Revenue of Tim Hortons 2015-2018, it is
revealed that the Toronto based QSR chain generated 1.09 billion of dollars from its properties
and franchises and as per their revenue sales, they generate 2.2 billion U.S dollars. In 2018, Tim
Hortons was seen to be more successful than Burger King’s, which was its sister company; in
that year the revenue of Tim Hortons was three times higher than the revenue of Burger King
which was calculated to be 1.6 billion U.S dollars (Kirby, 2020). However, Burger King with
their eighteen thousand units across the world was the largest chain as compared to the Tim
Hortons who had only four thousand eight hundred and forty-six restaurants spread across the
world. However, Tim Hortons was successfully known as the largest QSR in Canada even with
that small number of restaurants with them (Capital & Finance, 2014). Appendix 4, Figure 4
shows the latest report of the financial results of Restaurant Brands International and the result is
not in good terms for Tim Hortons since it shows a fall of 4.6% of their performance (Kirby,
2020). It is mentioned that this fall has occurred due to a large number of giveaways of coffee
through their program of Tim Hortons loyalty which is a poorly planned rewards scheme that the
company has been stretching for more than 4 years.
Research showed that this brand fell off to the 50th rank in the ‘Reputation Institute’s List
of the 50 Most Reputable Canadian Companies’ in the year 2018 when it held the position of
13th rank in the year 2017 (Kirby, 2020). This is the reason why Tim Hortons needs to have
operational efficiency within the perimeters of its organization in all the four locations of their
franchises. Only through proper operational efficiency can the company gain stability in their
Paraphrase This Document
Need a fresh take? Get an instant paraphrase of this document with our AI Paraphraser
11MEASURES TO IMPROVISE THE SALES AT TIM HORTONS
financial performance and only through a uniform and stable financial performance it is possible
to plan a proper rewards scheme to gain customer loyalty (Hutchinson et al., 2013). Without the
support of finance, rewards scheme went to failure for this company and most of the source of
finance for this organization is through revenues and sales. This company is facing low growth in
a highly competitive environment and this has been a common issue for all the QSRs.
Researches of Beal (2020), Ndolo (2015) and others have proven to be relevant when they talked
about the importance of operational efficiency. In the current scenario, every other franchise is
opting for this method in order to have an established financial performance of their company.
Even McDonald’s have also announced to stick to this strategy of operational efficiency in order
to enhance their sales (Jiao, 2013). Another major QSR industry organization by the name of
Arby’s has also announced their decision of opting for this strategy; thus, judging by the
correlation of financial performance and operational efficiency through the empirical documents,
it seems that for Tim Hortons this operational efficiency is a dire need of the hour (Yu,
Ramanathan & Nath, 2014). Only through implementation of operational efficiencies it is
possible for the company to bring in changes that will help in improvising their sales. The
competition in the industry of coffee and beverages have increased very over the past couple of
years and this is why the method of customer satisfaction needs to be altered by Tim Hortons in
Canada keeping in mind the loss that they are facing whilst doing so (Kelly, Presslee & Webb,
2017). And this sale cannot be improvised only by adding new items on the menu of the
restaurant since it has been adopted by the company and faced failure and eventually the idea had
to be turned down. As a result of this failure Tim Hortons is facing negative coverage over the
media and it is creating more issues in their revenues; the profitability depends on more than
creativity of an organization and so does the financial performance. There are areas that the
12MEASURES TO IMPROVISE THE SALES AT TIM HORTONS
company needs to work upon apart from implementing operational efficiency as well so that
improvisation of sales is completely ensured.
Recommendations / Implementation:
The way Tim Hortons has been seen to resolve their issues does not imply that they are
implementing strategies for long term goals, instead it looks like they are resolving issues to
cover for a day. However, to gain the kind of reputation that Tim Hortons had back in their day,
operational efficiency should be made their first priority. Under this, one of the best strategies to
ensure a long term positive impact is to measure the resource and time cost of their existing
inefficiencies (Bookman, 2013). Tim Hortons should examine, record and evaluate their
redundant tasks, their redundant efforts and their delay or excess in their production. They can
also measure their time that is investing in recruiting good workers and should also analyze their
turnover of employees’ impact on these inefficiencies. Reward scheme like the free giveaways
should be altered into something more creative that will not hamper their sales as well as
maintain customer satisfaction. It also works well if the franchises work well together instead of
competing with each other; once investment of resources, time and money is utilized in an
efficient way by every employee, operational efficiency can be achieved. There should not be
any delay in the improvements that are required by the organization (DeFranco, 2014). And
most importantly, the strategies that are adopted to improvise their sales should be long term
strategic plans so that a static financial performance is attained. Once the employees are made
aware of the situation and are included to help the organization out of this trouble, they feel
valued and thus work harder. Only through a collaborative effort of every member of the
⊘ This is a preview!⊘
Do you want full access?
Subscribe today to unlock all pages.
Trusted by 1+ million students worldwide
1 out of 21
Related Documents


Your All-in-One AI-Powered Toolkit for Academic Success.
+13062052269
info@desklib.com
Available 24*7 on WhatsApp / Email
![[object Object]](/_next/static/media/star-bottom.7253800d.svg)
Unlock your academic potential
Copyright © 2020–2026 A2Z Services. All Rights Reserved. Developed and managed by ZUCOL.