ENG3315 Energy Audit Report: Residential Area in Brisbane, Australia
VerifiedAdded on 2023/06/12
|30
|8280
|433
Report
AI Summary
This report presents a comprehensive energy audit conducted on a residential property in Brisbane, Australia. The audit assesses the energy consumption patterns of various appliances and systems within the house, including heating and cooling, hot water, lighting, and personal computers. It details the methodology used, including data collection through power meter readings, energy bills, and LUX meter measurements. The report analyzes seasonal energy consumption, identifies energy management opportunities, and provides recommendations for improving energy efficiency. The findings aim to reduce energy consumption, lower operational costs, and minimize the carbon footprint of the household. Desklib offers a variety of study tools and resources, including similar solved assignments and past papers, to support students in their academic endeavors.

ENERGY AUDIT
Paraphrase This Document
Need a fresh take? Get an instant paraphrase of this document with our AI Paraphraser
Contents
ENERGY AUDIT................................................................................................................5
INTRODUCTION...............................................................................................................5
Background..................................................................................................................................5
Principle.......................................................................................................................6
Factors..........................................................................................................................7
Energy Efficiency in Australia.....................................................................................7
Scope............................................................................................................................................7
Methodology........................................................................................................................8
Source of Information and Assumptions.....................................................................................8
THE SITE............................................................................................................................9
General Characteristics of the Site............................................................................................10
General Description of Main Appliances..................................................................................10
Heating and Cooling..................................................................................................10
Hot Water...................................................................................................................11
Lighting......................................................................................................................11
PC...............................................................................................................................11
ENERGY CONSUMPTION..............................................................................................11
Usage Summary.........................................................................................................................12
Overall Consumption and Seasonal Consumption and Relative Charges.................................12
First bill......................................................................................................................12
Second bill.................................................................................................................13
Seasonal Charges of Energy Consumption................................................................................15
Energy Use Assumptions...........................................................................................................16
Appliances.................................................................................................................16
AUDIT MEASUREMENTS AND CALCULATIONS.....................................................17
Overall Summary of Energy of Consumption...........................................................................18
Energy Usage by Application....................................................................................................18
Pie Chart of Breakdown of Energy Consumption.....................................................................19
Bill Details.................................................................................................................................19
ENERGY MANAGEMENT OPPORTUNITIES..............................................................20
Lighting......................................................................................................................................20
Heating and Cooling..................................................................................................................21
OTHER RECOMMENDATIONS INCLUDING ACTION PLAN..................................21
CONCLUSION..................................................................................................................23
REFERENCES..................................................................................................................24
APPENDIX........................................................................................................................27
TABLE 1 - LIGHT READINGS WITH LUX METER............................................................27
TABLE 2 – ESTIMATED CALCUATIONS FOR LIGHTNING USAGE.............................29
TABLE 3 – ESTIMATED ENERGY USAGE.........................................................................30
⊘ This is a preview!⊘
Do you want full access?
Subscribe today to unlock all pages.
Trusted by 1+ million students worldwide
ENERGY AUDIT
INTRODUCTION
An energy audit is a process with viable and potential survey of inspection for the energy
flows anlaysis for performing energy conservation, in a particular house or in a system. The
objective of the audit system is to reduce the total energy input into the system with no negative
output affects.
The path of energy audit directs to the energy efficiency implementation. Inefficient and
potentially huge energy consumed equipment has to be replaced with efficient equipment. The
goal of the energy audit is to save and reduce the kilowatt hours (kWh) and kilowatts (kW).
There is a small difference between such two measurements. Here, kilowatt is measured as
power rating and kilowatt hours is the actual consumed energy measurement. Energy efficiency
implementation results in reduced carbon footprint, through reducing the operational costs. The
overall benefit of the energy audit and the expected outcome of energy efficiency
implementation is to improve the quality of life. It plays a vital role to increase the revenue, in
case the consumers make use of the greener product, in the place of non-greener product
(Forsstrom, et al, 2011). Though a house is considered as a basic unit, small changes and the
respective changes in the home energy consumption, can add up to larger savings. The overall
benefits of the same are to decrease the operational costs, carbon footprint to increase or improve
the quality of life.
Background
The power consumption by every electrical appliance, in every house has direct contact
and effect to the greenhouse gasses and so carbon footprint. Hence, every house has been taken
as a basic unit to calculate the contribution of the greenhouse gas emission, by each house. The
process of calculating the power consumption in a house is done through the process of energy
audit. And the energy audit program stands as the key to the program of the energy management.
The process of energy audit has the following stages (Barbara & Wolfgang, 2012).
1. Collection of data and review of the same
Paraphrase This Document
Need a fresh take? Get an instant paraphrase of this document with our AI Paraphraser

2. House Survey and System Measurements
3. Appliances operating practices observation and review
4. Analysis of data
Hence, energy audit process involves determining the how, why, when and where the
energy is being used. The objective of the energy audit is to identify possible opportunities
towards decreasing the cost of energy and so the emissions of greenhouse gas that eventually
contribute to the climate change can be achieved, all towards improving the efficiency.
The energy audit process applies the law of conservation of energy and the first law of
thermodynamics. According to the law,
What comes in = What goes out
Principle
When a house is the object of the energy audit, then energy consumption reduction, while
improving or maintaining the thermal comfort, human comfort, safety and health become the
primary concerns. It is not just identifying the energy usage source, but it prioritizes the uses of
energy, according to the cost effective opportunities starting from greatest to least, for the savings
of energy.
When a home energy audit is considered, house energy efficiency is evaluated by the
professional auditing engineer by using professional equipment, like infrared cameras and
blower doors, etc. The aim of the home energy audit is usually energy efficiency improvement in
cooling and heating of the interior of the house.
Home energy audit considers several building envelope’s characteristics, like windows,
walls, doors, floors, skylights and ceilings. It makes an estimation of the R-value, which is also
called as resistance to heat flow. The air infiltration or leakage rate of air through the envelope of
the building is taken as concern, as these are affected strongly, by door seals quality and window
construction, like weatherstripping. It quantifies the overall thermal performance of the building.
The energy audit process also involves the assessment of the mechanical systems’s physical
condition, efficiency and programming, like ventilation, heating, air conditioning, thermostat and
equipment (Yezioro, et al, 2008). The process of auditing is easier and accurate, when the billing
history of the homeowner is made available, as it shows fuel oil, natural gas, electricity or other
sources of energy taken for a period of one year two years.
Factors
The energy audit process becomes more accurate, when the climate, behaviour and age of
the home are taken as important factors.
Energy Efficiency in Australia
The efforts to improve the energy efficiency by the country is initiated and being led by
the Australian National Government. The effort is continued majorly with Department of
Industry and Science. A National Strategy on Energy Efficiency contract is agreed by the Council
of Australian Governments that represents each of the Australia’s territory and state, in July,
2009. The plan is of, ten year, in which the energy efficient practices nationwide implementation
is accelerated for the transformation of country into the future of low carbon. There are many
energy usage areas addressed under this NSEE (Thumann & Albert, 2012). The new adopted
energy efficiency stresses on four major points, to achieve the energy efficiency state levels, as
the following.
1. To streamline the efficient energy adoption
2. To help transitioning the businesses and households to a future of low carbon
3. For governments to lead the energy efficient way and work with partnership
4. To enable the houses and buildings with more energy efficient
Scope
The audit process and report covers the most of the power and energy utilized in a
particular residential place, which is located in Brisbane, in Australia. The major power
⊘ This is a preview!⊘
Do you want full access?
Subscribe today to unlock all pages.
Trusted by 1+ million students worldwide
consuming elements at home, are users of major socket power, lighting systems and high power
non-socket power consumption, using systems, that includes even stove and oven.
The entire house energy consumption is measured using power meter and LUX meter. So,
most and primary power points, equipped in the house are considered for the report, though
certain power points, such as for washing machine and study rooms are either of no easy access
or inaccessible to switch on and off the power points. So, the overall and major affected areas
power consumption is estimated.
The results obtained from the condition survey have been listed. The scope of the energy
audit is limited to the internal and external sockets and appliances, present in the house. Each of
the energy inputs is pointed and located, within the house (Matar, 2015). From this energy inputs,
major energy consuming points are listed and noted, for further reference. Then the audit scope
checklist is made.
Methodology
Since every home has lights, the respective light efficiency is measured by LUX meter
and the standard of manufacturer to provide the standard of lighting power. The overall energy
usage and relative cost in a particular house is created through consumption and cost of
electricity, consumed and compared quarterly, for the 2010 and 2011 years. The relationship in
between the total energy usage and seasons, in a quarter, is shown as a graph. A wireless energy
monitor was inspected and used so that the consumption pattern range can be broadened and the
stored data has been collected. The respective data indicates the periods that have most energy
usage.
The lighting efficacy, manufacturer specification and a LUX meter are used for the usage
of power for each of the inspected light measurement (Yezioro, 2008).
Source of Information and Assumptions
A wide range of sources have been considered to gather the information for this report,
after selective evaluation. The primary sources for the report are power meter reading, power bill
information, wireless energy meter readings, estimated daily run times, readings of LUX meter
and socket power consumption meters. Apart from that there is also other evaluation done, such
Paraphrase This Document
Need a fresh take? Get an instant paraphrase of this document with our AI Paraphraser
as electrical equipment on the website of manufacturer, for estimation of the respective power
usage.
The power consumption estimation is done in the period of winter and so the respective
season’s power readings are taken after measurement. It is specified because of the fact that the
kind of equipment used for seasons also varied and so the power consumption and readings.
Multi-phase system’s power consumption is measured by using wireless power meter, including
the air-conditioner. It is because of the fact that the multi-phase meter was unavailable during the
period of audit.
The house of audit contains three power meters, hence it is assumed that each meter is
measured against a single phase of power from the mains. The reason for making this assumption
is that while the total overlayed usage of power is inspected for each quarter, for each meter and
the plots were made and the result is a significant pattern. Usually, all these power meters are the
same for both the trough months as well as the peak months, where the peaks do occur during
period of weather condition, which is warmer. An excess of 10 kW has been assumed for the fact
that air-condition is run through the power of three phases and it is considered as a valid
assumption.
It is known fact that the air-conditioner is considered as a major usage of energy, per
phase, it is difficult to estimate, at what phase, which part of the home’s overall power
consumption is made. However, there are certain differences and signs, in the overall usage of
power for each phase and the same determines the point of usage of power.
THE SITE
The house is located in a city Brisbane, in Australia. Energy billing history is considered
from a few months and just a previous year. The energy audit has been done in dwelling and the
process is started with the visual inspection of the equipment and areas. The inspection is
conducted by understanding and anlayzing the ventilation system towards better analysis of the
light and heat inflow and outflow. Then a survey has been made with the checklists of the
appliances existing and their frequency of usage.
General Characteristics of the Site
The occupants dwelling inside the house are contacted for the interview. The occupants
are interviewed, to know their day to day habits of applications of the electrical appliances. So, it
becomes the basis of how much and what are the electrical appliances are running in a day. The
occupants are also asked for their staying time in the house, to understand the constraints in the
timing and the operation and access time to facilities of the electrical appliances (Tuominen et al,
2015). Various resources that they have been using are also investigated, to investigate, whether
any alternative or renewable energy resources, such as solar system or wind power energy has
been used or not.
The house contains the main consumers of power, as the electrical appliances that take
higher power with lower times of operation. The other category is the electrical appliances of
low power consumption having higher operational times. Usually, power users use such kind of
electrical equipment at the house and so inspection has to focus majorly on these main points,
while the audit is performed. The impact of the small power consumers, who make use of the
phone chargers, etc., is usually smaller and still these things are also inspected and measured for
the impact on the overall consumption of power at home.
For instance the low operational time and higher power appliances are microwave, oven,
kettle, vacuum cleaner, iron and stove top. On the other hand, the high operational time and
lower power consumed appliances are usually, the electrical appliances operating most of the
time, both during the night and day. Such things are usually, freezer, fridge, fans, fridge freezer,
etc., which are more prominently used during the summer. The lights are used continuously,
however these lights continue only for half a day. The same is applied to the televisions,
especially, LCD televisions. There are many other standby devices and they have minimum
impact to the overall consumption of the power, in the auditing house.
General Description of Main Appliances
Heating and Cooling
The main focus on the heating and cooling elements is that air-conditioning system. The
auditing house consists of a major system of heating and cooling, as reverse cycle is also ducted,
⊘ This is a preview!⊘
Do you want full access?
Subscribe today to unlock all pages.
Trusted by 1+ million students worldwide
for air conditioner. However, the major usage of the air-conditioner is for cooling and so used for
the period of summer, though it is used occasionally, especially, during the afternoons of winter.
So, a single major contributor for the overall consumption of power is deeded to be the air-
conditioner, throughout the year (Barbara & Wolfgang, 2012). The same is learned by monitoring
the power meter, from the average usage of constant power, which is close to 0.7 KW, instantly,
the consumption of power jumps to 10 KW excess, right after turning on the air-conditioner. A
three phase power point is used for powering the air-conditioner.
Hot Water
The house that is being audited has a single station of hot water. The station is powered
with gas and is manufactured to work with highest rating of star, in terms of efficiency. Since this
audit system measures only electrical power, this gas system is ignored and uncovered in this
report.
Lighting
The system for lighting is majorly, halogen down lights having compact fluorescent
lighting. It is used partially, at the house. The main light source is in a kitchen, which is a twin,
short, linear, white linear fluorescent tube. It eliminates the need for halogen down lights,
providing enough light, in the living area.
PC
The auditing house has the set-up for two personal computers, which are configured to be
from moderate to high end and are regularly used. And apart from that, there are also many
‘plug-ins’ for connecting to the computers. Such devices range from extra cooling fans to the
additional external screens (Brown et al, 2008). Mostly used laptop is placed in the study room.
It is considered for the audit report, because it is used for the need of instantaneous requirement
for the device. The laptop power rating from the specification of the charger is considered to be a
reference point and found to have 150 watts. Measurement is also done for another set-up of the
personal computer and the results are again analyzed.
ENERGY CONSUMPTION
The energy audit has been conducted for a house that is not very old, but of total five
years of age. The audit has found the fact that this particular house has got its power bills
Paraphrase This Document
Need a fresh take? Get an instant paraphrase of this document with our AI Paraphraser
increasing to higher incremental stages, from the first power bill to the second power bill. Such
houses are the important concern, in the national interest, since they are primary reasons for the
incremental global carbon footprints (Energiewende, 2014).
The average and most frequently used domestic energy consumption in the houses are
majorly from the following appliances, such as,
Heating
Lighting
Cooling and refrigeration
Hot water
Cooking
Washing and drying
Miscellaneous electric load
Usage Summary
The usage summary gives an analyzed report of what and how the power has been
consumed and the best part is that the power consumed compared and summarized according to
various elements. According to the usage summary of the report bills,
Overall Consumption and Seasonal Consumption and Relative Charges
First bill
Total average usage per day is 13.22 kWh, which has incurred the cost of $4.39 for a
single day. Daily usage and cost per day have been increased from 10.62 kWh in the previous
year to 13.22 kWh, in this year. The summary bill also clearly shows the total greenhouse gas
emissions resulted from the power consumption of the electrical appliances in this house. The
summary also shows the percentage of increase or decrease from the previous year. So, the total
greenhouse gas emission for this year is 1.1 tonnes, which is an increase from 0.9 tonnes.
So, the increased usage of daily power usage in this year = 13.22 – 10.62 kWh = 2.6
kWh,
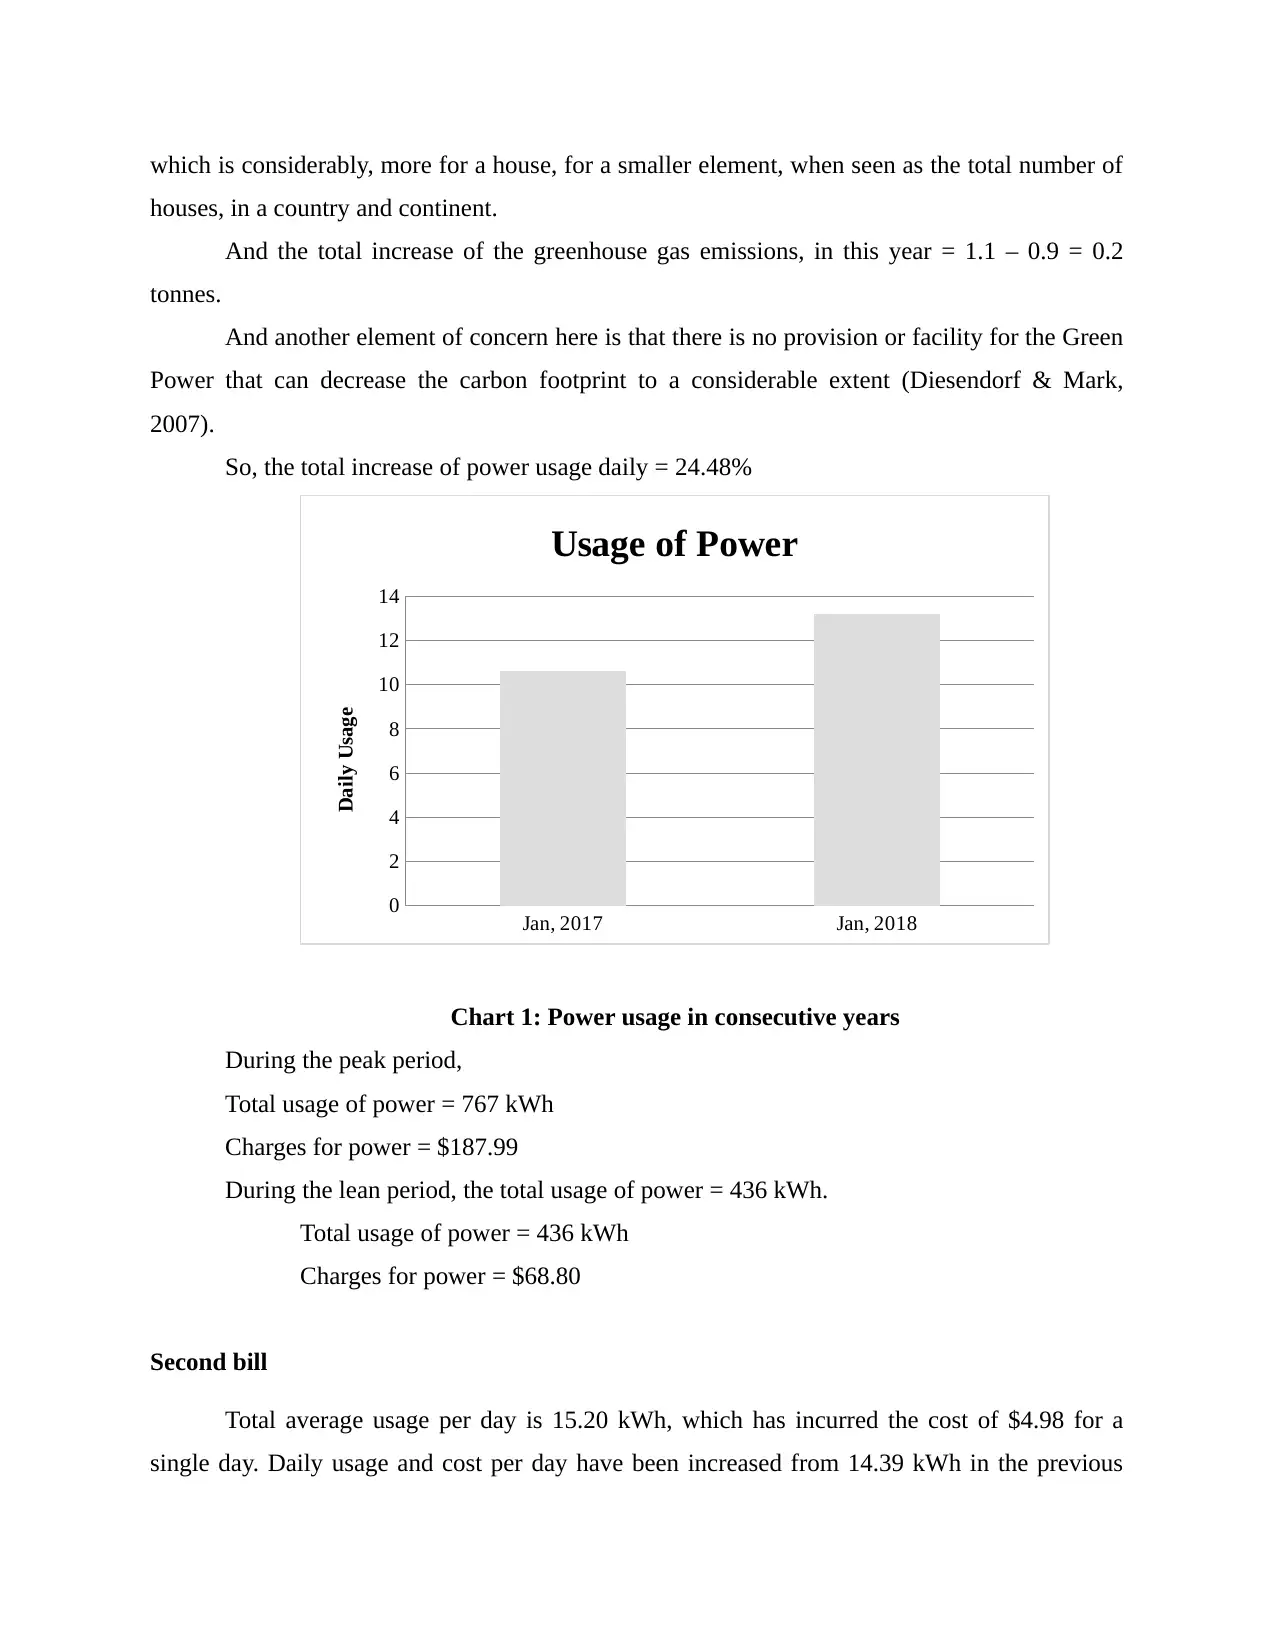
which is considerably, more for a house, for a smaller element, when seen as the total number of
houses, in a country and continent.
And the total increase of the greenhouse gas emissions, in this year = 1.1 – 0.9 = 0.2
tonnes.
And another element of concern here is that there is no provision or facility for the Green
Power that can decrease the carbon footprint to a considerable extent (Diesendorf & Mark,
2007).
So, the total increase of power usage daily = 24.48%
Jan, 2017 Jan, 2018
0
2
4
6
8
10
12
14
Usage of Power
Daily Usage
Chart 1: Power usage in consecutive years
During the peak period,
Total usage of power = 767 kWh
Charges for power = $187.99
During the lean period, the total usage of power = 436 kWh.
Total usage of power = 436 kWh
Charges for power = $68.80
Second bill
Total average usage per day is 15.20 kWh, which has incurred the cost of $4.98 for a
single day. Daily usage and cost per day have been increased from 14.39 kWh in the previous
⊘ This is a preview!⊘
Do you want full access?
Subscribe today to unlock all pages.
Trusted by 1+ million students worldwide
1 out of 30
Related Documents


Your All-in-One AI-Powered Toolkit for Academic Success.
+13062052269
info@desklib.com
Available 24*7 on WhatsApp / Email
![[object Object]](/_next/static/media/star-bottom.7253800d.svg)
Unlock your academic potential
Copyright © 2020–2026 A2Z Services. All Rights Reserved. Developed and managed by ZUCOL.