Statistical Analysis Project: Analysis of Residential Property Data

Verified

Added on  2022/08/23

|5
|587
|19
Project
AI Summary
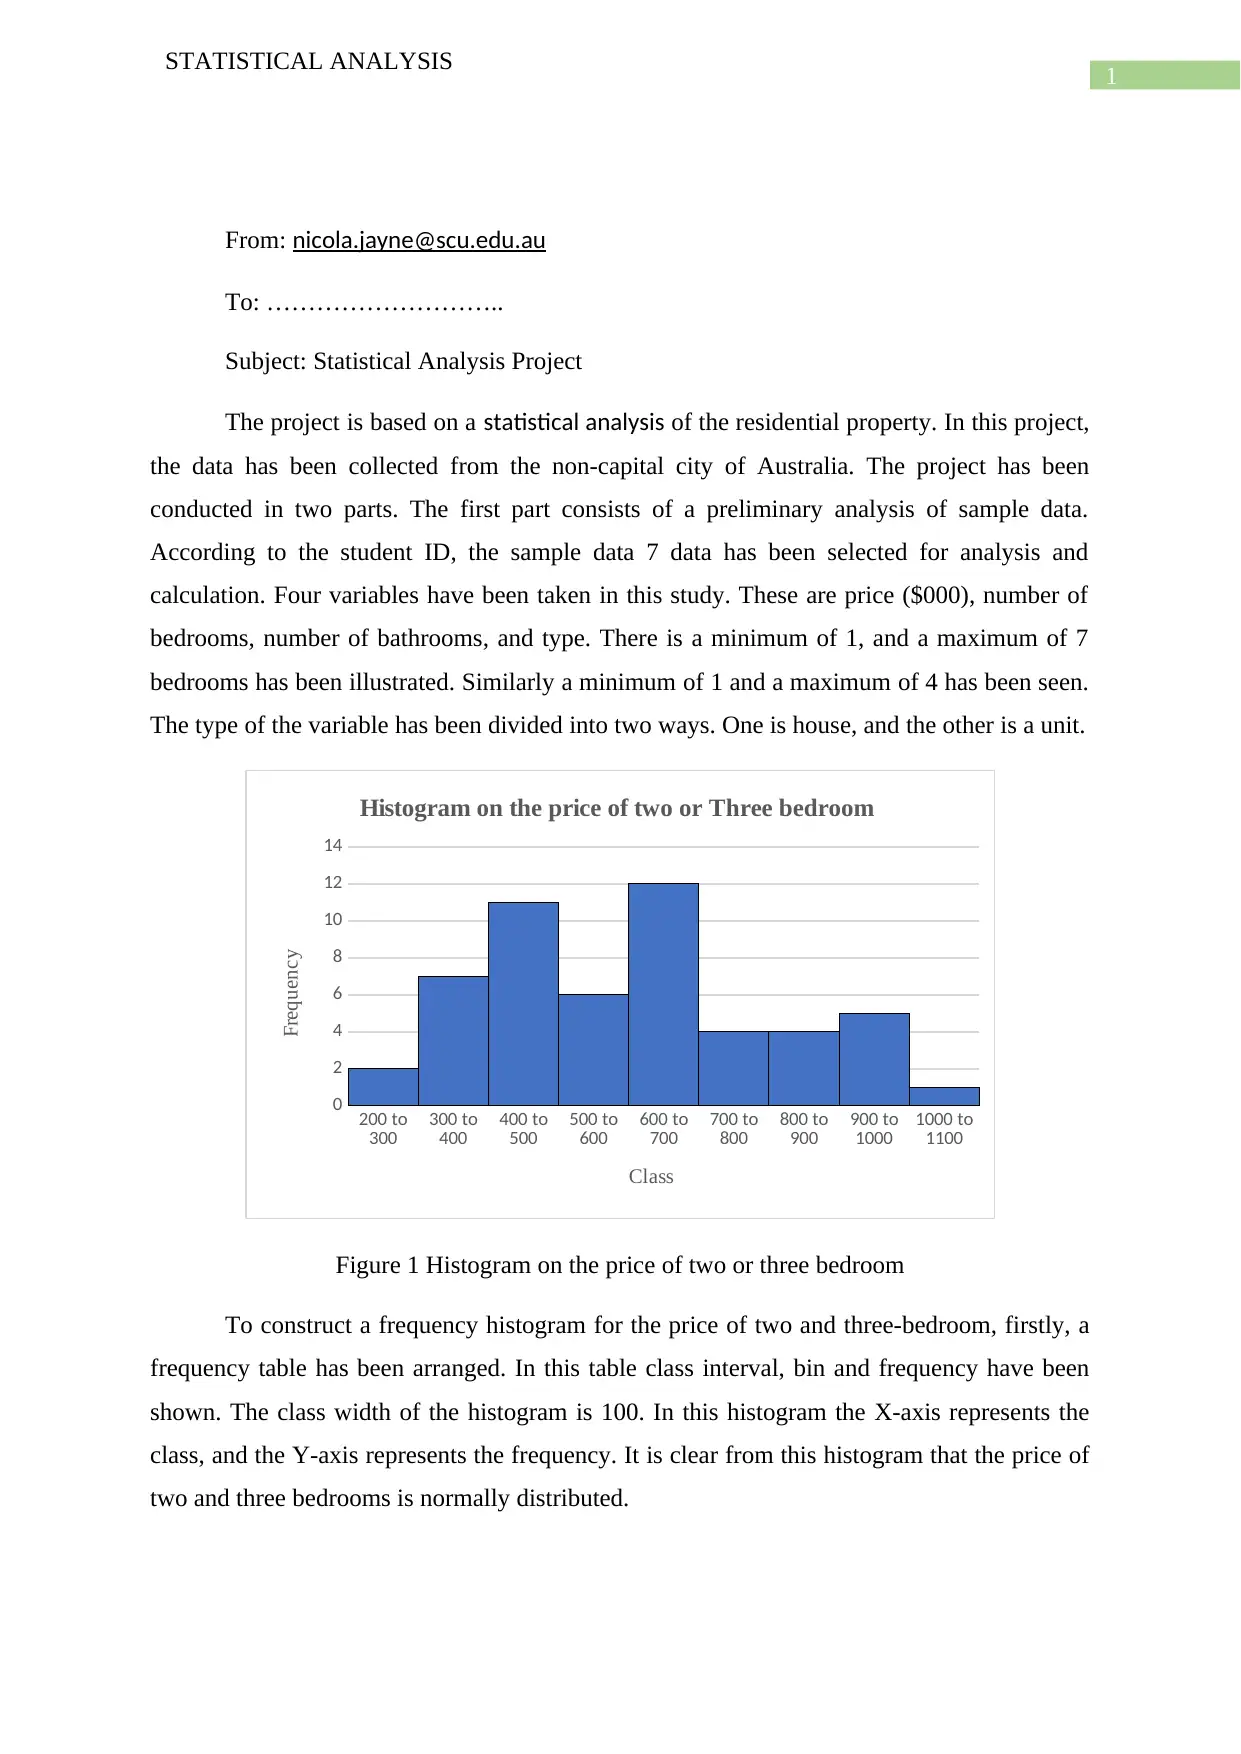
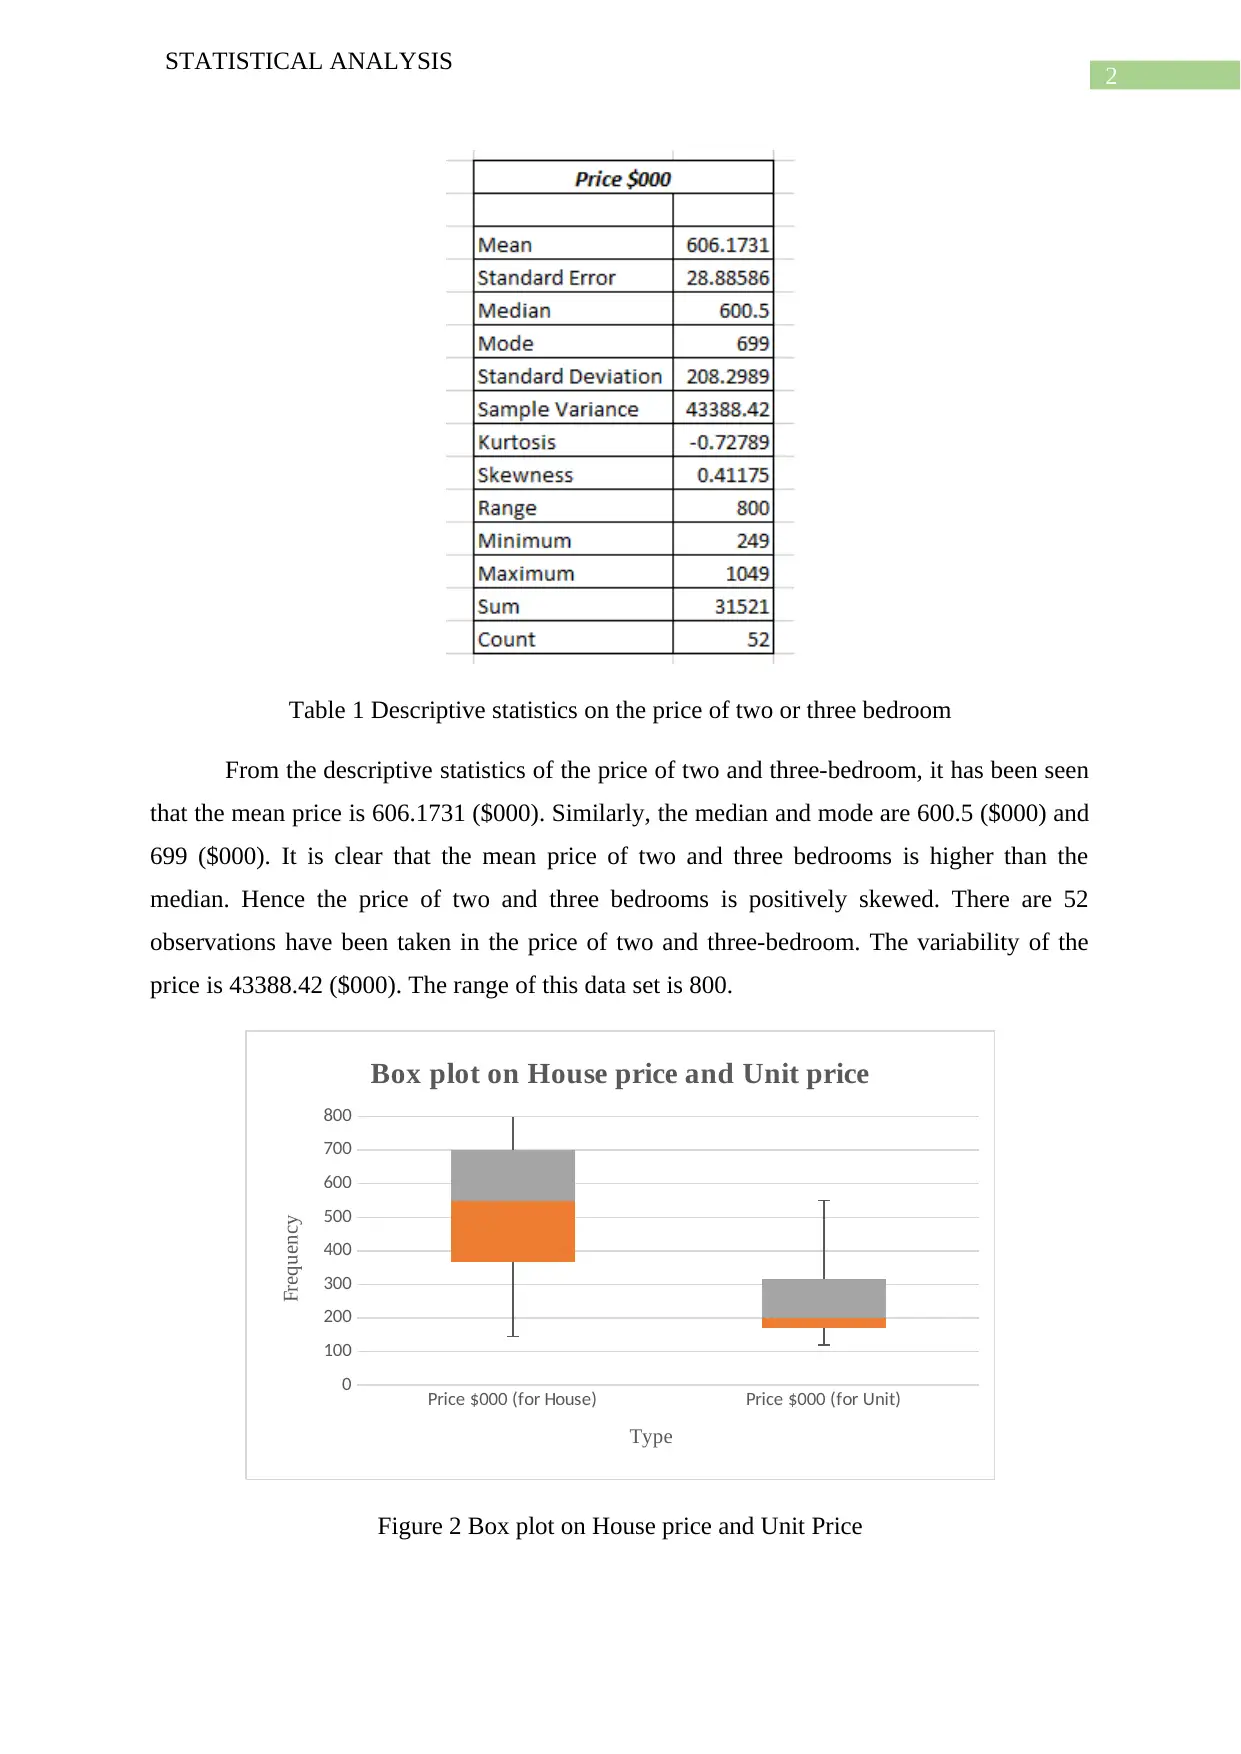
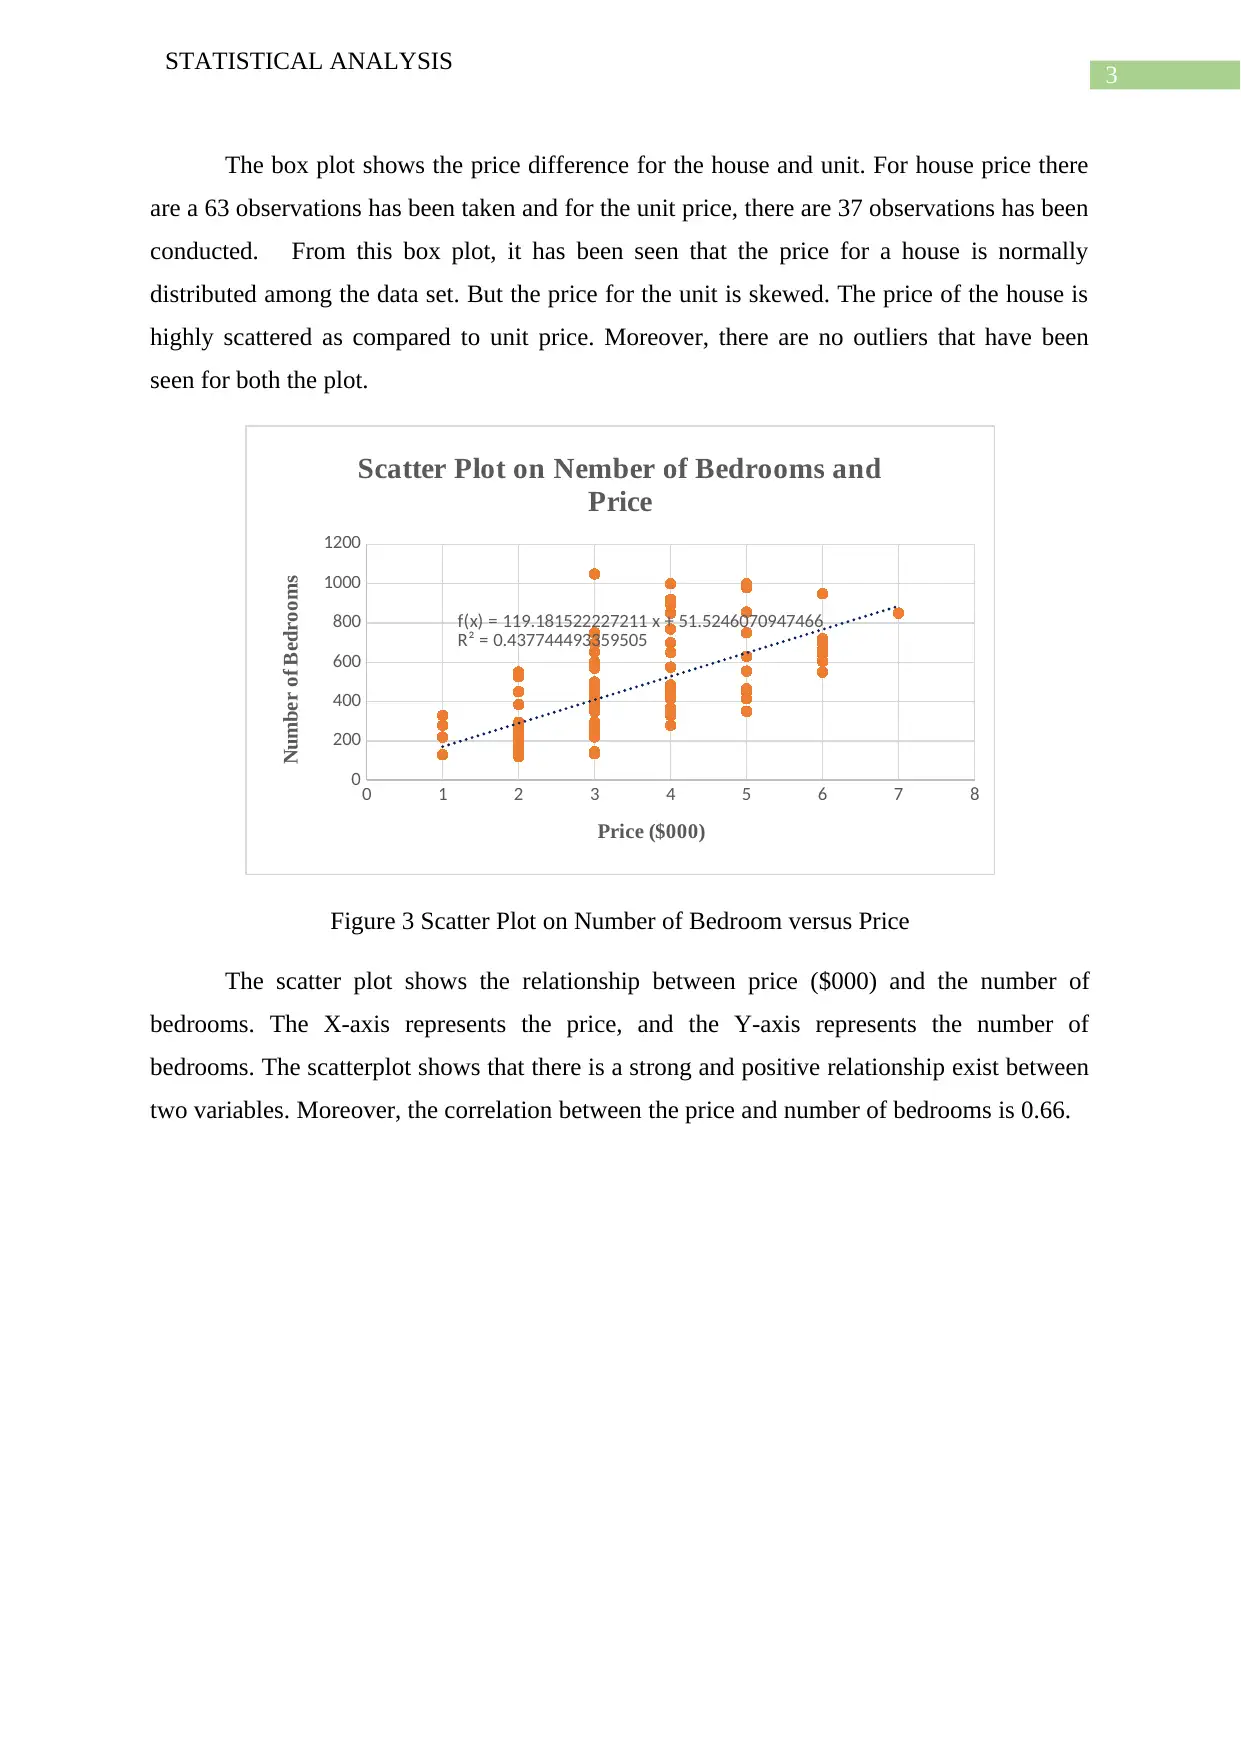
This project presents a statistical analysis of residential property data from a non-capital city in Australia. The analysis is divided into two parts, focusing on sample data selected based on the student ID. The study examines four variables: price, number of bedrooms, number of bathrooms, and property type (house or unit). The first part involves a preliminary analysis, including constructing a frequency histogram for the price of two and three-bedroom properties, descriptive statistics, and a box plot comparing house and unit prices. A scatter plot illustrates the relationship between the number of bedrooms and the property price. The project employs statistical tools to explore data distribution, central tendency, and relationships between variables, providing insights into the property market.
tabler-icon-diamond-filled.svg

Contribute Materials

Your contribution can guide someone’s learning journey. Share your documents today.
Document Page
Running head: STATISTICAL ANALYSIS
Statistical Analysis Project
Name of the Student:
Name of the University:
Author note:
tabler-icon-diamond-filled.svg

Secure Best Marks with AI Grader

Need help grading? Try our AI Grader for instant feedback on your assignments.
Document Page
1
STATISTICAL ANALYSIS
From: nicola.jayne@scu.edu.au
To: ………………………..
Subject: Statistical Analysis Project
The project is based on a statistical analysis of the residential property. In this project,
the data has been collected from the non-capital city of Australia. The project has been
conducted in two parts. The first part consists of a preliminary analysis of sample data.
According to the student ID, the sample data 7 data has been selected for analysis and
calculation. Four variables have been taken in this study. These are price ($000), number of
bedrooms, number of bathrooms, and type. There is a minimum of 1, and a maximum of 7
bedrooms has been illustrated. Similarly a minimum of 1 and a maximum of 4 has been seen.
The type of the variable has been divided into two ways. One is house, and the other is a unit.
200 to
300 300 to
400 400 to
500 500 to
600 600 to
700 700 to
800 800 to
900 900 to
1000 1000 to
1100
0
2
4
6
8
10
12
14
Histogram on the price of two or Three bedroom
Class
Frequency
Figure 1 Histogram on the price of two or three bedroom
To construct a frequency histogram for the price of two and three-bedroom, firstly, a
frequency table has been arranged. In this table class interval, bin and frequency have been
shown. The class width of the histogram is 100. In this histogram the X-axis represents the
class, and the Y-axis represents the frequency. It is clear from this histogram that the price of
two and three bedrooms is normally distributed.
Document Page
2
STATISTICAL ANALYSIS
Table 1 Descriptive statistics on the price of two or three bedroom
From the descriptive statistics of the price of two and three-bedroom, it has been seen
that the mean price is 606.1731 ($000). Similarly, the median and mode are 600.5 ($000) and
699 ($000). It is clear that the mean price of two and three bedrooms is higher than the
median. Hence the price of two and three bedrooms is positively skewed. There are 52
observations have been taken in the price of two and three-bedroom. The variability of the
price is 43388.42 ($000). The range of this data set is 800.
Price $000 (for House) Price $000 (for Unit)
0
100
200
300
400
500
600
700
800
Box plot on House price and Unit price
Type
Frequency
Figure 2 Box plot on House price and Unit Price
Document Page
3
STATISTICAL ANALYSIS
The box plot shows the price difference for the house and unit. For house price there
are a 63 observations has been taken and for the unit price, there are 37 observations has been
conducted. From this box plot, it has been seen that the price for a house is normally
distributed among the data set. But the price for the unit is skewed. The price of the house is
highly scattered as compared to unit price. Moreover, there are no outliers that have been
seen for both the plot.
0 1 2 3 4 5 6 7 8
0
200
400
600
800
1000
1200
f(x) = 119.181522227211 x + 51.5246070947466
R² = 0.437744493359505
Scatter Plot on Nember of Bedrooms and
Price
Price ($000)
Number of Bedrooms
Figure 3 Scatter Plot on Number of Bedroom versus Price
The scatter plot shows the relationship between price ($000) and the number of
bedrooms. The X-axis represents the price, and the Y-axis represents the number of
bedrooms. The scatterplot shows that there is a strong and positive relationship exist between
two variables. Moreover, the correlation between the price and number of bedrooms is 0.66.
tabler-icon-diamond-filled.svg

Secure Best Marks with AI Grader

Need help grading? Try our AI Grader for instant feedback on your assignments.
Document Page
4
STATISTICAL ANALYSIS
chevron_up_icon
1 out of 5
circle_padding
hide_on_mobile
zoom_out_icon
logo.png

Your All-in-One AI-Powered Toolkit for Academic Success.

Available 24*7 on WhatsApp / Email

[object Object]