Business Decision Making Report: New Restaurant Chain in London
VerifiedAdded on 2019/12/03
|24
|5124
|177
Report
AI Summary
This report provides a comprehensive analysis of business decision-making processes for a new restaurant chain planned for London. The study begins with an introduction to the concept of business decision-making and its importance in enhancing profitability and sustainability. The report focuses on market research to assess the project's feasibility. It includes a detailed explanation of primary and secondary data collection methods, with primary data gathered through survey methodology and questionnaires distributed to a sample of 50 consumers. The secondary data is collected from online articles, blogs, and publishers. The report presents statistical descriptions of sales and profits from 2005 to 2014, including calculations of mean, median, mode, and standard deviation, followed by an evaluation of the primary data collected. The analysis includes customer preferences regarding restaurant visits, food preferences, price points, and service quality. Furthermore, the report concludes with a discussion on the volatile trends in the restaurant business and the significance of customer satisfaction and the measure of dispersion including variance and standard deviation.

BUSINESS DECISION MAKING
Paraphrase This Document
Need a fresh take? Get an instant paraphrase of this document with our AI Paraphraser
TABLE OF CONTENTS
INTRODUCTION...........................................................................................................................4
TASK 1: Sources to collect Primary and secondary Data...............................................................4
1.1.................................................................................................................................................4
1.2.................................................................................................................................................5
1.3.................................................................................................................................................5
2.1.................................................................................................................................................6
2.2.................................................................................................................................................8
2.3.................................................................................................................................................9
TASK 2: Business Presentation and Formal Report......................................................................10
3.1...............................................................................................................................................10
3.2...............................................................................................................................................15
3.3...............................................................................................................................................15
4.1...............................................................................................................................................16
4.2...............................................................................................................................................17
4.3...............................................................................................................................................19
CONCLUSION .............................................................................................................................20
REFERENCES .............................................................................................................................22
List of Tables INTRODUCTION
Business decision making is the procedure by which firms identify he most appropriate
option that is available in front of them so as to enhance the business. These decisions aids
towards increasing the overall profitability and productivity thereby leading to growth and
greater sustainability of firm. The current study is based on opening of new restaurant chain in
London.
In order to assure the feasibility of project market research will be conducted. Furthermore,
report will indulge collection of primary data and secondary for analysing the market for
restaurant. In addition to that, various statistical tools and techniques will be utilized so as to aid
towards generation of accurate business results.
TASK 1: Sources to collect Primary and secondary Data
1.1
Data collection any research can be done by making use of primary and secondary data. As
per the given case scenario, the company is planning to expand its current business and also
wishes to open a fast food chain in London. Hence, data collection for the same can be done by
making use of primary and secondary data collection techniques (Hoffman, 2007).
Primary data is a set of those facts and figures which is collected by the researcher for
first time. It is based on the observation of researcher and directly from the respondents in most
of the cases. Furthermore, researcher can collect prime facts through surveys, interviews, direct
observation and questionnaire etc (Ferrell and Fraedrich, 2014). According to the case, primary
data in this research report will be collected through survey methodology. In addition to that, in
order to acquire positive feedbacks from the target group a questionnaire will be prepared and
distributed to the group of people.
On the other hand, secondary data can be termed as the information already collected for
a different purpose. It can further be utilized by researcher for current study. It is also require to
be noted that Primary collection data leads to a lot of time consumption but secondary data uses
less time followed generating crucial information for the researcher. In the present case,
secondary data can be collected through several methods such as online article, blogs, publishers
etc.
3
⊘ This is a preview!⊘
Do you want full access?
Subscribe today to unlock all pages.
Trusted by 1+ million students worldwide
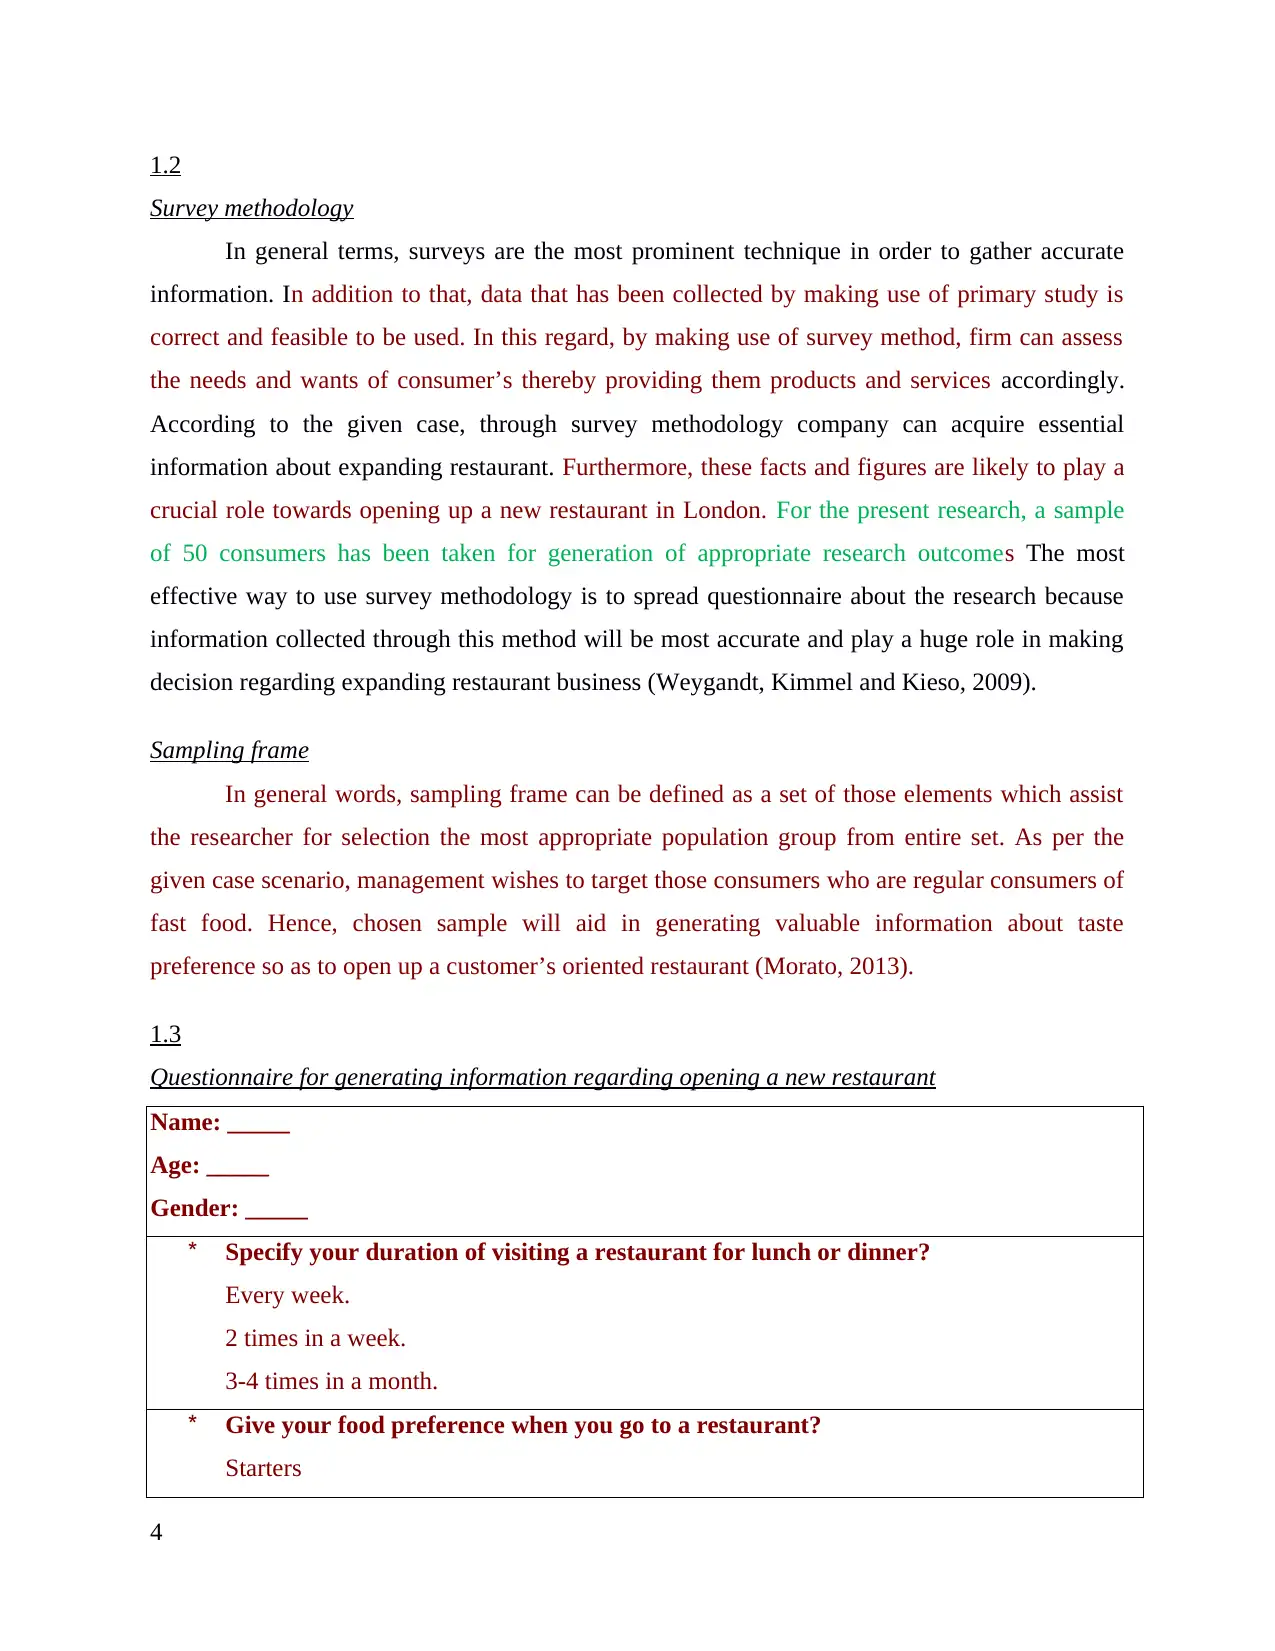
1.2
Survey methodology
In general terms, surveys are the most prominent technique in order to gather accurate
information. In addition to that, data that has been collected by making use of primary study is
correct and feasible to be used. In this regard, by making use of survey method, firm can assess
the needs and wants of consumer’s thereby providing them products and services accordingly.
According to the given case, through survey methodology company can acquire essential
information about expanding restaurant. Furthermore, these facts and figures are likely to play a
crucial role towards opening up a new restaurant in London. For the present research, a sample
of 50 consumers has been taken for generation of appropriate research outcomes The most
effective way to use survey methodology is to spread questionnaire about the research because
information collected through this method will be most accurate and play a huge role in making
decision regarding expanding restaurant business (Weygandt, Kimmel and Kieso, 2009).
Sampling frame
In general words, sampling frame can be defined as a set of those elements which assist
the researcher for selection the most appropriate population group from entire set. As per the
given case scenario, management wishes to target those consumers who are regular consumers of
fast food. Hence, chosen sample will aid in generating valuable information about taste
preference so as to open up a customer’s oriented restaurant (Morato, 2013).
1.3
Questionnaire for generating information regarding opening a new restaurant
Name: _____
Age: _____
Gender: _____
* Specify your duration of visiting a restaurant for lunch or dinner?
Every week.
2 times in a week.
3-4 times in a month.
* Give your food preference when you go to a restaurant?
Starters
4
Paraphrase This Document
Need a fresh take? Get an instant paraphrase of this document with our AI Paraphraser
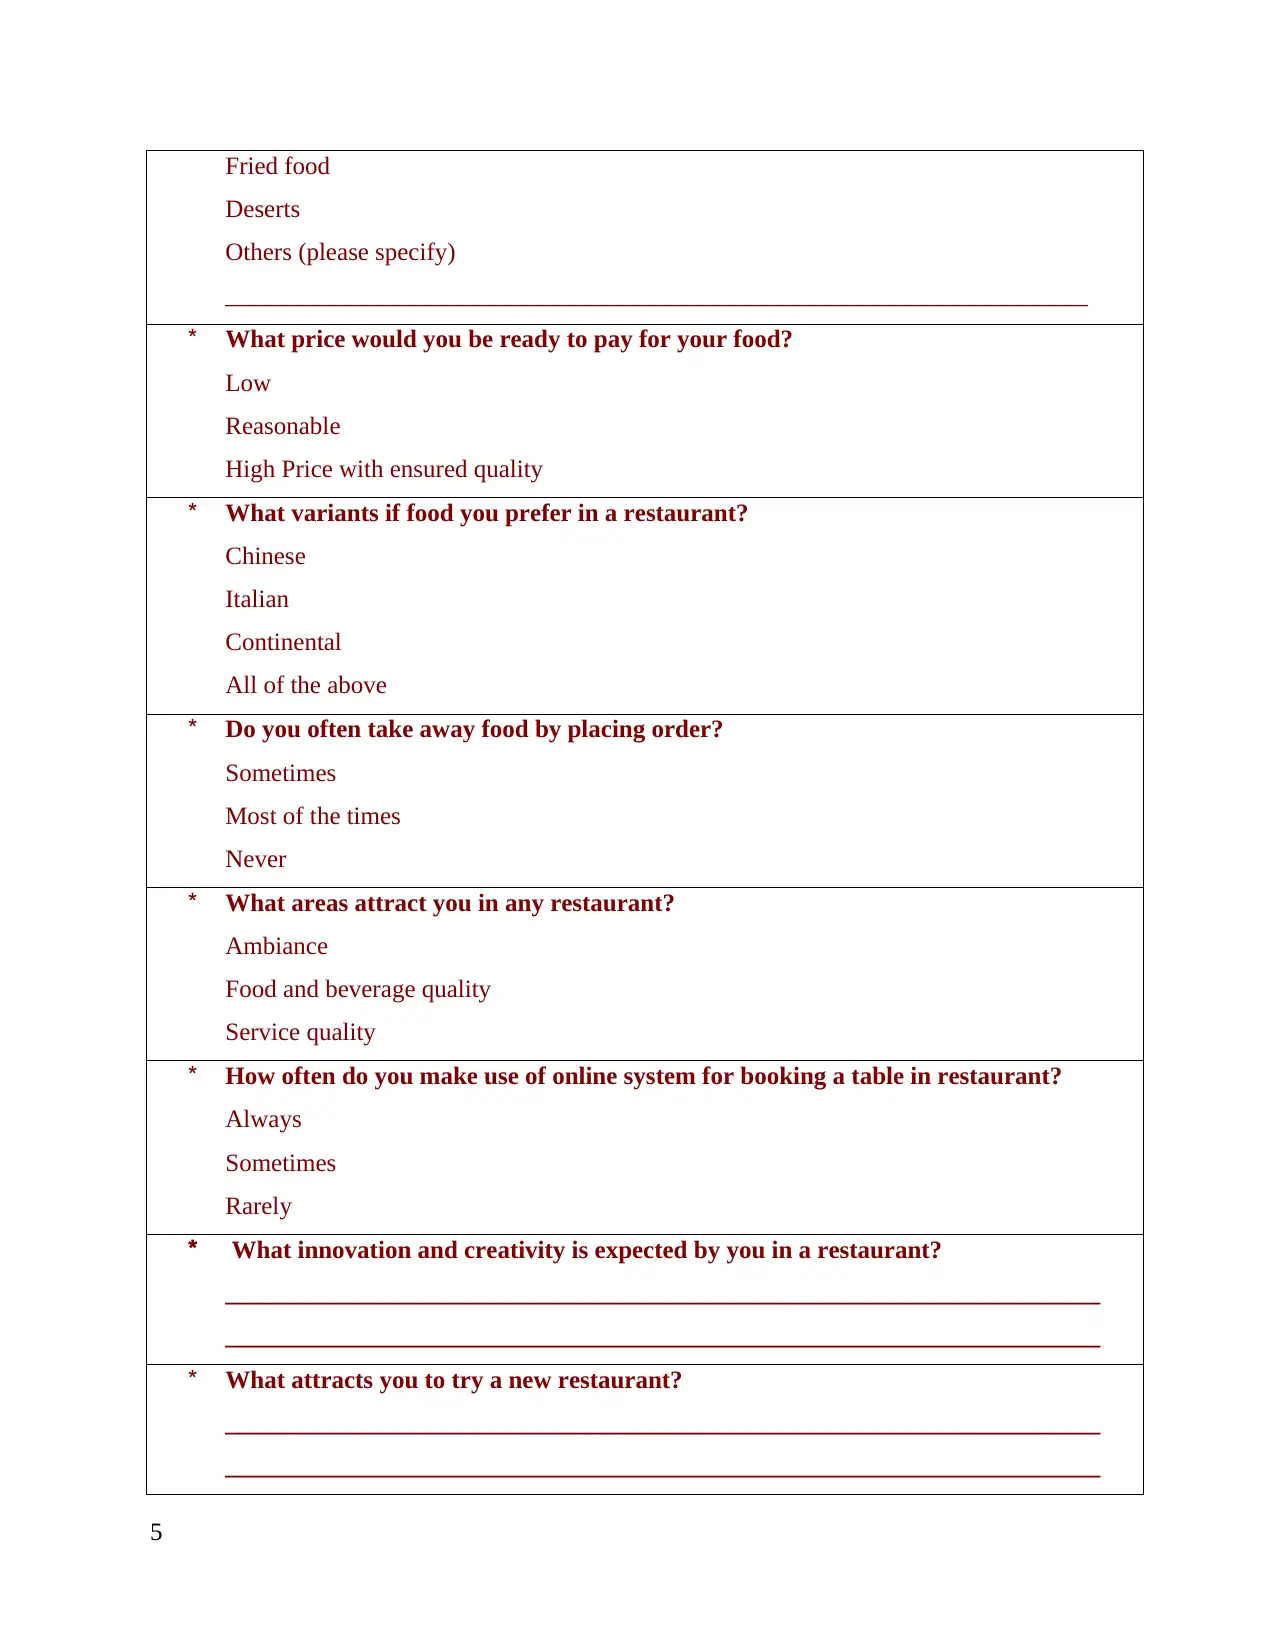
Fried food
Deserts
Others (please specify)
_____________________________________________________________________
* What price would you be ready to pay for your food?
Low
Reasonable
High Price with ensured quality
* What variants if food you prefer in a restaurant?
Chinese
Italian
Continental
All of the above
* Do you often take away food by placing order?
Sometimes
Most of the times
Never
* What areas attract you in any restaurant?
Ambiance
Food and beverage quality
Service quality
* How often do you make use of online system for booking a table in restaurant?
Always
Sometimes
Rarely
* What innovation and creativity is expected by you in a restaurant?
______________________________________________________________________
______________________________________________________________________
* What attracts you to try a new restaurant?
______________________________________________________________________
______________________________________________________________________
5
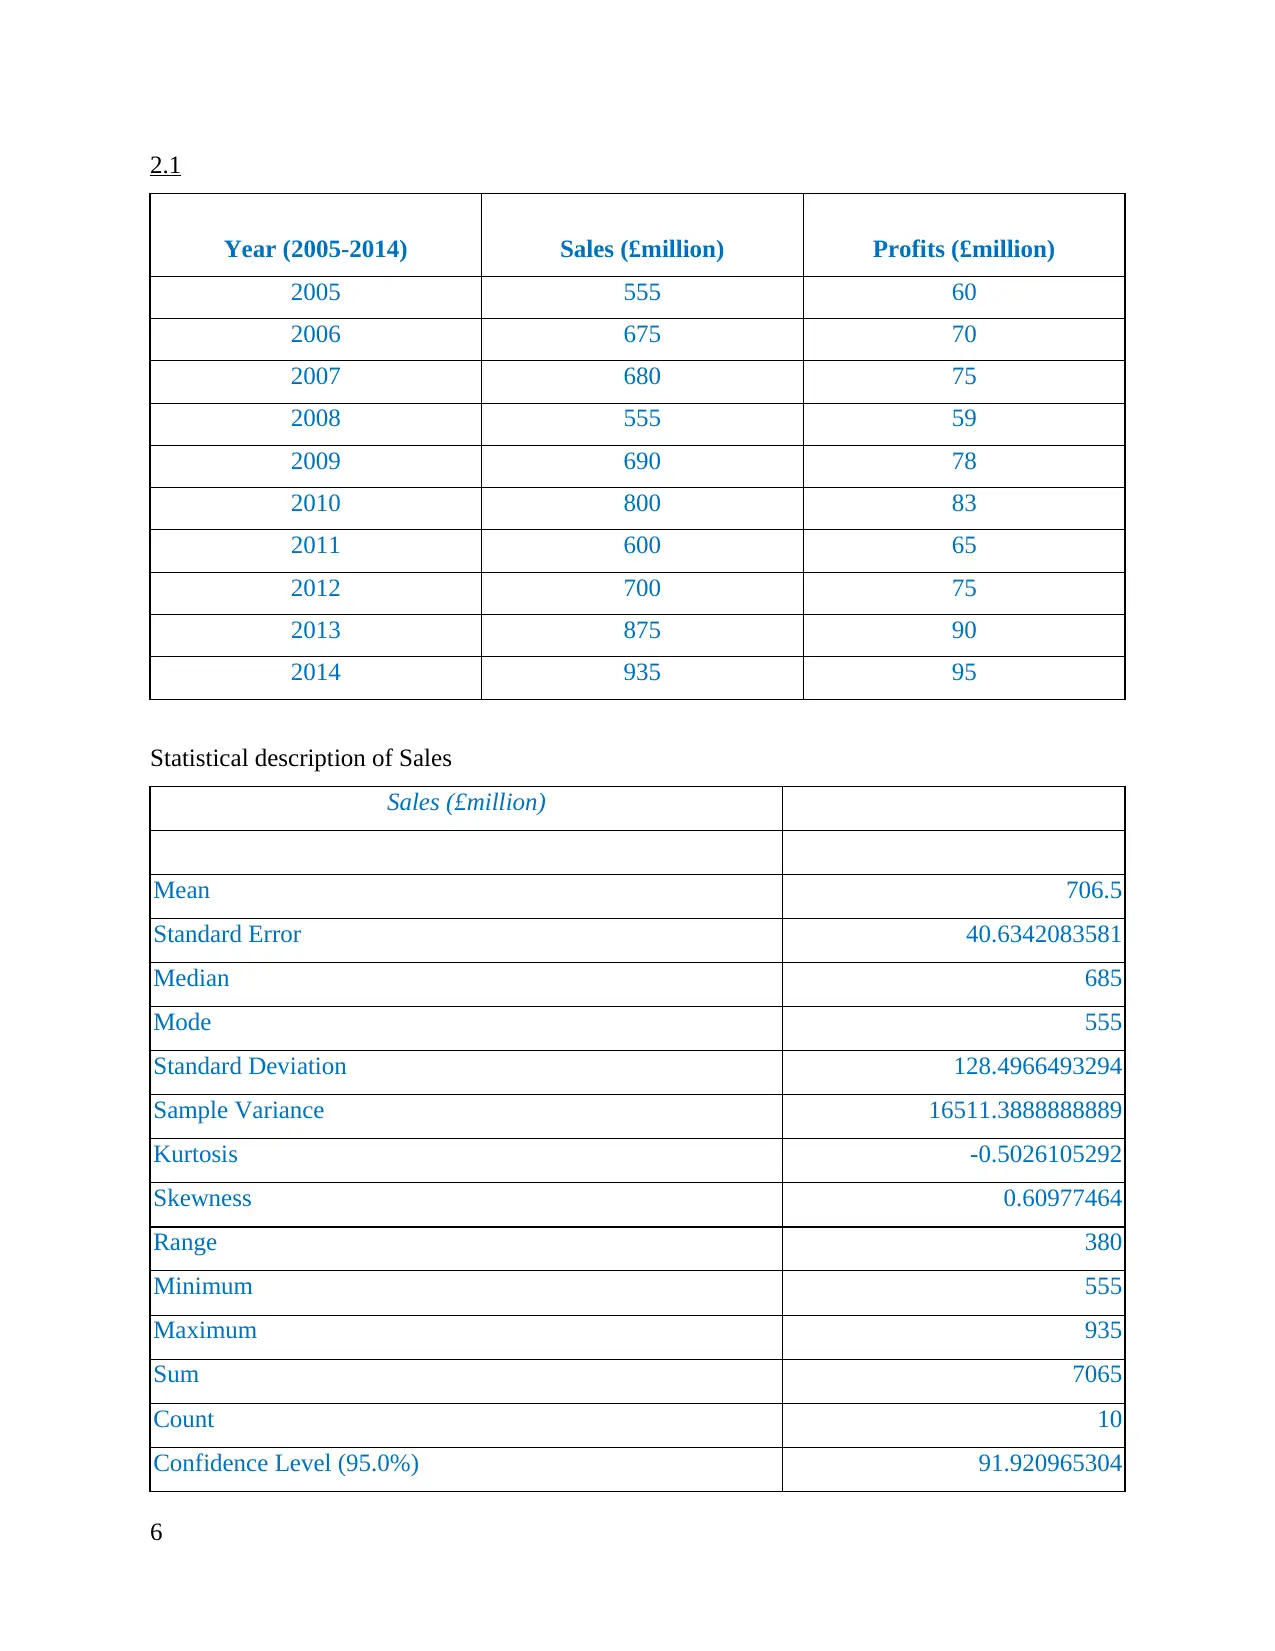
2.1
Year (2005-2014) Sales (£million) Profits (£million)
2005 555 60
2006 675 70
2007 680 75
2008 555 59
2009 690 78
2010 800 83
2011 600 65
2012 700 75
2013 875 90
2014 935 95
Statistical description of Sales
Sales (£million)
Mean 706.5
Standard Error 40.6342083581
Median 685
Mode 555
Standard Deviation 128.4966493294
Sample Variance 16511.3888888889
Kurtosis -0.5026105292
Skewness 0.60977464
Range 380
Minimum 555
Maximum 935
Sum 7065
Count 10
Confidence Level (95.0%) 91.920965304
6
⊘ This is a preview!⊘
Do you want full access?
Subscribe today to unlock all pages.
Trusted by 1+ million students worldwide
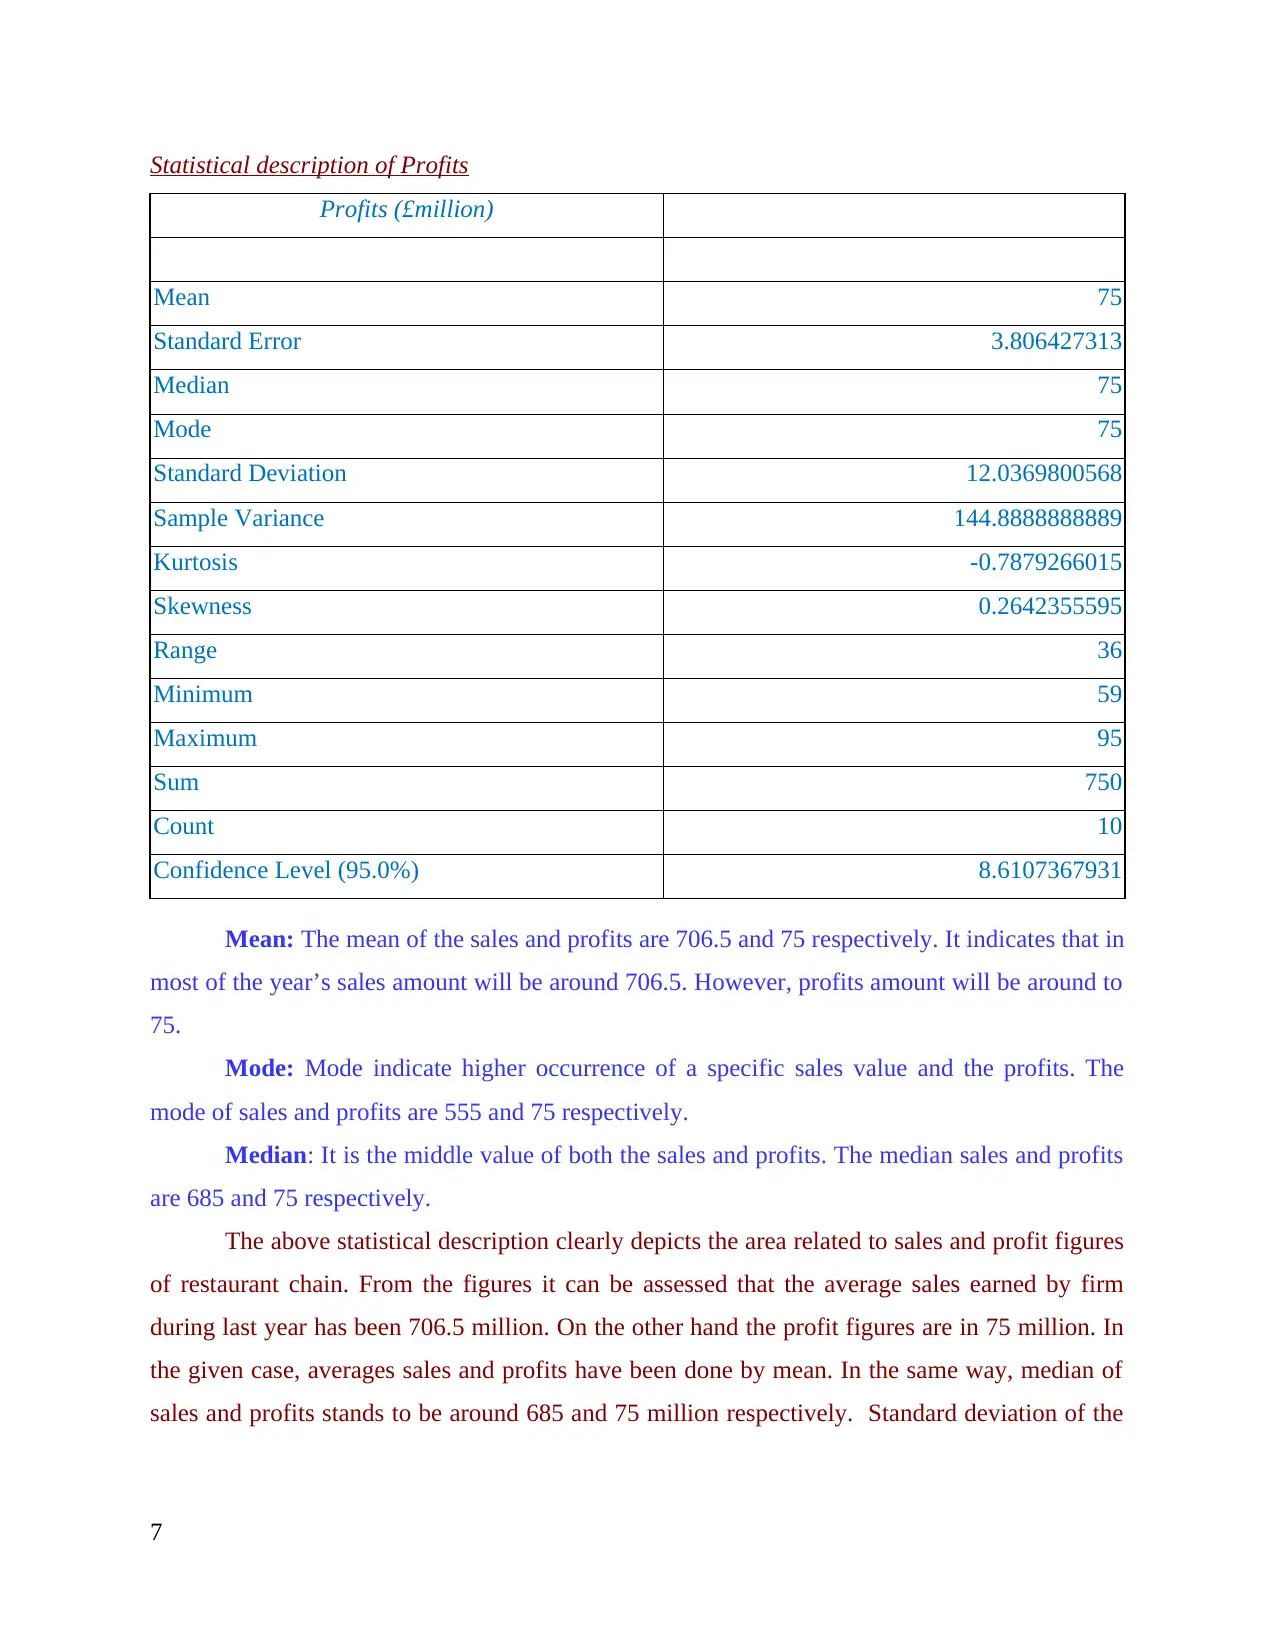
Statistical description of Profits
Profits (£million)
Mean 75
Standard Error 3.806427313
Median 75
Mode 75
Standard Deviation 12.0369800568
Sample Variance 144.8888888889
Kurtosis -0.7879266015
Skewness 0.2642355595
Range 36
Minimum 59
Maximum 95
Sum 750
Count 10
Confidence Level (95.0%) 8.6107367931
Mean: The mean of the sales and profits are 706.5 and 75 respectively. It indicates that in
most of the year’s sales amount will be around 706.5. However, profits amount will be around to
75.
Mode: Mode indicate higher occurrence of a specific sales value and the profits. The
mode of sales and profits are 555 and 75 respectively.
Median: It is the middle value of both the sales and profits. The median sales and profits
are 685 and 75 respectively.
The above statistical description clearly depicts the area related to sales and profit figures
of restaurant chain. From the figures it can be assessed that the average sales earned by firm
during last year has been 706.5 million. On the other hand the profit figures are in 75 million. In
the given case, averages sales and profits have been done by mean. In the same way, median of
sales and profits stands to be around 685 and 75 million respectively. Standard deviation of the
7
Paraphrase This Document
Need a fresh take? Get an instant paraphrase of this document with our AI Paraphraser
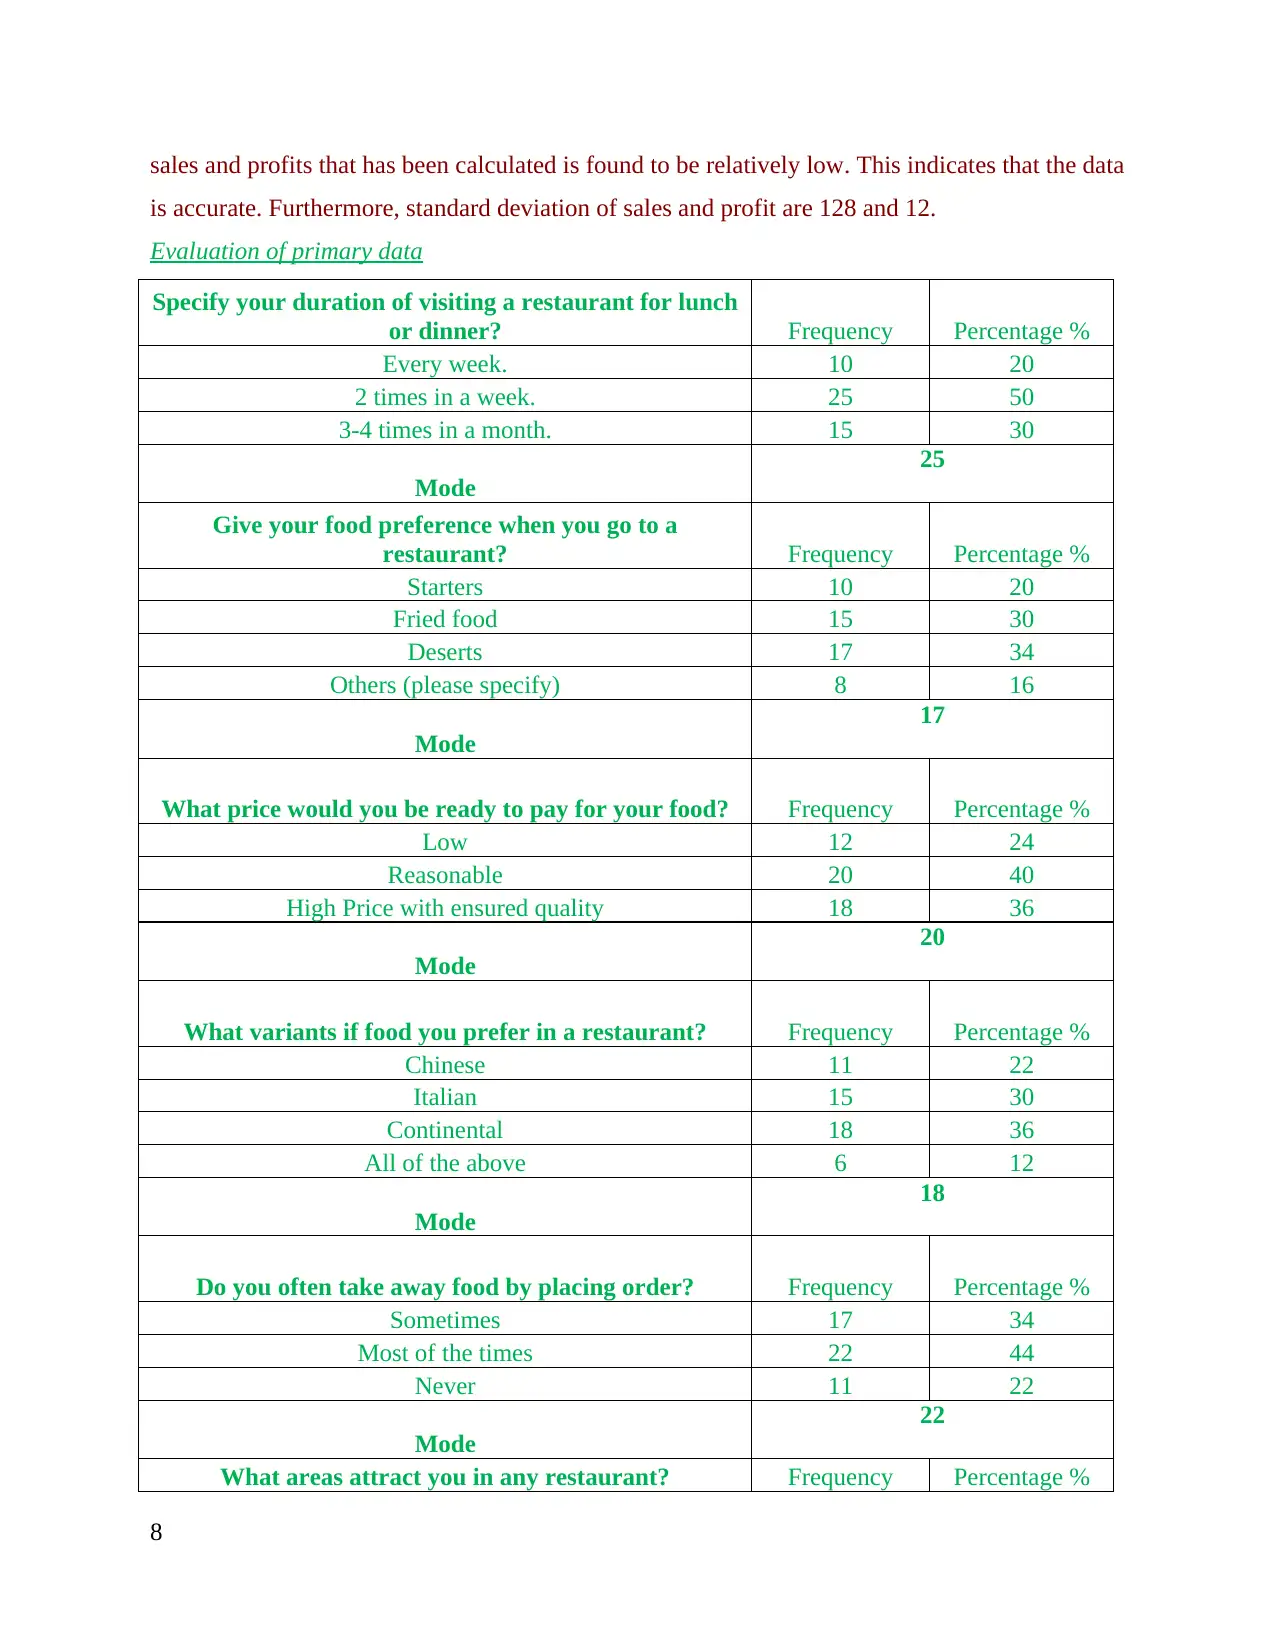
sales and profits that has been calculated is found to be relatively low. This indicates that the data
is accurate. Furthermore, standard deviation of sales and profit are 128 and 12.
Evaluation of primary data
Specify your duration of visiting a restaurant for lunch
or dinner? Frequency Percentage %
Every week. 10 20
2 times in a week. 25 50
3-4 times in a month. 15 30
Mode
25
Give your food preference when you go to a
restaurant? Frequency Percentage %
Starters 10 20
Fried food 15 30
Deserts 17 34
Others (please specify) 8 16
Mode
17
What price would you be ready to pay for your food? Frequency Percentage %
Low 12 24
Reasonable 20 40
High Price with ensured quality 18 36
Mode
20
What variants if food you prefer in a restaurant? Frequency Percentage %
Chinese 11 22
Italian 15 30
Continental 18 36
All of the above 6 12
Mode
18
Do you often take away food by placing order? Frequency Percentage %
Sometimes 17 34
Most of the times 22 44
Never 11 22
Mode
22
What areas attract you in any restaurant? Frequency Percentage %
8
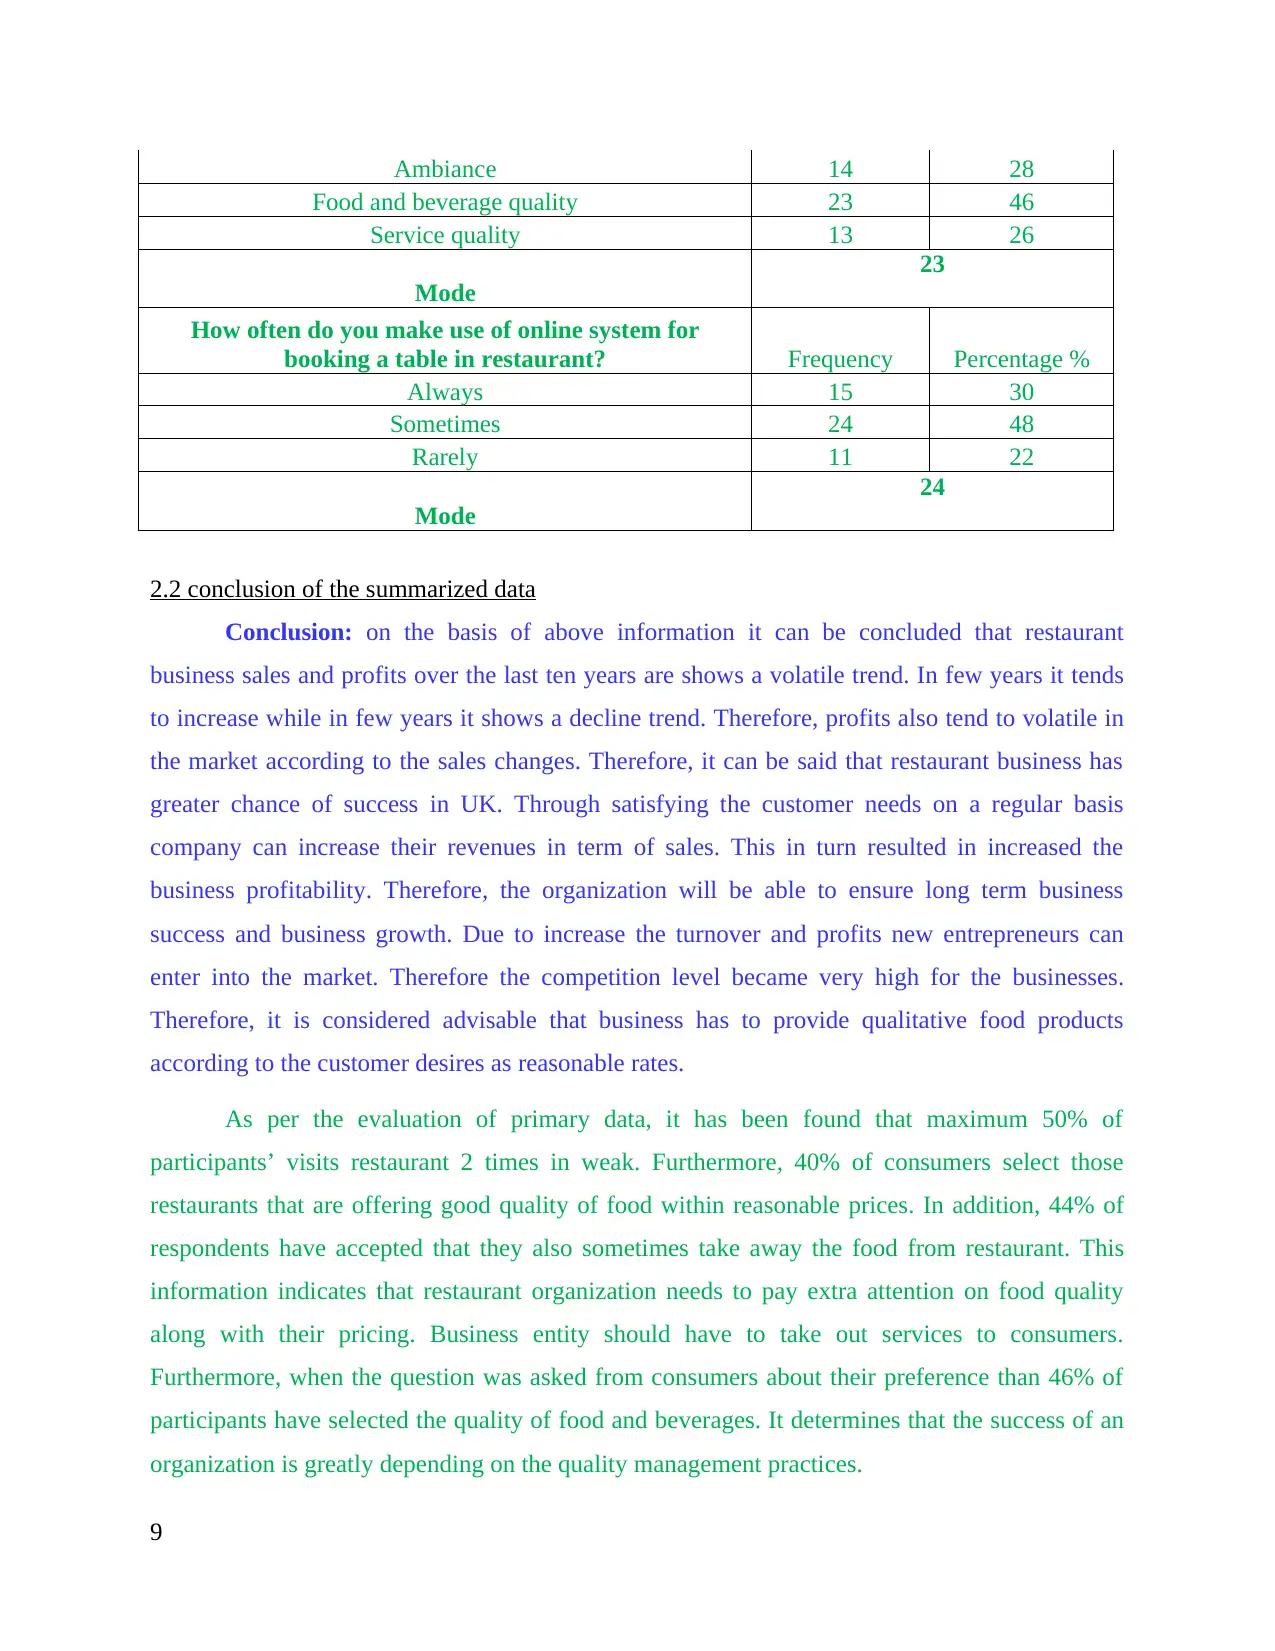
Ambiance 14 28
Food and beverage quality 23 46
Service quality 13 26
Mode
23
How often do you make use of online system for
booking a table in restaurant? Frequency Percentage %
Always 15 30
Sometimes 24 48
Rarely 11 22
Mode
24
2.2 conclusion of the summarized data
Conclusion: on the basis of above information it can be concluded that restaurant
business sales and profits over the last ten years are shows a volatile trend. In few years it tends
to increase while in few years it shows a decline trend. Therefore, profits also tend to volatile in
the market according to the sales changes. Therefore, it can be said that restaurant business has
greater chance of success in UK. Through satisfying the customer needs on a regular basis
company can increase their revenues in term of sales. This in turn resulted in increased the
business profitability. Therefore, the organization will be able to ensure long term business
success and business growth. Due to increase the turnover and profits new entrepreneurs can
enter into the market. Therefore the competition level became very high for the businesses.
Therefore, it is considered advisable that business has to provide qualitative food products
according to the customer desires as reasonable rates.
As per the evaluation of primary data, it has been found that maximum 50% of
participants’ visits restaurant 2 times in weak. Furthermore, 40% of consumers select those
restaurants that are offering good quality of food within reasonable prices. In addition, 44% of
respondents have accepted that they also sometimes take away the food from restaurant. This
information indicates that restaurant organization needs to pay extra attention on food quality
along with their pricing. Business entity should have to take out services to consumers.
Furthermore, when the question was asked from consumers about their preference than 46% of
participants have selected the quality of food and beverages. It determines that the success of an
organization is greatly depending on the quality management practices.
9
⊘ This is a preview!⊘
Do you want full access?
Subscribe today to unlock all pages.
Trusted by 1+ million students worldwide
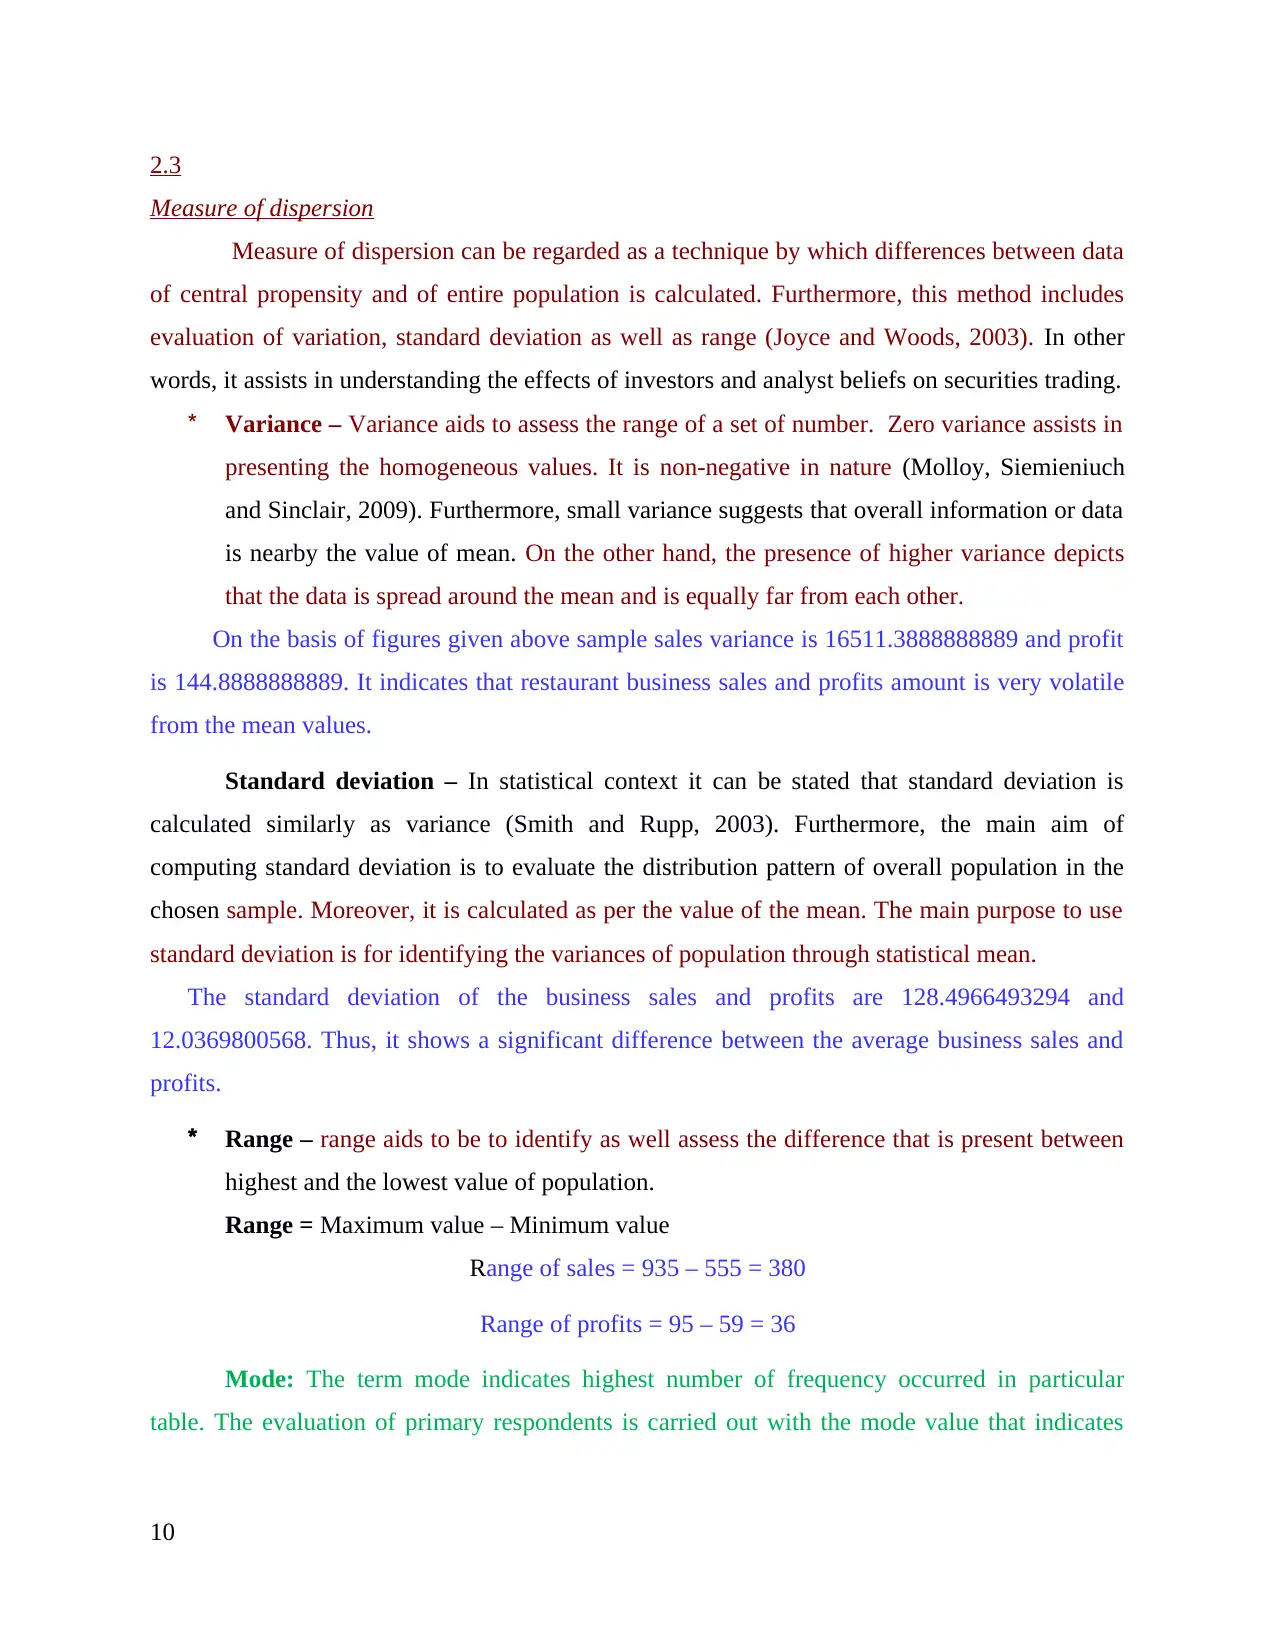
2.3
Measure of dispersion
Measure of dispersion can be regarded as a technique by which differences between data
of central propensity and of entire population is calculated. Furthermore, this method includes
evaluation of variation, standard deviation as well as range (Joyce and Woods, 2003). In other
words, it assists in understanding the effects of investors and analyst beliefs on securities trading.
* Variance – Variance aids to assess the range of a set of number. Zero variance assists in
presenting the homogeneous values. It is non-negative in nature (Molloy, Siemieniuch
and Sinclair, 2009). Furthermore, small variance suggests that overall information or data
is nearby the value of mean. On the other hand, the presence of higher variance depicts
that the data is spread around the mean and is equally far from each other.
On the basis of figures given above sample sales variance is 16511.3888888889 and profit
is 144.8888888889. It indicates that restaurant business sales and profits amount is very volatile
from the mean values.
Standard deviation – In statistical context it can be stated that standard deviation is
calculated similarly as variance (Smith and Rupp, 2003). Furthermore, the main aim of
computing standard deviation is to evaluate the distribution pattern of overall population in the
chosen sample. Moreover, it is calculated as per the value of the mean. The main purpose to use
standard deviation is for identifying the variances of population through statistical mean.
The standard deviation of the business sales and profits are 128.4966493294 and
12.0369800568. Thus, it shows a significant difference between the average business sales and
profits.
* Range – range aids to be to identify as well assess the difference that is present between
highest and the lowest value of population.
Range = Maximum value – Minimum value
Range of sales = 935 – 555 = 380
Range of profits = 95 – 59 = 36
Mode: The term mode indicates highest number of frequency occurred in particular
table. The evaluation of primary respondents is carried out with the mode value that indicates
10
Paraphrase This Document
Need a fresh take? Get an instant paraphrase of this document with our AI Paraphraser
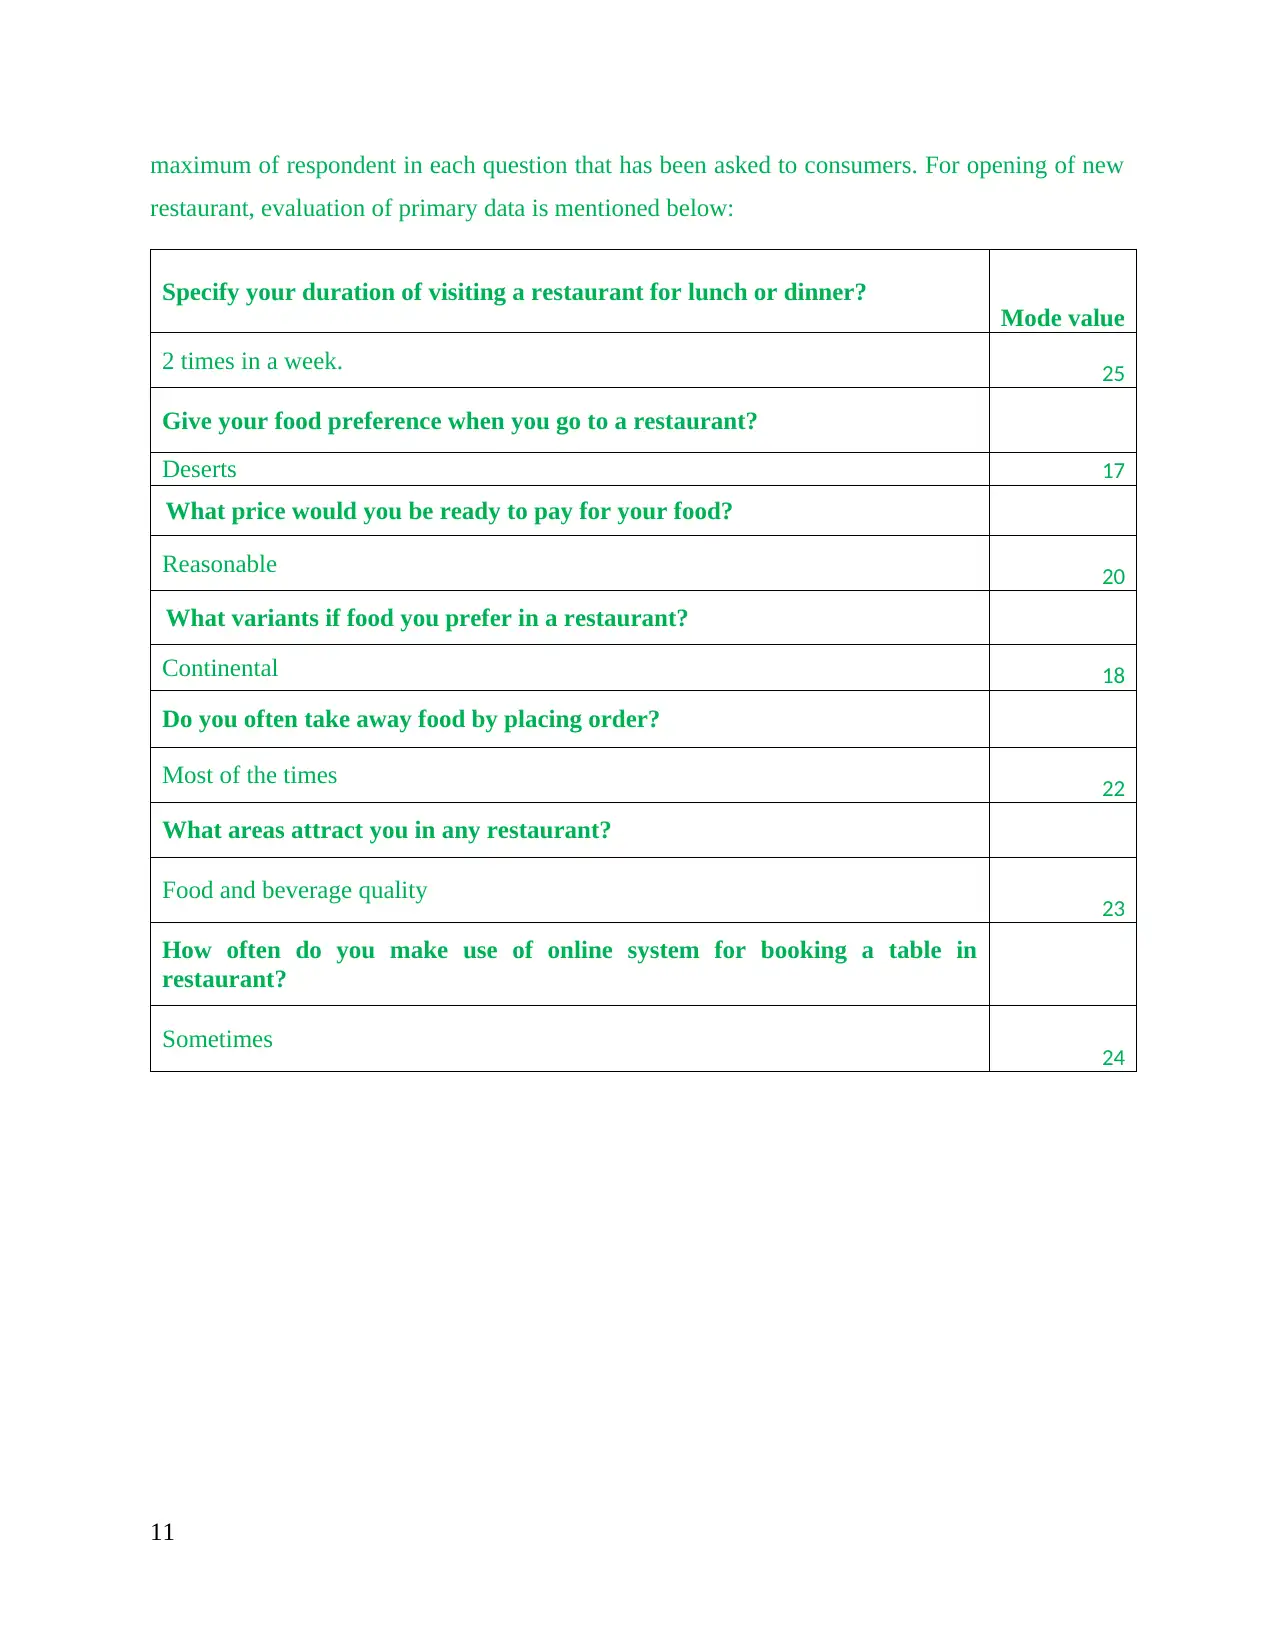
maximum of respondent in each question that has been asked to consumers. For opening of new
restaurant, evaluation of primary data is mentioned below:
Specify your duration of visiting a restaurant for lunch or dinner?
Mode value
2 times in a week. 25
Give your food preference when you go to a restaurant?
Deserts 17
What price would you be ready to pay for your food?
Reasonable 20
What variants if food you prefer in a restaurant?
Continental 18
Do you often take away food by placing order?
Most of the times 22
What areas attract you in any restaurant?
Food and beverage quality 23
How often do you make use of online system for booking a table in
restaurant?
Sometimes 24
11
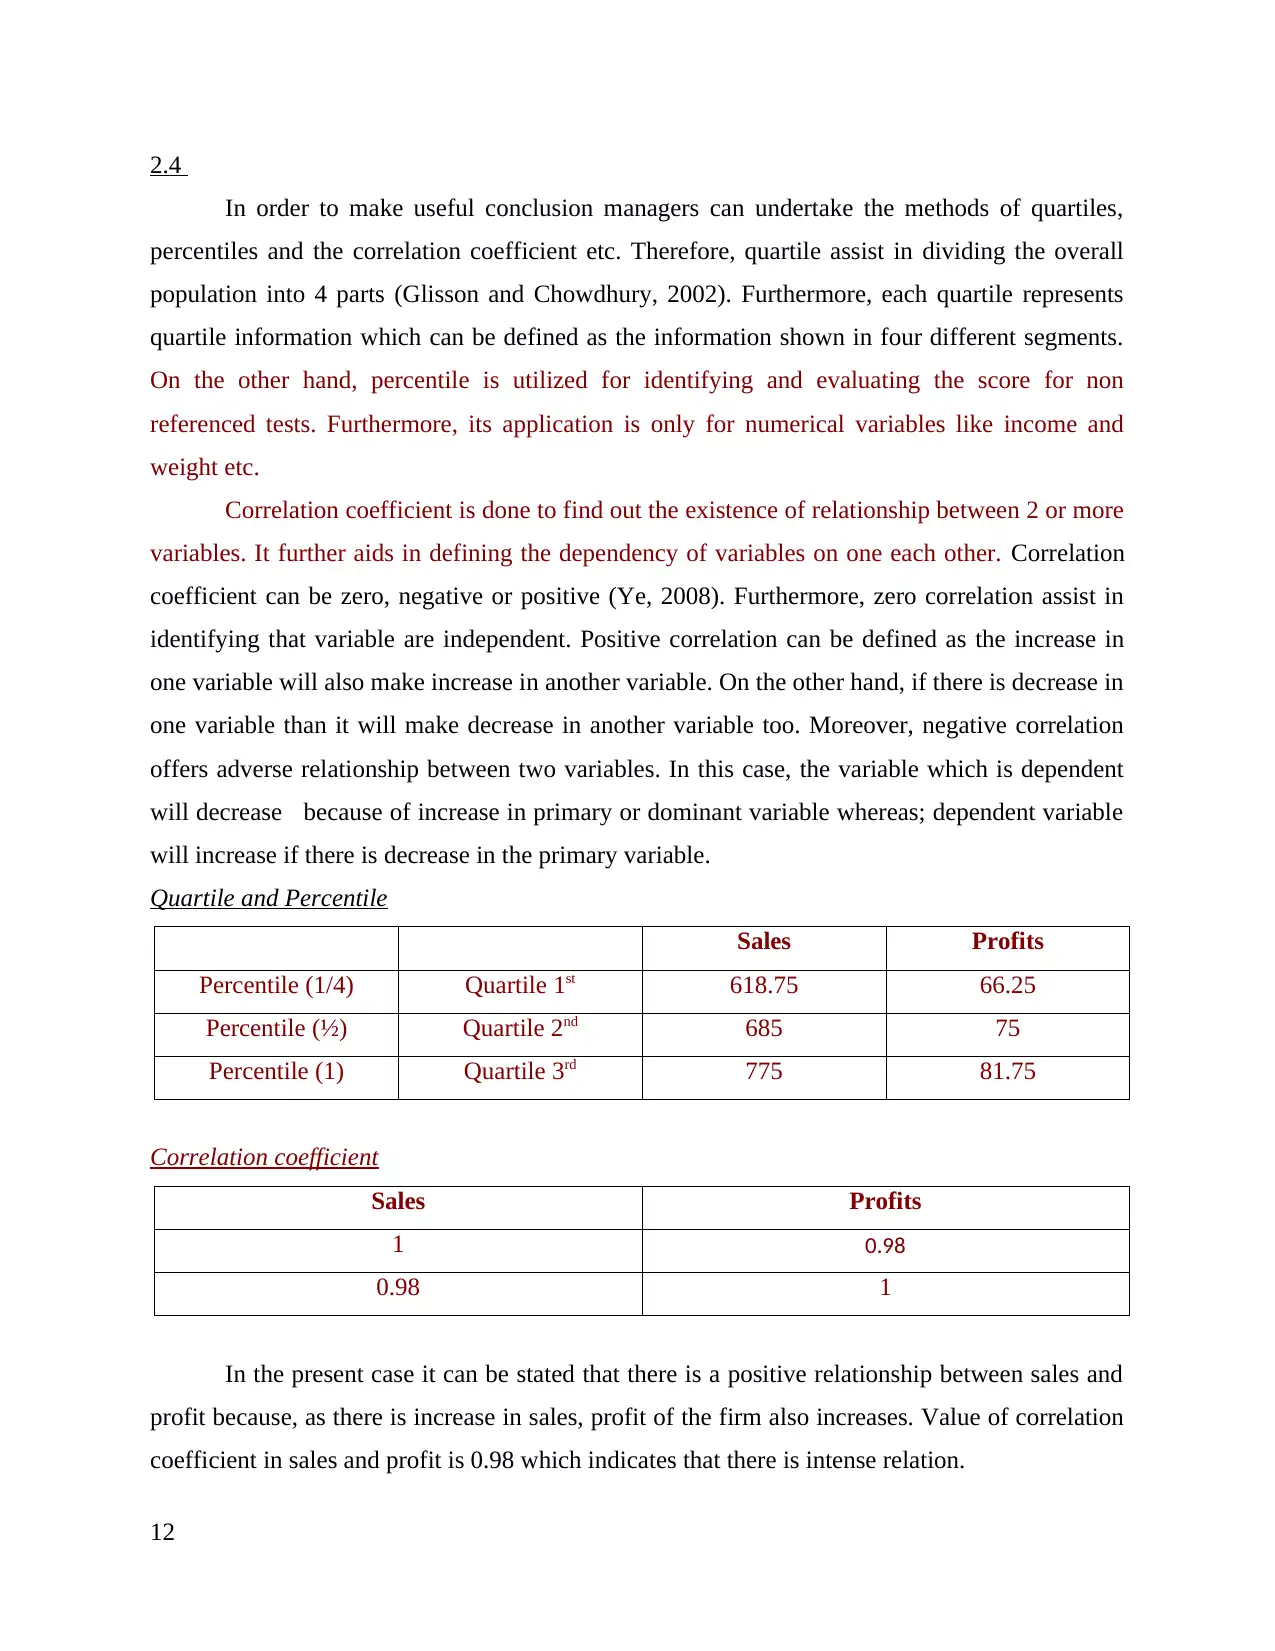
2.4
In order to make useful conclusion managers can undertake the methods of quartiles,
percentiles and the correlation coefficient etc. Therefore, quartile assist in dividing the overall
population into 4 parts (Glisson and Chowdhury, 2002). Furthermore, each quartile represents
quartile information which can be defined as the information shown in four different segments.
On the other hand, percentile is utilized for identifying and evaluating the score for non
referenced tests. Furthermore, its application is only for numerical variables like income and
weight etc.
Correlation coefficient is done to find out the existence of relationship between 2 or more
variables. It further aids in defining the dependency of variables on one each other. Correlation
coefficient can be zero, negative or positive (Ye, 2008). Furthermore, zero correlation assist in
identifying that variable are independent. Positive correlation can be defined as the increase in
one variable will also make increase in another variable. On the other hand, if there is decrease in
one variable than it will make decrease in another variable too. Moreover, negative correlation
offers adverse relationship between two variables. In this case, the variable which is dependent
will decrease because of increase in primary or dominant variable whereas; dependent variable
will increase if there is decrease in the primary variable.
Quartile and Percentile
Sales Profits
Percentile (1/4) Quartile 1st 618.75 66.25
Percentile (½) Quartile 2nd 685 75
Percentile (1) Quartile 3rd 775 81.75
Correlation coefficient
Sales Profits
1 0.98
0.98 1
In the present case it can be stated that there is a positive relationship between sales and
profit because, as there is increase in sales, profit of the firm also increases. Value of correlation
coefficient in sales and profit is 0.98 which indicates that there is intense relation.
12
⊘ This is a preview!⊘
Do you want full access?
Subscribe today to unlock all pages.
Trusted by 1+ million students worldwide
1 out of 24
Related Documents


Your All-in-One AI-Powered Toolkit for Academic Success.
+13062052269
info@desklib.com
Available 24*7 on WhatsApp / Email
![[object Object]](/_next/static/media/star-bottom.7253800d.svg)
Unlock your academic potential
Copyright © 2020–2026 A2Z Services. All Rights Reserved. Developed and managed by ZUCOL.