Analysis of Customer Choices and Restaurant Decision Making for Murano

Verified

Added on  2023/04/10

|13
|543
|228
Report
AI Summary
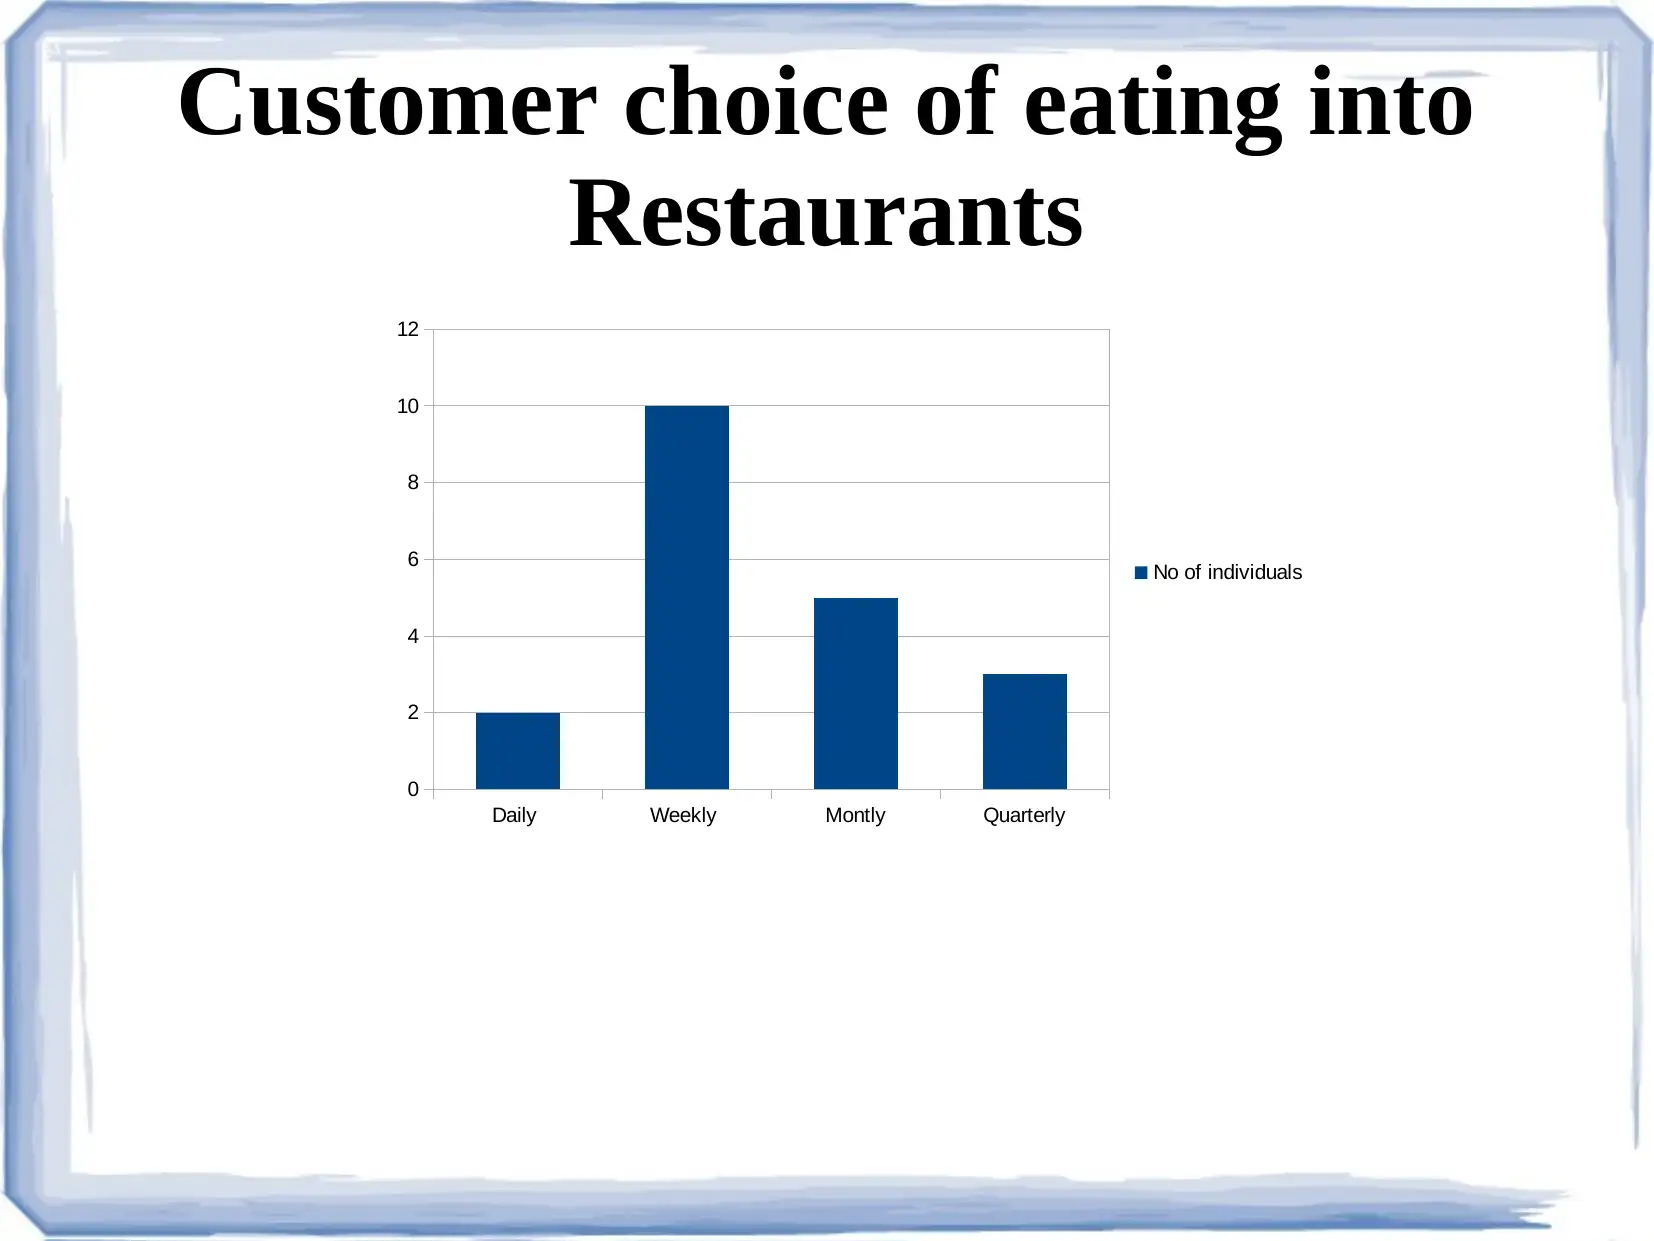
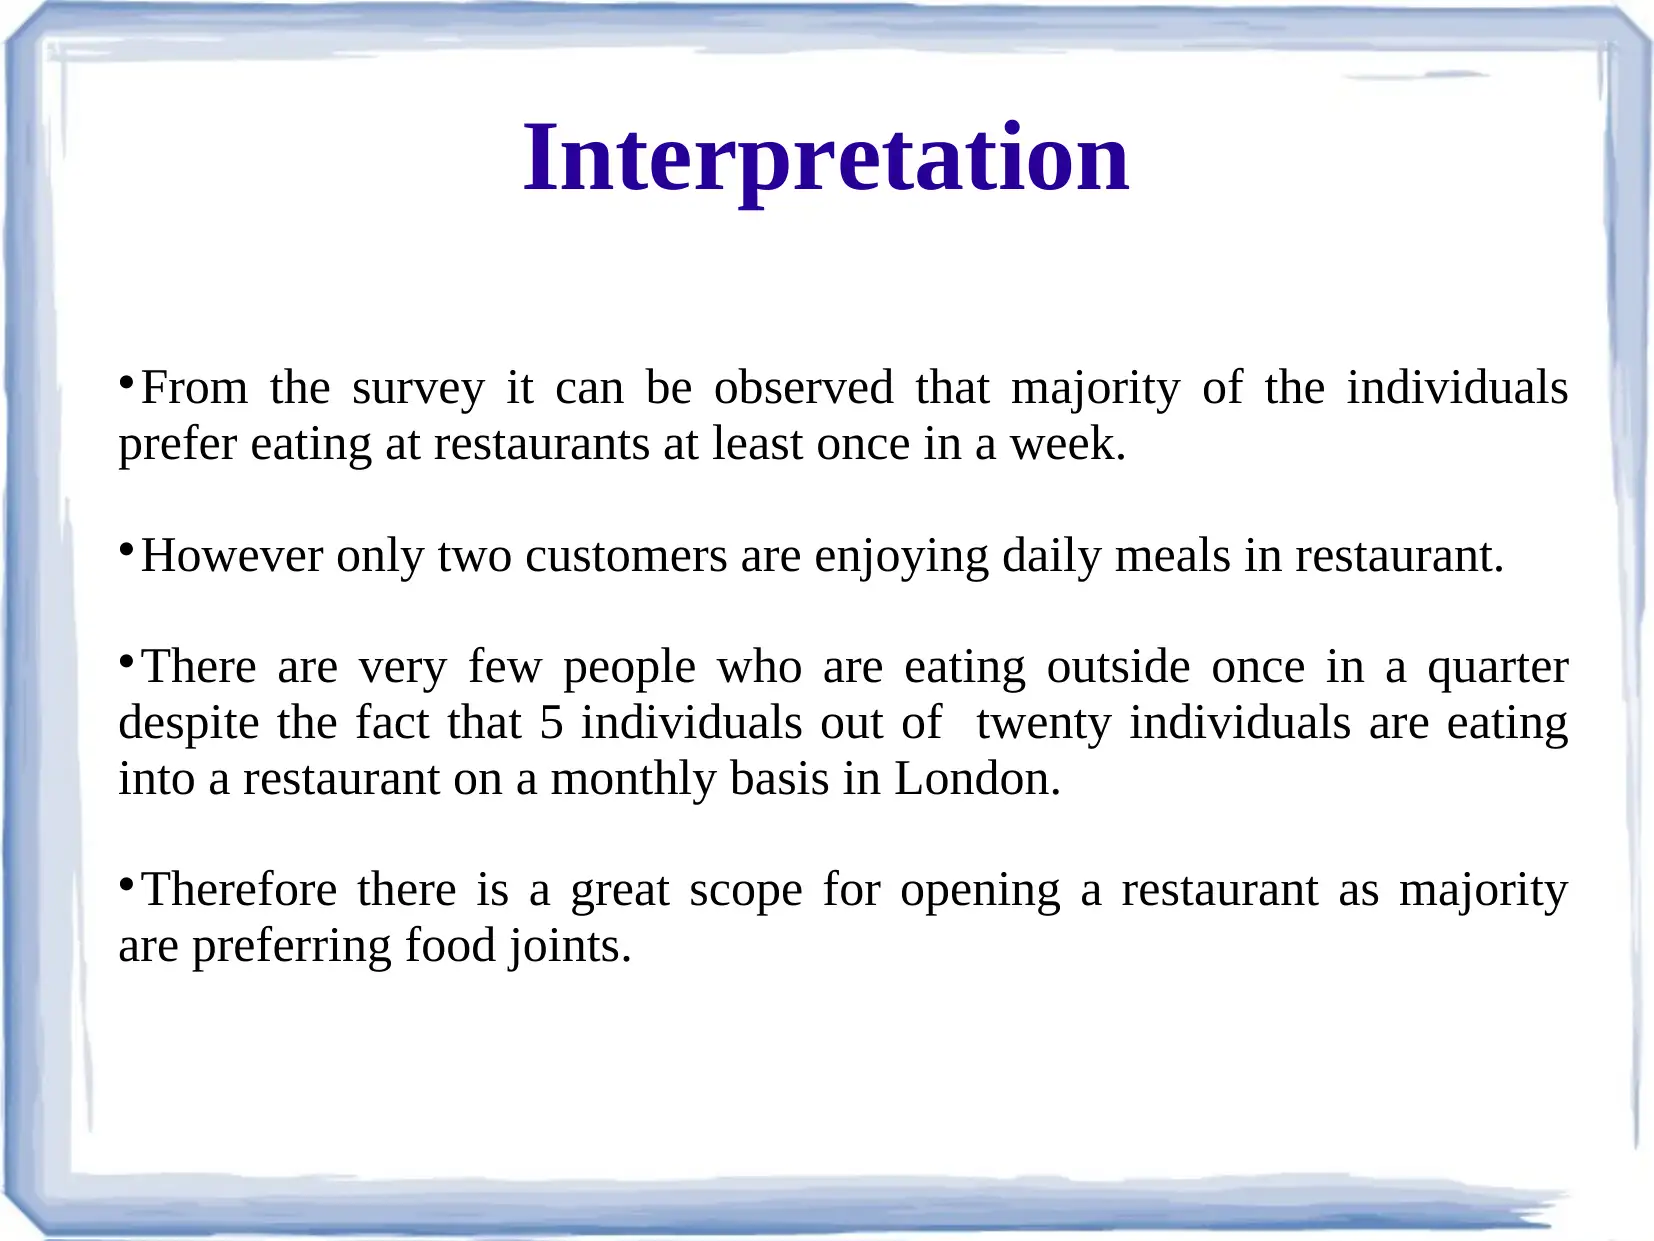
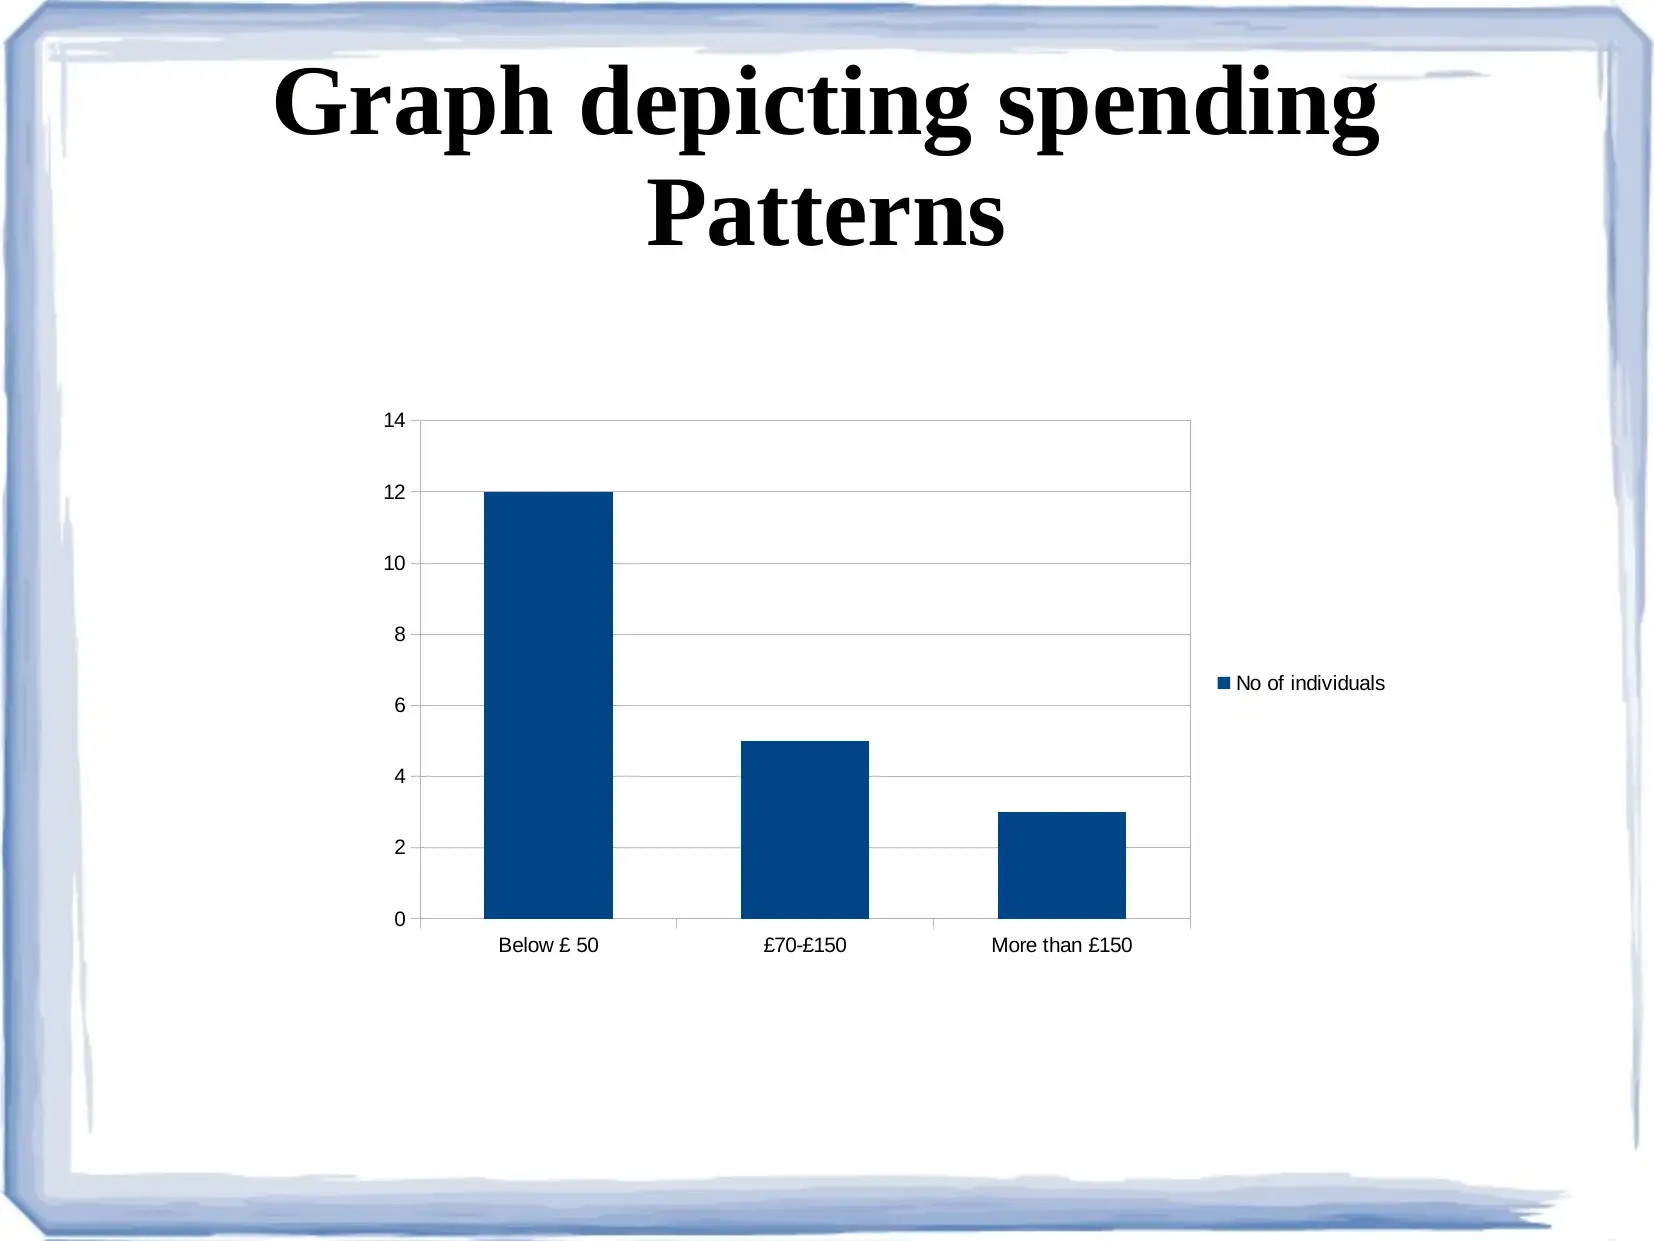
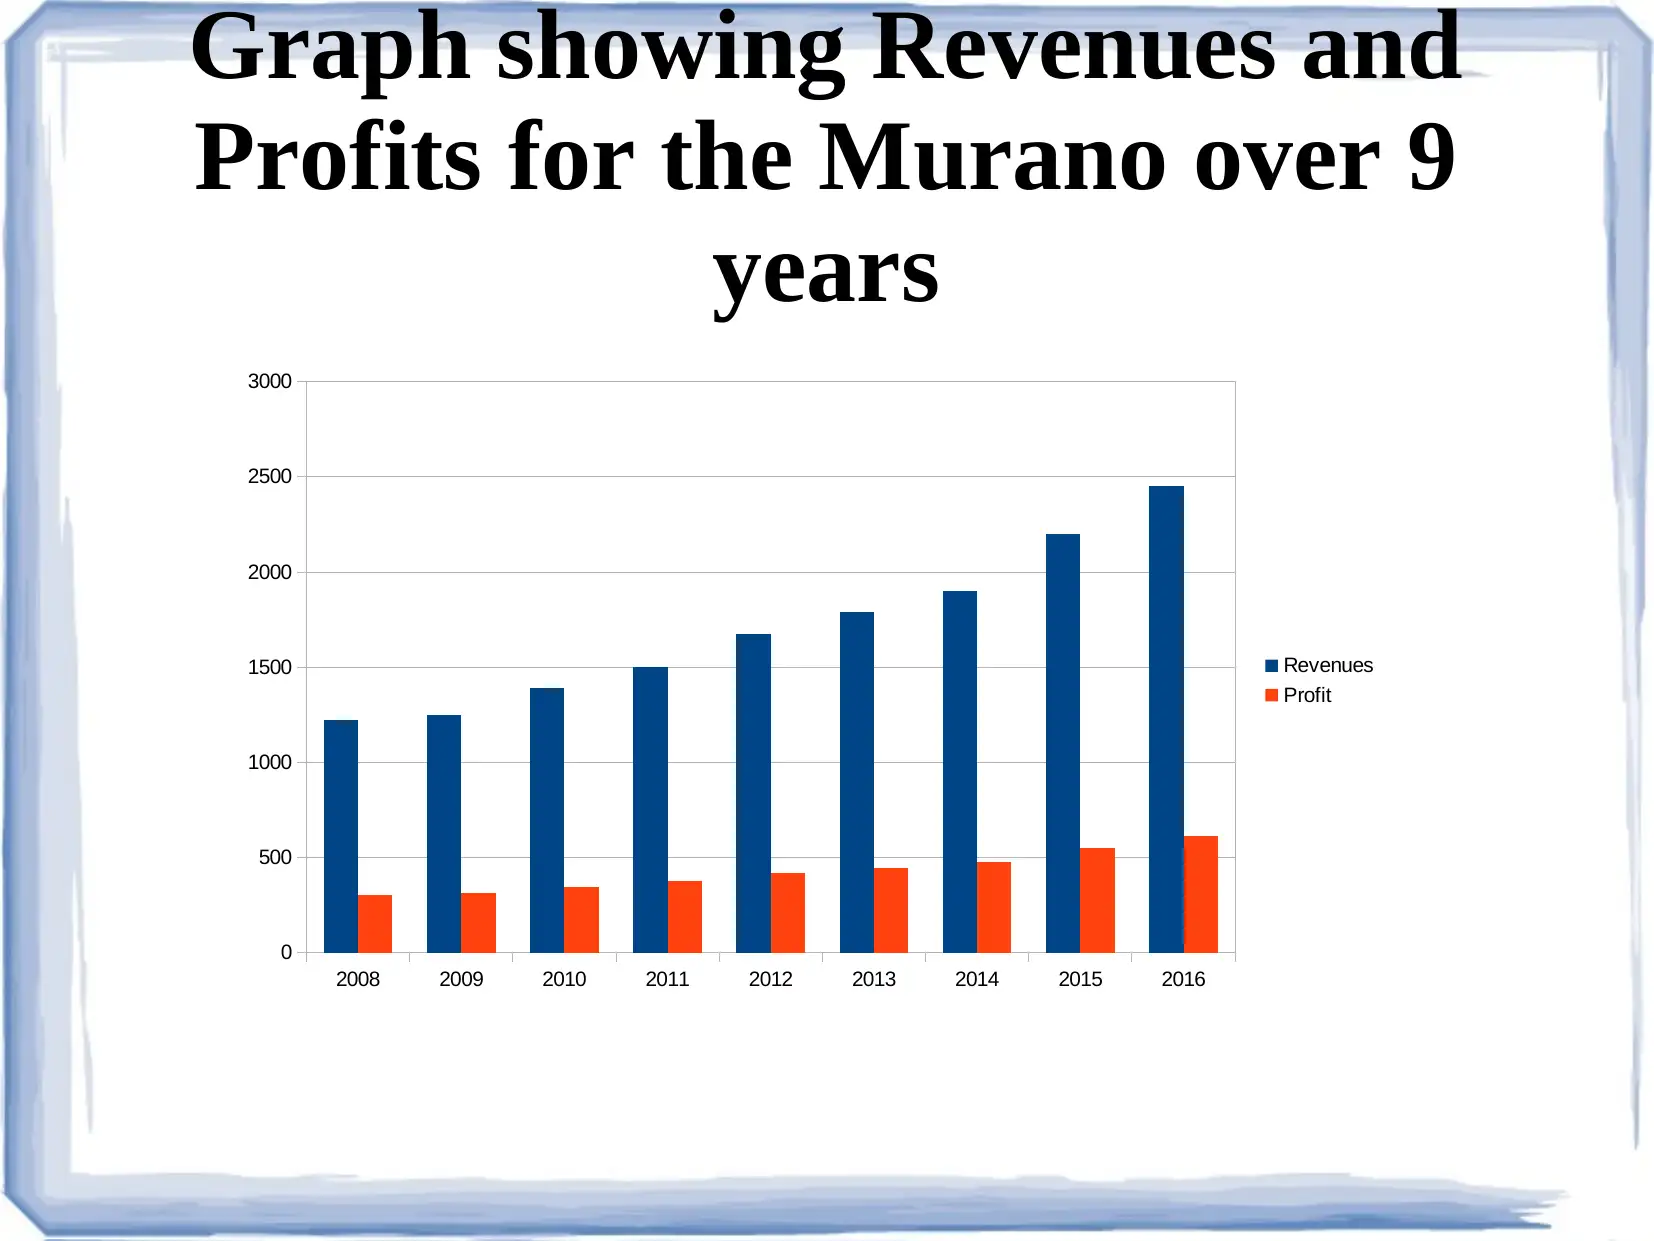
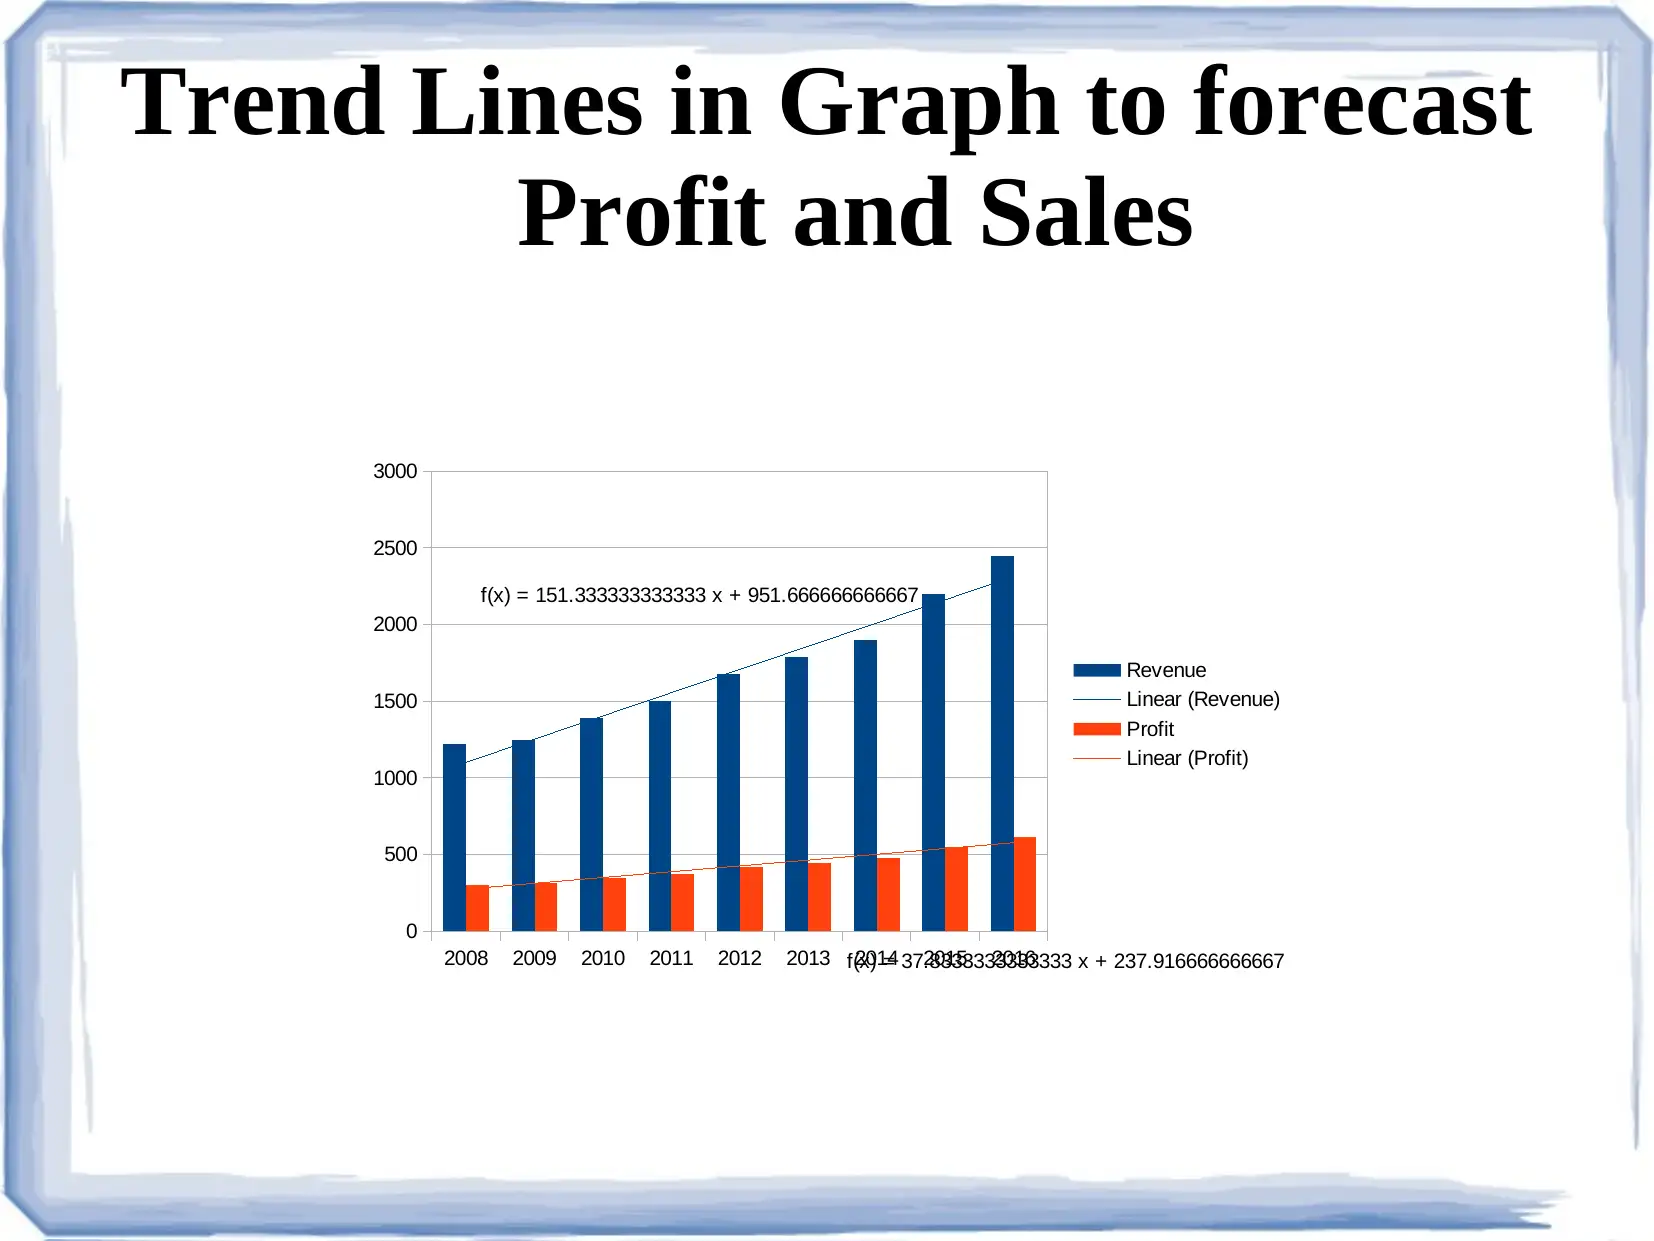
This report analyzes customer choices in restaurants, focusing on factors influencing dining frequency, spending patterns, and price perceptions. The analysis includes survey data interpretation, graphical representations of customer behavior, and financial data analysis of a restaurant chain named Murano. The report examines the relationship between revenue and profit over a nine-year period and uses trend lines to forecast future sales and profits. The findings indicate a positive outlook for restaurant expansion, highlighting the importance of understanding customer preferences and financial performance for informed business decisions. The report concludes with references to relevant academic literature supporting the analysis.
Document Page
Business Decision Making
tabler-icon-diamond-filled.svg

Paraphrase This Document

Need a fresh take? Get an instant paraphrase of this document with our AI Paraphraser
Document Page
Customer choice of eating into
Restaurants
Daily Weekly Montly Quarterly
0
2
4
6
8
10
12
No of individuals
Document Page
Interpretation
From the survey it can be observed that majority of the individuals
prefer eating at restaurants at least once in a week.
However only two customers are enjoying daily meals in restaurant.
There are very few people who are eating outside once in a quarter
despite the fact that 5 individuals out of twenty individuals are eating
into a restaurant on a monthly basis in London.
Therefore there is a great scope for opening a restaurant as majority
are preferring food joints.
Document Page
Graph depicting spending
Patterns
Below £ 50 £70-£150 More than £150
0
2
4
6
8
10
12
14
No of individuals
tabler-icon-diamond-filled.svg

Paraphrase This Document

Need a fresh take? Get an instant paraphrase of this document with our AI Paraphraser
Document Page
Interpretation
From the above table it can be depicted that majority people are
ready to spend below £ 50 on the meals.
However 25% people are happy to spend in the range of £70-£150
despite the fact that only few want to spend more than £150 on the
restaurant expenses per meal.
Document Page
Opinion about prices charged by
Murano
Expensive Reasonable Cheap
0
2
4
6
8
10
12
14
16
No of customers
Document Page
Interpretation
It cab be concluded from above table and graph that 15 customers
ranked the prices charged as reasonable which is a positive sign for
Murano.
Therefore same or slightly changed prices should be adopted by
Murano for new restaurant.
tabler-icon-diamond-filled.svg

Paraphrase This Document

Need a fresh take? Get an instant paraphrase of this document with our AI Paraphraser
Document Page
Graph showing Revenues and
Profits for the Murano over 9
years
2008 2009 2010 2011 2012 2013 2014 2015 2016
0
500
1000
1500
2000
2500
3000
Revenues
Profit
Document Page
Interpretation
From the above graph it can be easily identified that revenues and
profits are growing continuously over the years.
Further profits are also increasing wit the revenue increasing. This is
a positive indication towards the customer relationship and people's
preference to restaurants.
This widens the scope for opening a new restaurant to achieve
overall organisational profits.
Document Page
Trend Lines in Graph to forecast
Profit and Sales
2008 2009 2010 2011 2012 2013 2014 2015 2016
0
500
1000
1500
2000
2500
3000
f(x) = 151.333333333333 x + 951.666666666667
f(x) = 37.8333333333333 x + 237.916666666667
Revenue
Linear (Revenue)
Profit
Linear (Profit)
tabler-icon-diamond-filled.svg

Paraphrase This Document

Need a fresh take? Get an instant paraphrase of this document with our AI Paraphraser
Document Page
Interpretation
Trend analysis is an effective tool to represent the trend from past
period and assists in future forecasting of the Sales and profits of the
company.
Based on trend analysis it can be clearly identified that sales will
continuously rise in the future period in combination with profits.
Although profits does not rise in same proportion as that of profits.
Document Page
REFERENCES
Ashraf, M. and Khan, K.M., 2016. Adolescents’ Role in Family Decision
Making for Services in India. Young Consumers. 17(4).
Baum, A.E. and Crosby, N., 2014. Property investment appraisal. John
Wiley & Sons.
Britain, G., Forestry Commission, Economics, H.Q. and Unit, S., 2013.
Forestry Statistics 2013: A Compendium of Statistics about Woodland,
Forestry and Primary Wood Processing in the United Kingdom.
Economics and Statistics, Forestry Commission.
Cleland, A. and Revenue, I., 2013, June. Shedding Light Into the Black
Hole: Research and Evaluation Into the Hidden Economy. In Tax
Administration at the Centennial: An IRS-TPC Research Conference.p.
171.
chevron_up_icon
1 out of 13
circle_padding
hide_on_mobile
zoom_out_icon
[object Object]