Business Decision Making Report: Restaurant Analysis and Findings

Verified

Added on  2023/03/23

|9
|313
|316
Report
AI Summary
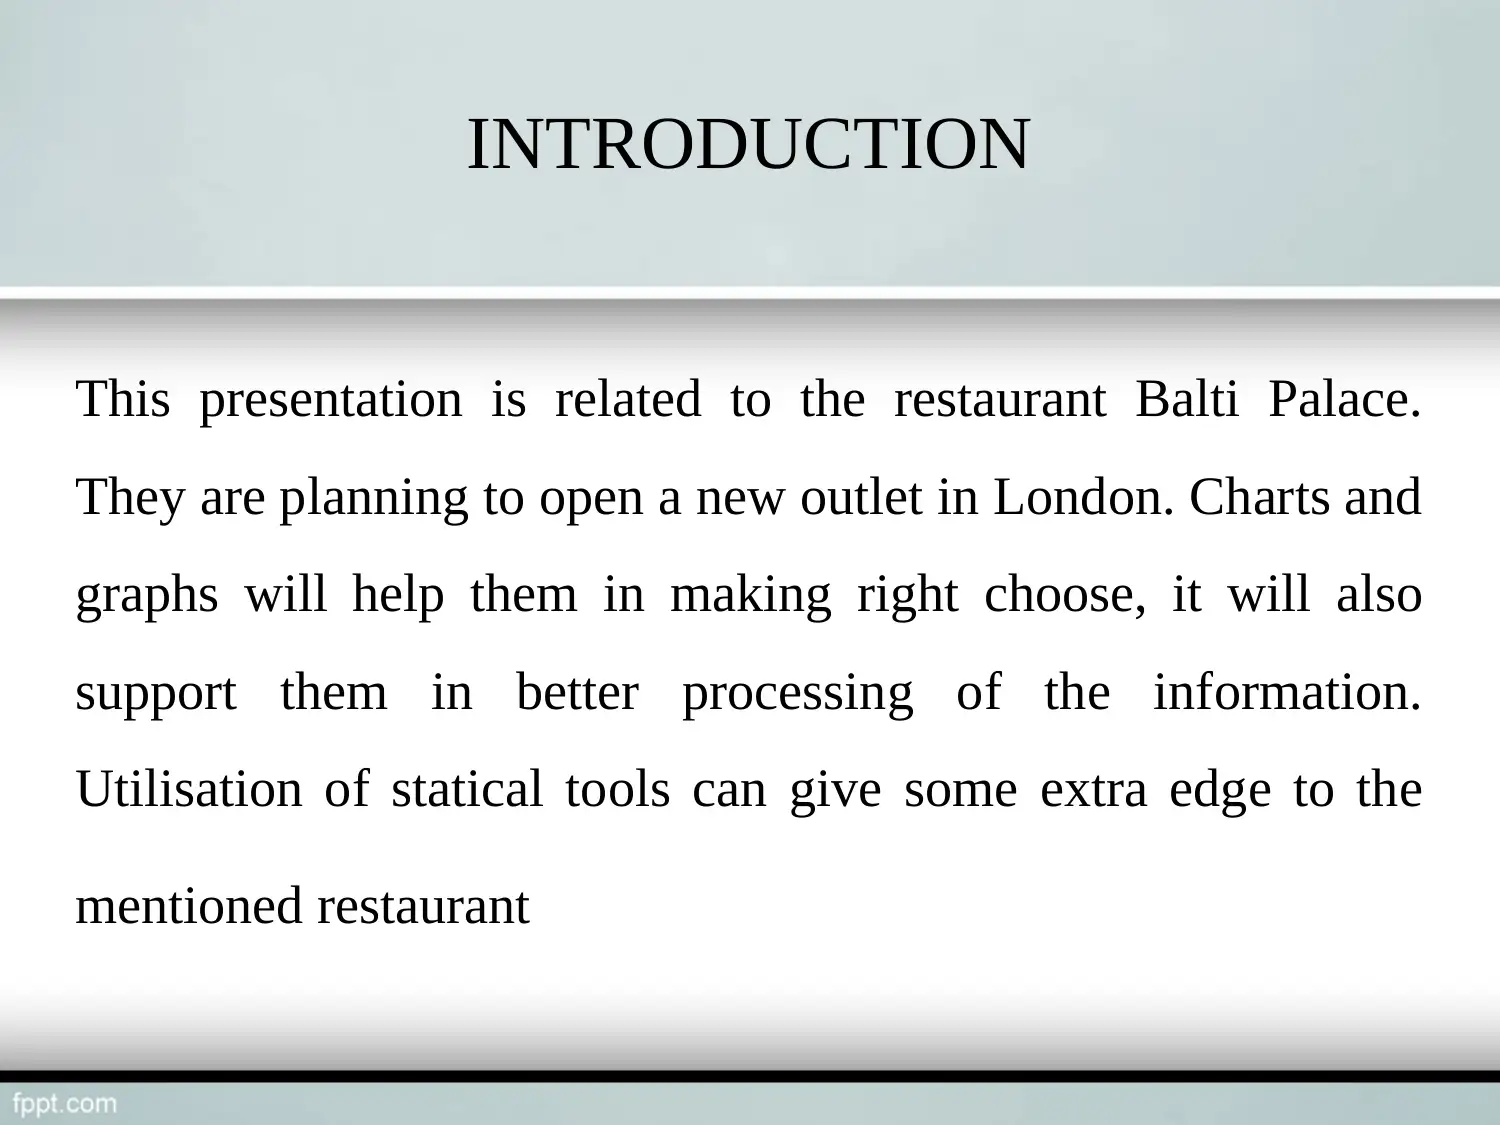
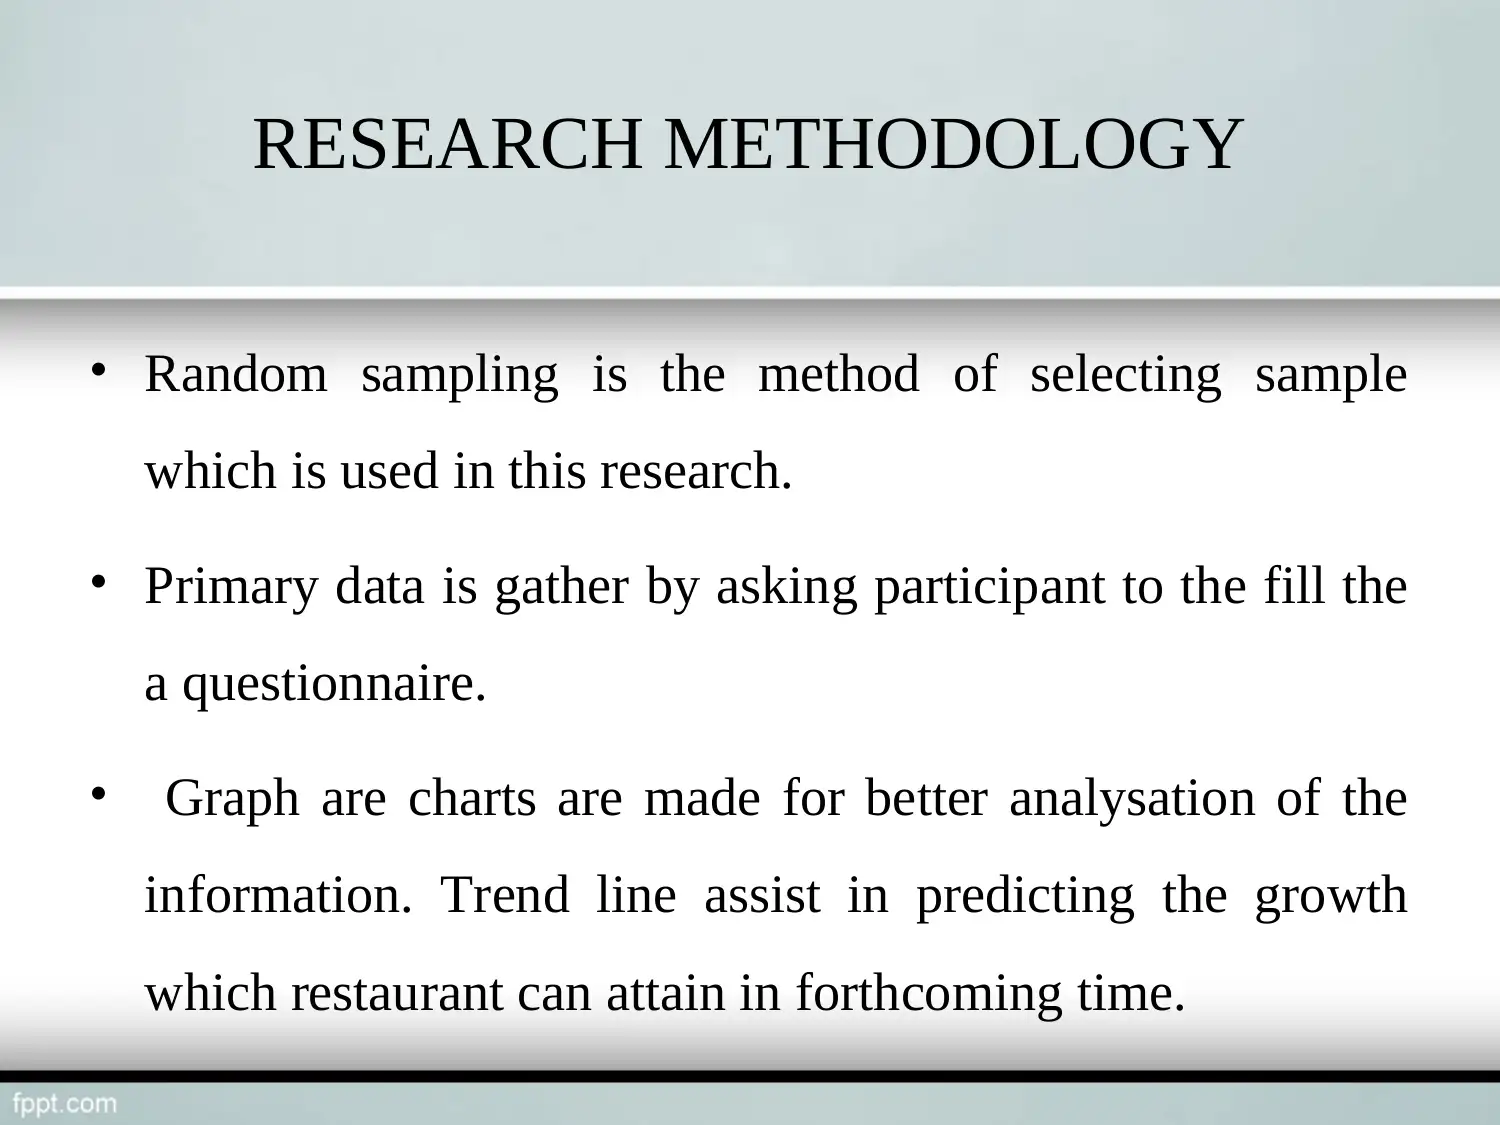
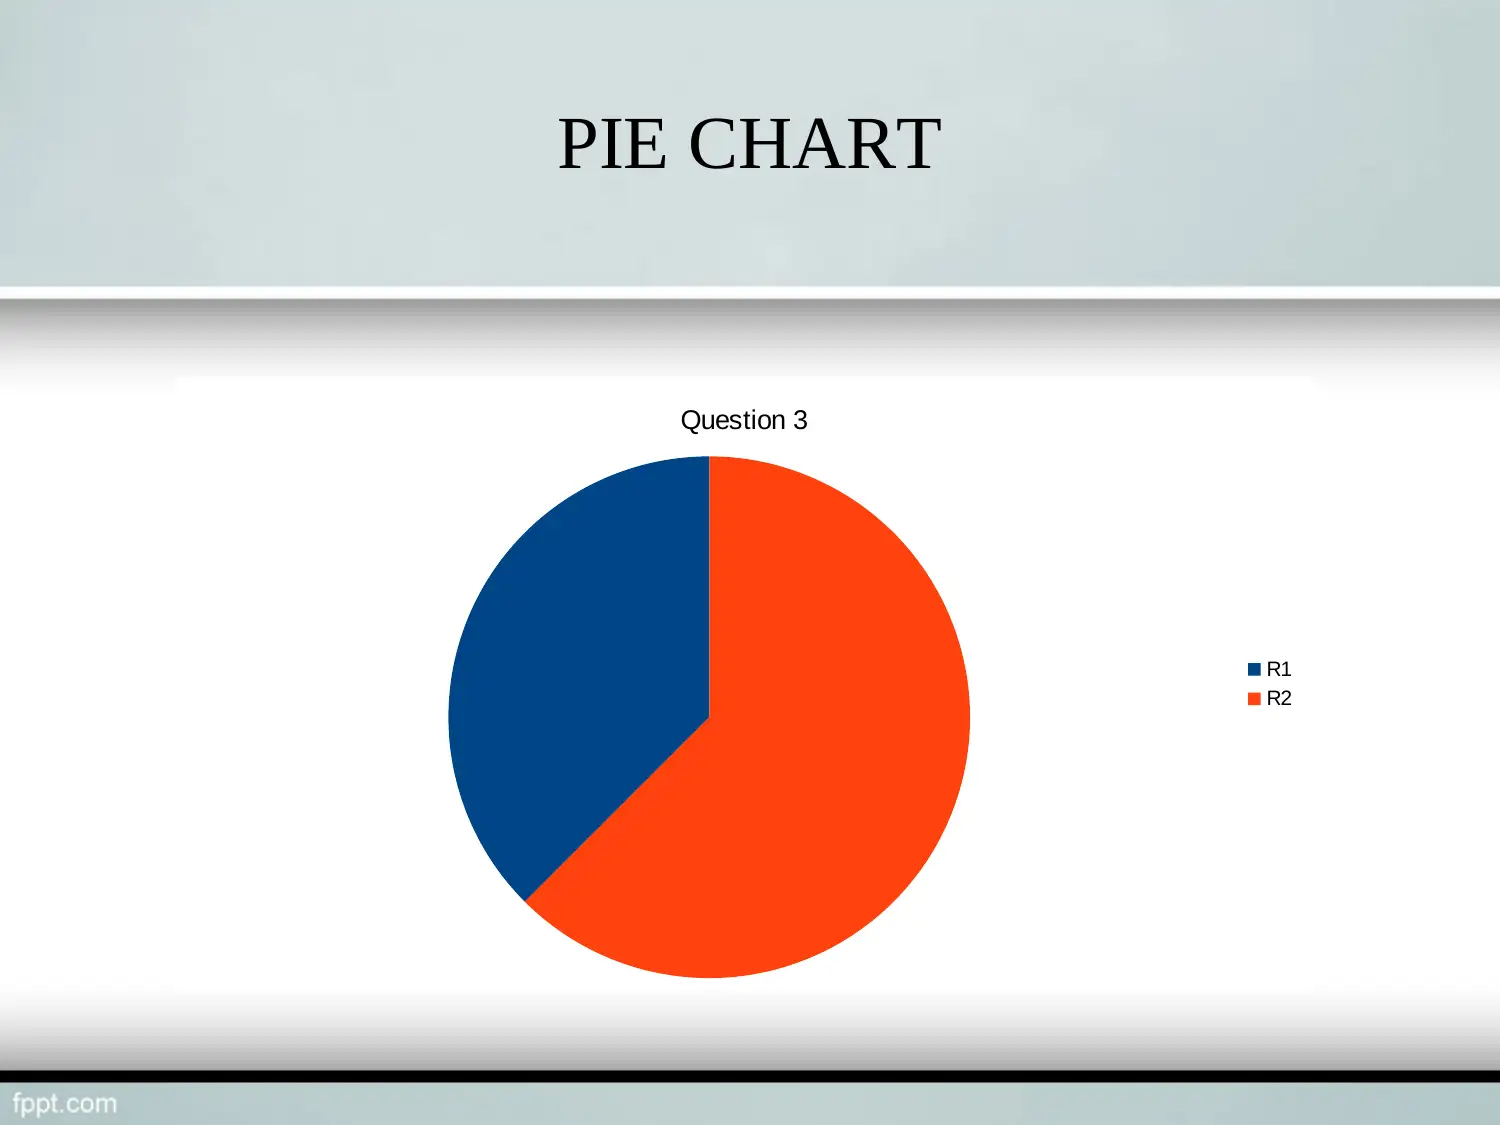
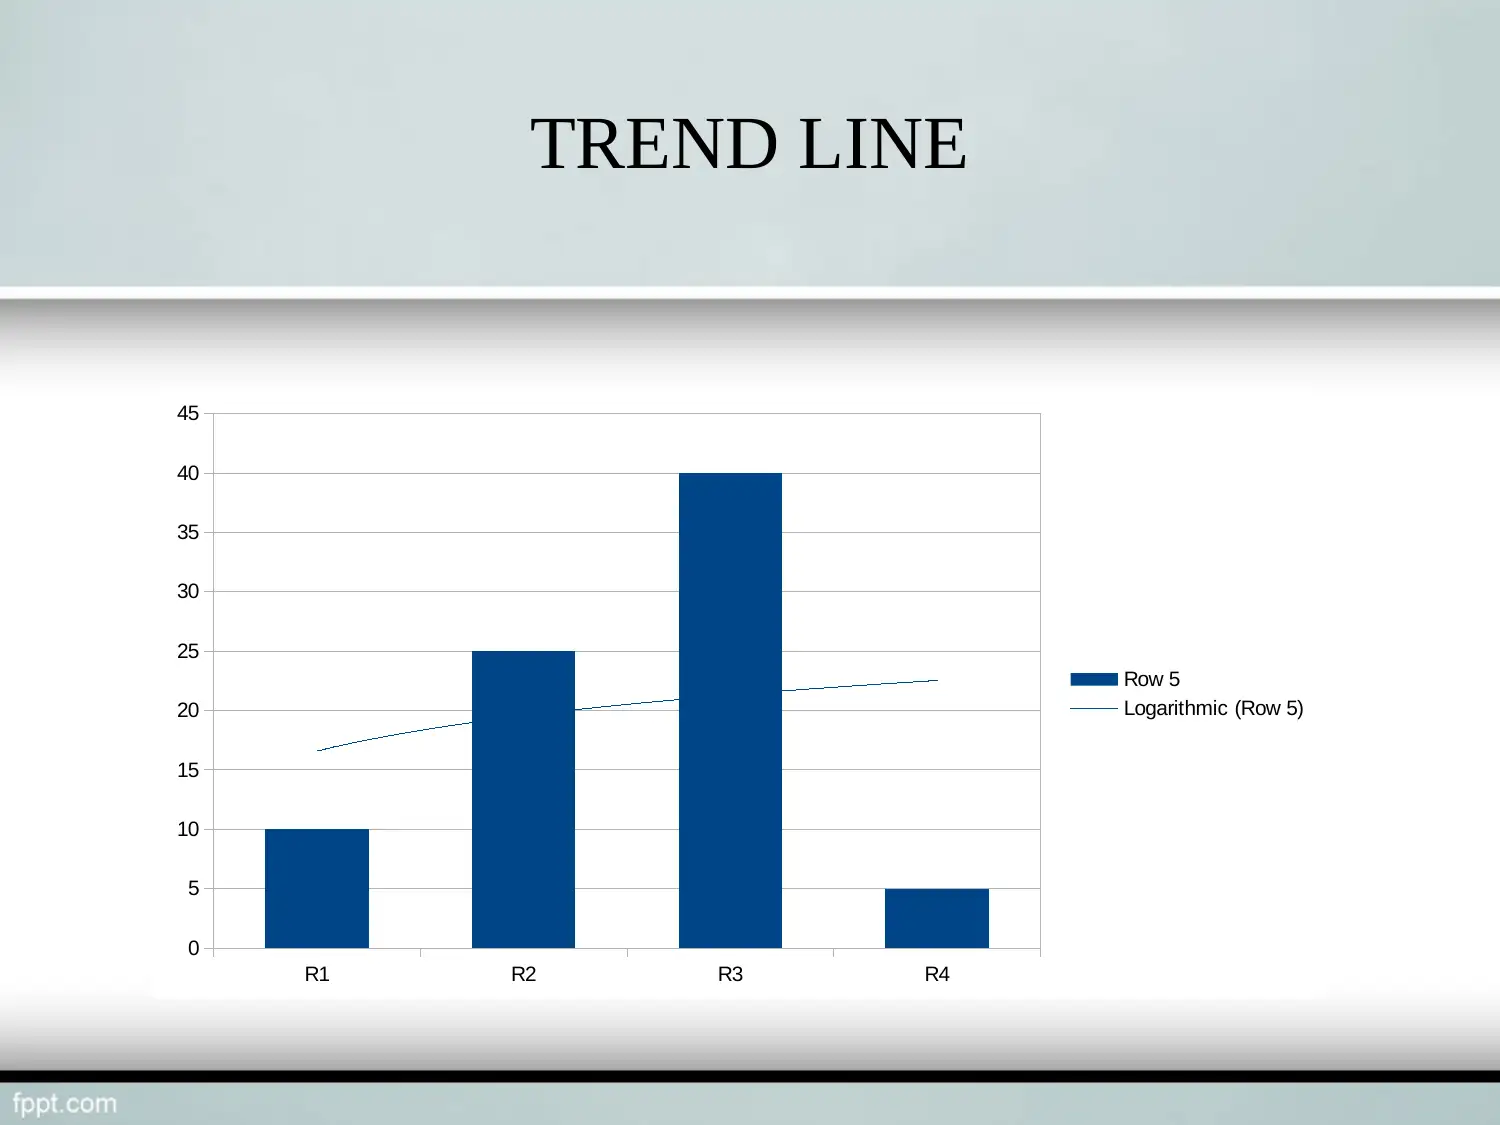
This report focuses on business decision-making for a restaurant, specifically addressing the use of data analysis and statistical tools. The assignment includes an introduction, outlining the objectives and the context of the analysis, and the methodology section explains the approach to data collection, including the use of primary data through questionnaires and the application of random sampling. The report then presents the analysis of data, incorporating a pie chart and a trend line to visualize key findings. The results section summarizes key observations such as customer satisfaction and transport preferences. Finally, the report concludes by listing the references used in the analysis, demonstrating a structured approach to business problem-solving. This report will help businesses in making informed decisions.
Document Page
Business decision making
Task 3.3
tabler-icon-diamond-filled.svg

Paraphrase This Document

Need a fresh take? Get an instant paraphrase of this document with our AI Paraphraser
Document Page
COVER CONTENT
Introduction
Research Methodology
Trend line
Pie Chart
Findings
References
Document Page
INTRODUCTION
This presentation is related to the restaurant Balti Palace.
They are planning to open a new outlet in London. Charts and
graphs will help them in making right choose, it will also
support them in better processing of the information.
Utilisation of statical tools can give some extra edge to the
mentioned restaurant
Document Page
RESEARCH METHODOLOGY
Random sampling is the method of selecting sample
which is used in this research.
Primary data is gather by asking participant to the fill the
a questionnaire.
Graph are charts are made for better analysation of the
information. Trend line assist in predicting the growth
which restaurant can attain in forthcoming time.
tabler-icon-diamond-filled.svg

Paraphrase This Document

Need a fresh take? Get an instant paraphrase of this document with our AI Paraphraser
Document Page
PIE CHART
Question 3
R1
R2
Document Page
TREND LINE
R1 R2 R3 R4
0
5
10
15
20
25
30
35
40
45
Row 5
Logarithmic (Row 5)
Document Page
FINDINGS
Most of the customer are satisfied with the food quality,
this restaurant faced some problems in starting but
gradually they came of track.
Their trend line shows that personal transport is being
more preferred by people.
Some customers were not happy with services of the
restaurant .
tabler-icon-diamond-filled.svg

Paraphrase This Document

Need a fresh take? Get an instant paraphrase of this document with our AI Paraphraser
Document Page
REFERECNES
Vercellis, C., 2011. Business intelligence: data mining and optimization for
decision making. John Wiley & Sons.
Laudon, K.C. and Laudon, J.P., 2015. Management Information Systems:
Managing the Digital Firm Plus MyMISLab with Pearson eText--Access
Card Package. Prentice Hall Press.
Maxwell, A.L., Jeffrey, S.A. and Lévesque, M., 2011. Business angel early
stage decision making. Journal of Business Venturing. 26(2). pp.212-
225.
Document Page
THANK- YOU
chevron_up_icon
1 out of 9
circle_padding
hide_on_mobile
zoom_out_icon
[object Object]