Analyzing Data for Restaurant Expansion and Financial Forecasting
VerifiedAdded on 2020/06/04
|21
|3884
|241
AI Summary
The assignment presents an analysis and forecasting approach for the potential expansion of a restaurant in central London, focusing on the use of various data sources. The process begins with the creation of a plan to collect primary and secondary data addressing specific business challenges. A survey methodology is outlined along with a designed questionnaire that meets these objectives. Further, statistical techniques are applied to analyze the gathered information effectively, allowing for informed decision-making within the business context. Data summarization utilizes representative values while dispersion measures help understand variability in consumer preferences related to the restaurant's proposed expansion. The analysis extends to financial tools such as Net Present Value (NPV) and Internal Rate of Return (IRR), providing a comprehensive forecast over three years. Software processing systems are highlighted for their role in assisting managers with decision-making, underscoring the value of technology in strategic planning. In conclusion, the report encapsulates how primary research underpins data-driven decisions, offering insights into profit forecasting and sales trends essential for successful business growth.

Business decision making
Paraphrase This Document
Need a fresh take? Get an instant paraphrase of this document with our AI Paraphraser
Contents
INTRODUCTION...........................................................................................................................1
1.1 Produce a plan:.................................................................................................................1
1.2 Survey methodology:........................................................................................................2
1.3Questionnaire:....................................................................................................................3
TASK 2............................................................................................................................................5
2.1 Interpretation of the data collected:..................................................................................5
2.2 Analyse the results:...........................................................................................................5
2.3 Analyse of measure of dispersion:...................................................................................7
2.4 Advantages of applying quartile, percentile and co-efficient correlation:.......................7
TASK 3............................................................................................................................................8
3.1 Produce graphs:................................................................................................................8
3.2 Trendline:.......................................................................................................................14
3.3 Covered in PPT...............................................................................................................14
3.4 Formal report:.................................................................................................................14
TASK 4..........................................................................................................................................15
4.1Information processing tools:..........................................................................................15
4.2 Project plan:....................................................................................................................16
4.3 Financial tools for decisions:..........................................................................................17
CONCLUSION..............................................................................................................................18
REFERENCES..............................................................................................................................19
INTRODUCTION
Decision is the major part in any business due to this involve high thinking during making
decisions. Although, this could be emerged that the manager and financial analyst make
decisions after having extensive research about the topic. In this study, primary research has been
made for providing business objectives (Bayne and Woolcock, 2011). This report is made on the
Balti palace restaurant which ultimately organising research in order to enlarge their business
somewhere in London. Although, this is one of the main reason that could help out to give
certain business objectives.
1.1 Produce a plan:
Various business decisions are made out in order to provide effective strategy for the firm.
This is the reason; they are required to provide certain things in order to make effective
decisions. Although, before going to make research, there is a strong requirement to form plan
for gathering data in an effective manner (Schmoldt and et. al., 2013). Although, various plans
are used in order to be done. There are basically two methods which are used in order to gather
the data effectively. First is primary research method and the other one is the secondary
technique.
Primary research method: This is the method which is used for first time. This is one of
the best methods that can be applied by the firm in order to collect the data. This can be used by
majority of the researcher so that the data can be used for making the business decisions in an
effective manner. This is convened at the time of making the business operations effectively. The
primary business operations can be done with the help of this research tool.
Benefits:
The main benefits of the primary research method is to make certain decisions
which will help out to make an effective business strategy.
This will give out to most effective tools that could help out to render the business
objectives effectively. The information gathered by using this tool is mostly related
to the researcher information which he needs the most.
This research method is used when the data requirement is most specific.
Drawbacks:
1
⊘ This is a preview!⊘
Do you want full access?
Subscribe today to unlock all pages.
Trusted by 1+ million students worldwide
The main drawback of the primary research method is that this takes so much time to
gather the data. That is why, this is known as the time consuming activity.
This research requires so much amount for convening it and that is the reason, this is not
practically possible.
One of the main drawback is that this totally relied upon the mood of the respondents
which will sometimes not provide the correct information.
Secondary research method: This is another tool for gathering the data. But, under this, the
data gathered by using this technique is already published (Hwang and Masud, 2012). That is the
main reason, this is easy to convene the research by using this research method. This is easy to
gather data that will help out to provide effective strategy. The business objectives can be done
after doing research by using this tool effectively. There are various modes through which the
research as per the secondary method can be done. Some of them are: statistical department,
newspaper, and any other article or data which have been published already published.
Benefits:
The main benefits for gathering data by using this tool is that this is easy to make
information by using this research data.
This is not the time consuming activity. As this takes less time instead of doing research
via primary research.
1.2 Survey methodology:
Survey methodologies are the tools or method by which data from the intended market
place can be gathered. Though, there are various tools but some of them are the best tool which
could be implemented by the researcher. This kind of procedure is implemented by the
researcher for collecting data and reflects the market position. This can be said that the company
made effective strategy for gathering the data effectively (Solomon, 2014). Through this, the
business decisions are made. There are so many ways that can be used effectively for gathering
data. These are: questionnaire, sampling and others. These are defined in detail as below:
Interviews: This is one of the best tools that are used by the researcher for gathering data
face to face from the respondents in order to make certain decisions. However, this could be
observed that this it is a time consuming activity as this takes huge time for making the business
decisions. There is a need to form specific path for gathering data through which survey can be
convened and the data can be collected for making the research complete.
2
Paraphrase This Document
Need a fresh take? Get an instant paraphrase of this document with our AI Paraphraser
Questionnaire: In this tool, it could be observed that the researcher includes so many
questions which would help out to make certain conclusion regarding the intended information.
Although, respondents were providing certain options for making final conclusion (Yager and
Kacprzyk, 2012).
Sampling method: This is the tool under which sampling method can be varying and these
are applied as per the researcher desire. However, this can be said that the business decisions can
be made by using this technique. As, this take less time for gathering the data. The random
sampling method is one of the best effective tool.
In the given scenario, this can be said that there is a strong need to form business decisions.
These decisions are relying upon gathering the data via random sampling method. However, this
can be said that the cited restaurant requires considering crucial strategy by implementing these
survey methodologies.
1.3Questionnaire:
The questionnaire is made out after covering various questions which are related to the
expansion and related to the business quality. So that the business can be made in order to
provides effective strategy (Tzeng and Huang, 2011). So that the business can be done
effectively. Under this, 40 respondents were considered in order to make decisions. The random
sampling method is used by the firm for getting the business decision in an effective manner.
Questionnaire
Name:
Age:
Q.1 In which age class, you fall?
a). 20-30
b). 30-40
c). 40-45
d). 45 and above
Q.2 Did you visit our cited restaurant?
a) Yes
b). No
Q.3 What is the most important thing in the quoted restaurant?
3
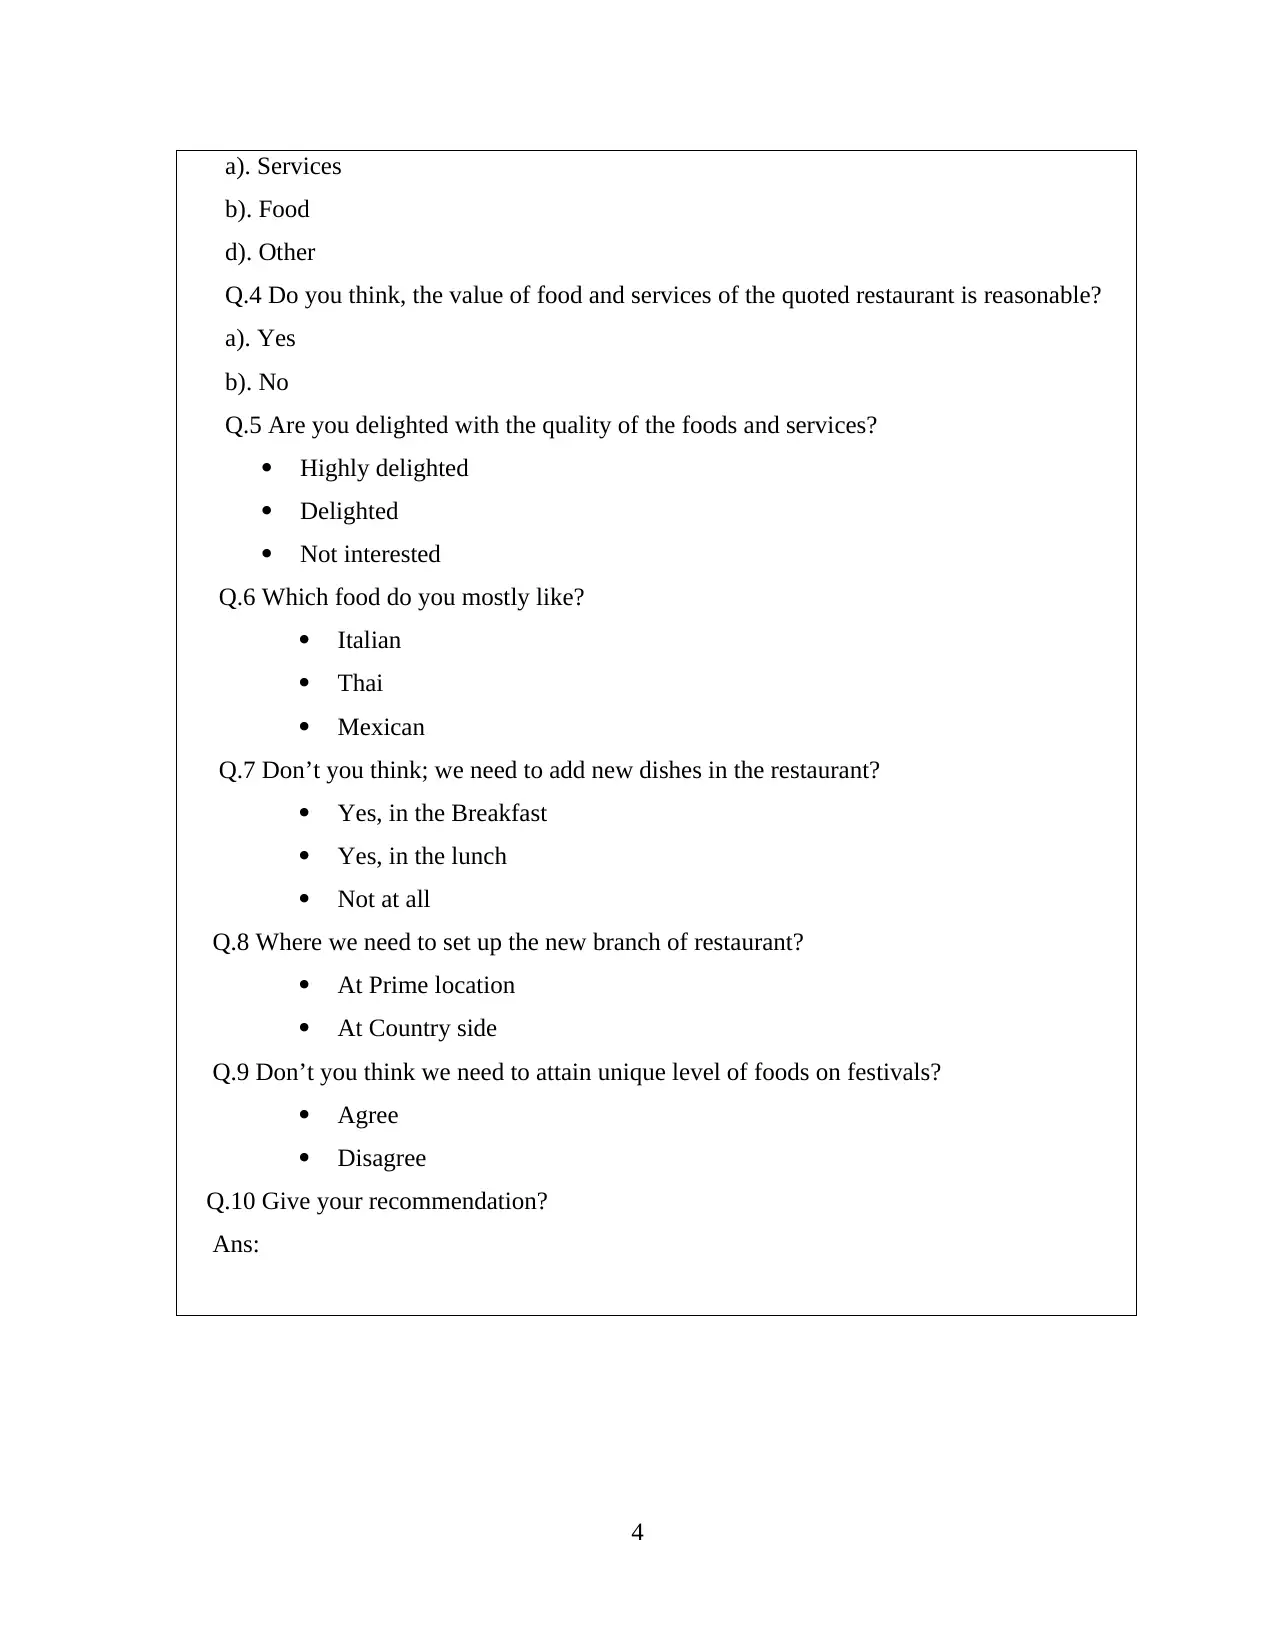
a). Services
b). Food
d). Other
Q.4 Do you think, the value of food and services of the quoted restaurant is reasonable?
a). Yes
b). No
Q.5 Are you delighted with the quality of the foods and services?
Highly delighted
Delighted
Not interested
Q.6 Which food do you mostly like?
Italian
Thai
Mexican
Q.7 Don’t you think; we need to add new dishes in the restaurant?
Yes, in the Breakfast
Yes, in the lunch
Not at all
Q.8 Where we need to set up the new branch of restaurant?
At Prime location
At Country side
Q.9 Don’t you think we need to attain unique level of foods on festivals?
Agree
Disagree
Q.10 Give your recommendation?
Ans:
4
⊘ This is a preview!⊘
Do you want full access?
Subscribe today to unlock all pages.
Trusted by 1+ million students worldwide
TASK 2
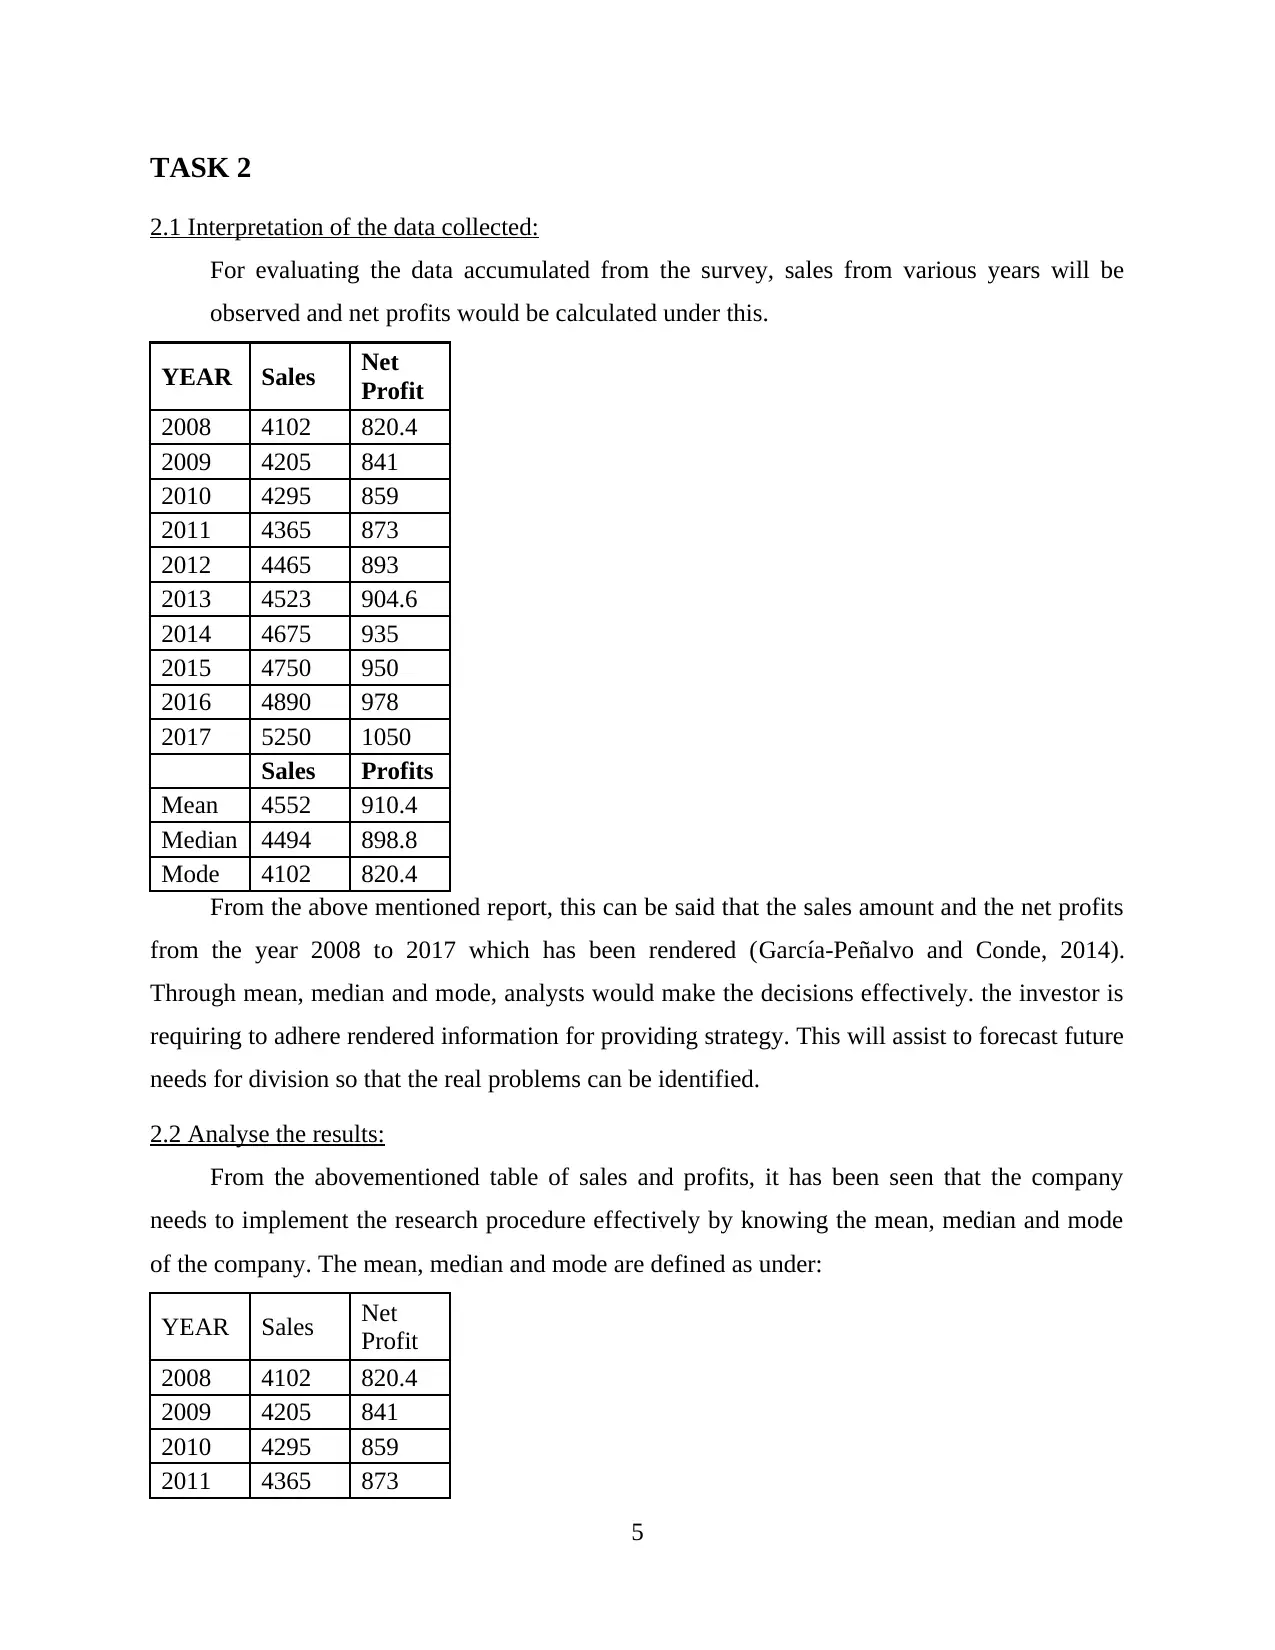
2.1 Interpretation of the data collected:
For evaluating the data accumulated from the survey, sales from various years will be
observed and net profits would be calculated under this.
YEAR Sales Net
Profit
2008 4102 820.4
2009 4205 841
2010 4295 859
2011 4365 873
2012 4465 893
2013 4523 904.6
2014 4675 935
2015 4750 950
2016 4890 978
2017 5250 1050
Sales Profits
Mean 4552 910.4
Median 4494 898.8
Mode 4102 820.4
From the above mentioned report, this can be said that the sales amount and the net profits
from the year 2008 to 2017 which has been rendered (García-Peñalvo and Conde, 2014).
Through mean, median and mode, analysts would make the decisions effectively. the investor is
requiring to adhere rendered information for providing strategy. This will assist to forecast future
needs for division so that the real problems can be identified.
2.2 Analyse the results:
From the abovementioned table of sales and profits, it has been seen that the company
needs to implement the research procedure effectively by knowing the mean, median and mode
of the company. The mean, median and mode are defined as under:
YEAR Sales Net
Profit
2008 4102 820.4
2009 4205 841
2010 4295 859
2011 4365 873
5
Paraphrase This Document
Need a fresh take? Get an instant paraphrase of this document with our AI Paraphraser
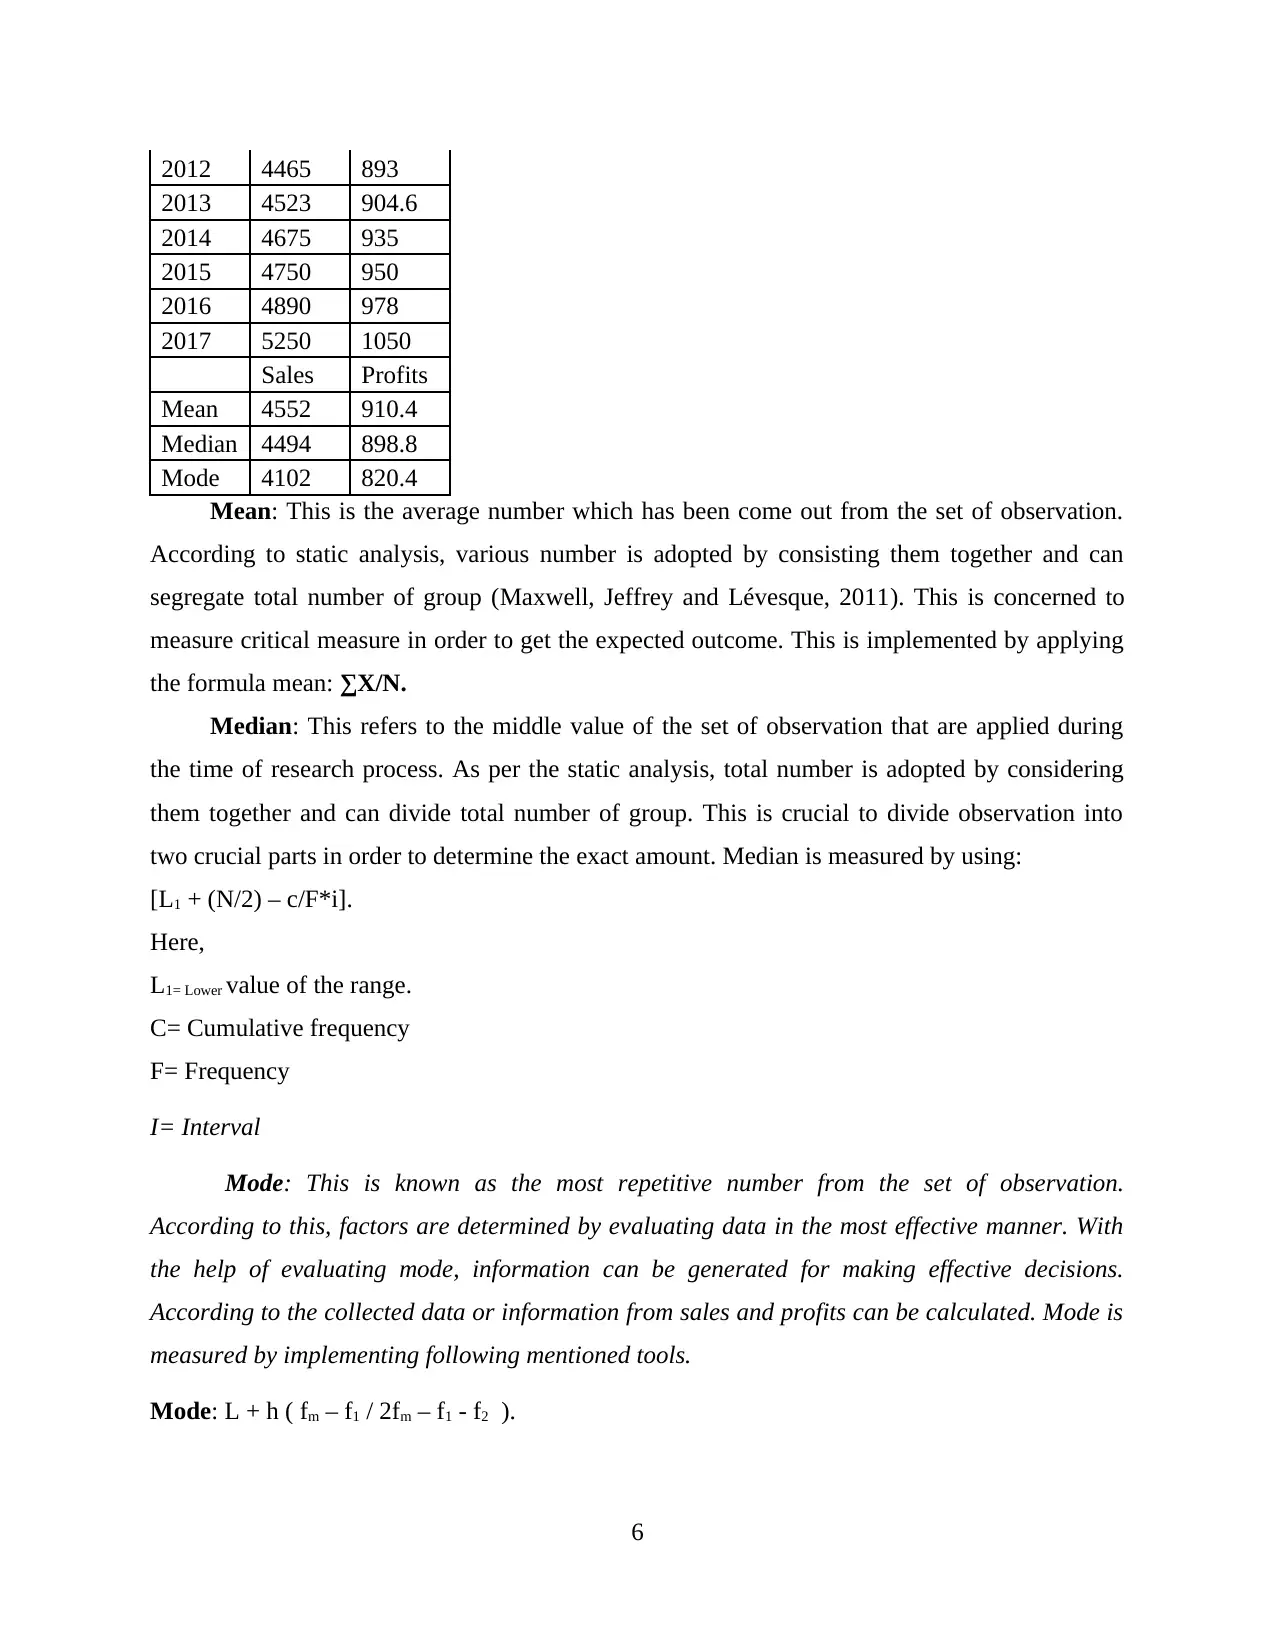
2012 4465 893
2013 4523 904.6
2014 4675 935
2015 4750 950
2016 4890 978
2017 5250 1050
Sales Profits
Mean 4552 910.4
Median 4494 898.8
Mode 4102 820.4
Mean: This is the average number which has been come out from the set of observation.
According to static analysis, various number is adopted by consisting them together and can
segregate total number of group (Maxwell, Jeffrey and Lévesque, 2011). This is concerned to
measure critical measure in order to get the expected outcome. This is implemented by applying
the formula mean: ∑X/N.
Median: This refers to the middle value of the set of observation that are applied during
the time of research process. As per the static analysis, total number is adopted by considering
them together and can divide total number of group. This is crucial to divide observation into
two crucial parts in order to determine the exact amount. Median is measured by using:
[L1 + (N/2) – c/F*i].
Here,
L1= Lower value of the range.
C= Cumulative frequency
F= Frequency
I= Interval
Mode: This is known as the most repetitive number from the set of observation.
According to this, factors are determined by evaluating data in the most effective manner. With
the help of evaluating mode, information can be generated for making effective decisions.
According to the collected data or information from sales and profits can be calculated. Mode is
measured by implementing following mentioned tools.
Mode: L + h ( fm – f1 / 2fm – f1 - f2 ).
6
2.3 Analyse of measure of dispersion:
YEAR Sales Net
Profit
2008 4102 820.4
2009 4205 841
2010 4295 859
2011 4365 873
2012 4465 893
2013 4523 904.6
2014 4675 935
2015 4750 950
2016 4890 978
2017 5250 1050
Sales Profits
Standard Deviation 347.70965 69.5419
Correlation co-
efficient
1
Minimum range 4102 820.4
Maximum range 5250 1050
Standard deviation: This refers to the company’s systematic tools which is applied for
evaluating the risk which are enjoyed with the research (Sköld, Alm and Scholz, 2013). This can
be mostly supportable in framing valuable decisions for improving productivity and profitability
of the quoted firm. Standard deviation: √∑Fdx2/N – (∑Fdx/N)2
2.4 Advantages of applying quartile, percentile and co-efficient correlation:
Quartiles are the one which assist in assessing the value for linking to each quarter such as
1, 2, 3. As per this, by incorporating evaluation of the performance of each quarter researcher
must need to withdraw a valid outcome. While percentile outcome of the data set for
incorporating the percentage. Henceforth, it is the crucial aspect which distinguish percentile
from quartile.
Calculation of quartile and percentile:
Sales Profits
Q1 or 25th
percentile
4312.5 862.5
Q2 or 50th
percentile
4494 898.8
7
⊘ This is a preview!⊘
Do you want full access?
Subscribe today to unlock all pages.
Trusted by 1+ million students worldwide
Q3 or 25th
percentile
4731.25 946.25
Quartile: There are so many segments which reflects the value of the set of observation.
Generally, there are three kinds of quartiles which are as follows (Simon, 2015). Lower quartile
represents the 25% value of the set of observation. Lower quartile of the sales and profits are
4312.5 and 862.5. While on the other hand, percentile does likewise reveal the same value.
TASK 3
3.1 Produce graphs:
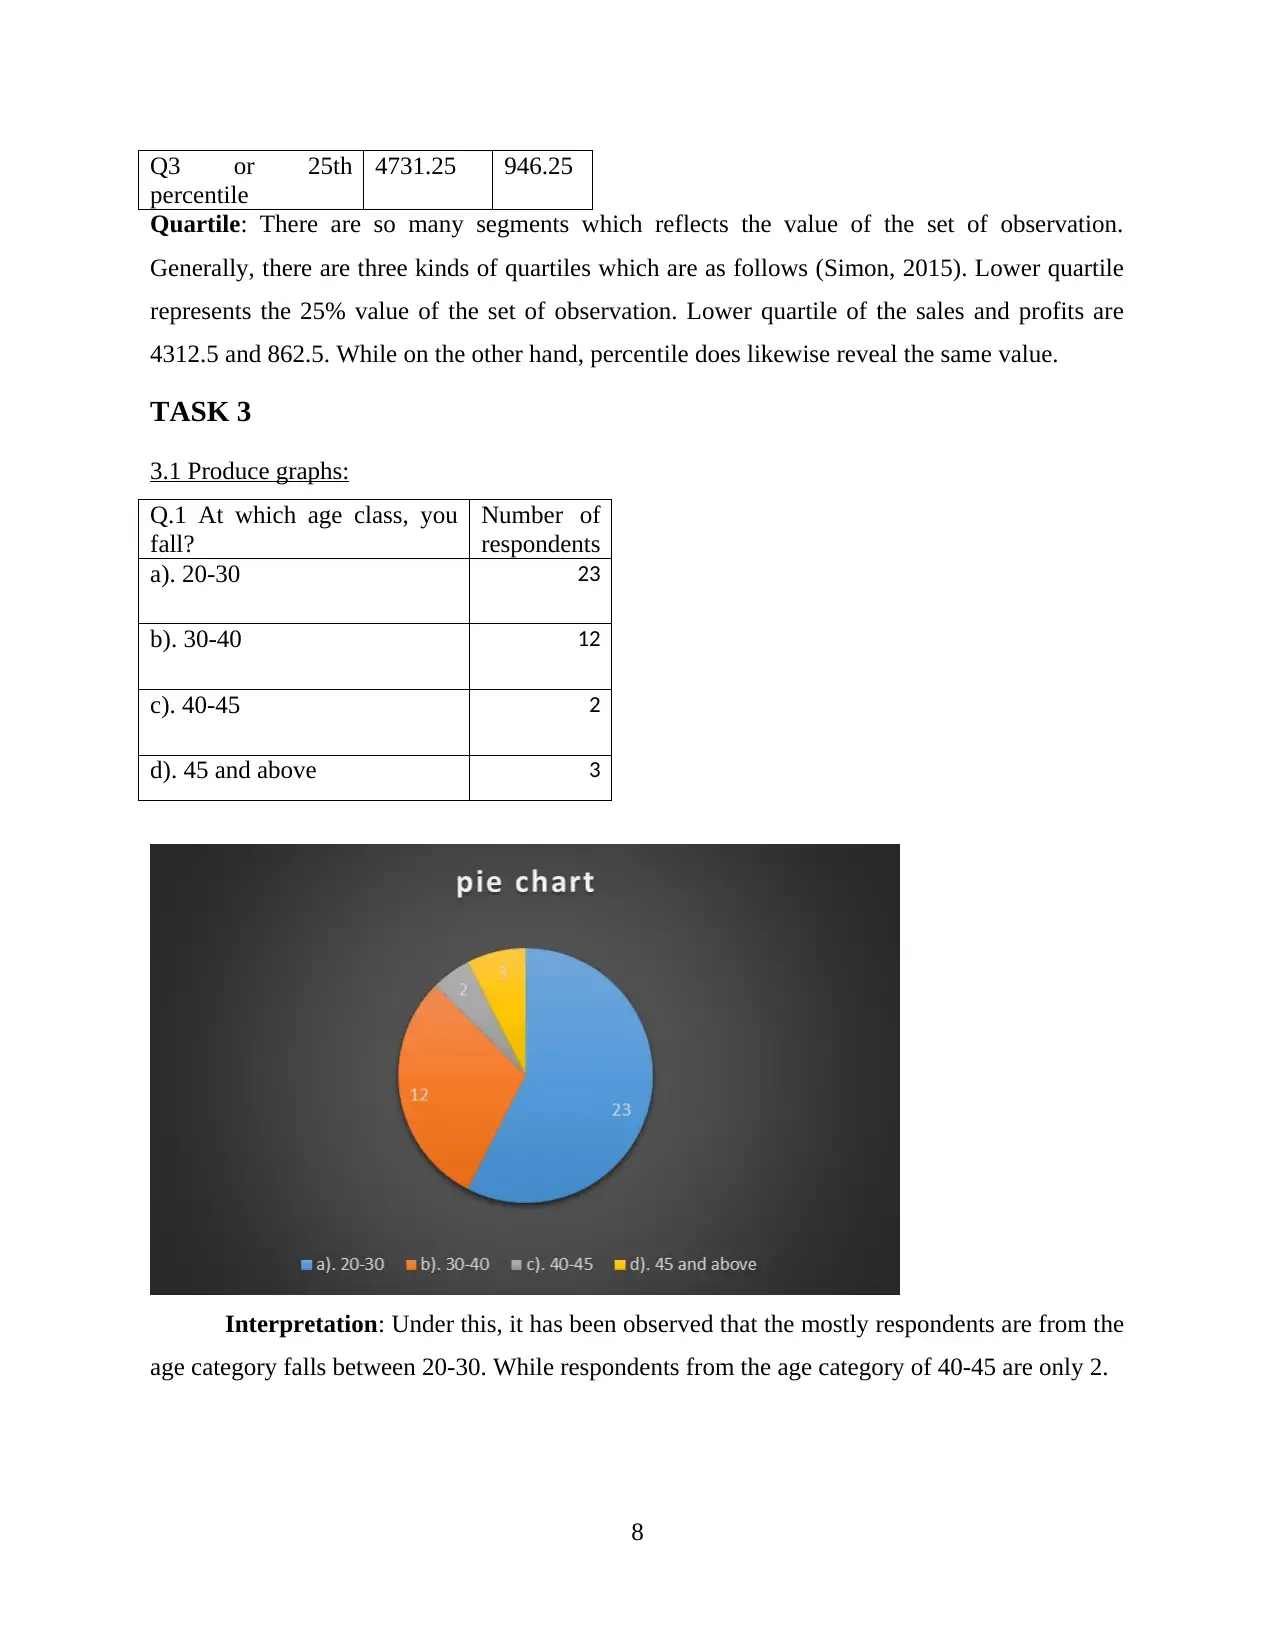
Q.1 At which age class, you
fall?
Number of
respondents
a). 20-30 23
b). 30-40 12
c). 40-45 2
d). 45 and above 3
Interpretation: Under this, it has been observed that the mostly respondents are from the
age category falls between 20-30. While respondents from the age category of 40-45 are only 2.
8
percentile
4731.25 946.25
Quartile: There are so many segments which reflects the value of the set of observation.
Generally, there are three kinds of quartiles which are as follows (Simon, 2015). Lower quartile
represents the 25% value of the set of observation. Lower quartile of the sales and profits are
4312.5 and 862.5. While on the other hand, percentile does likewise reveal the same value.
TASK 3
3.1 Produce graphs:
Q.1 At which age class, you
fall?
Number of
respondents
a). 20-30 23
b). 30-40 12
c). 40-45 2
d). 45 and above 3
Interpretation: Under this, it has been observed that the mostly respondents are from the
age category falls between 20-30. While respondents from the age category of 40-45 are only 2.
8
Paraphrase This Document
Need a fresh take? Get an instant paraphrase of this document with our AI Paraphraser
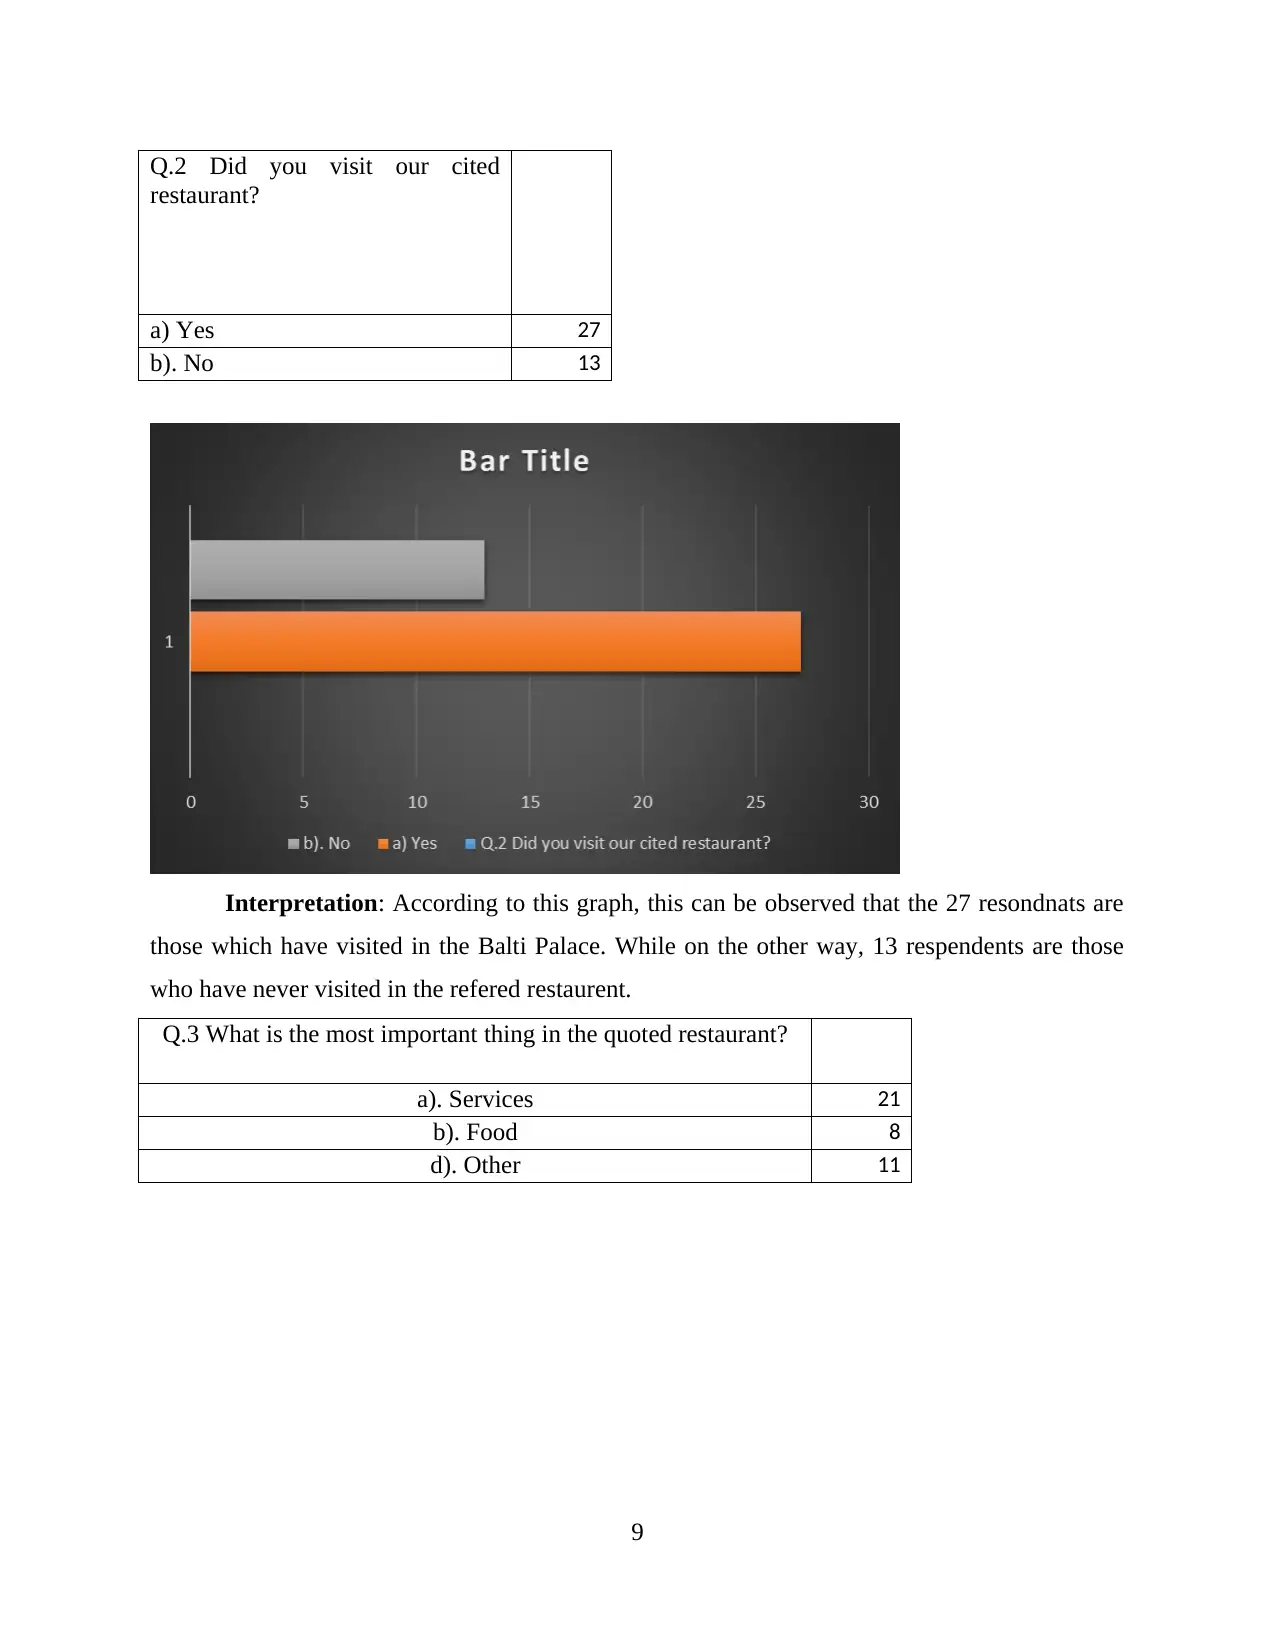
Q.2 Did you visit our cited
restaurant?
a) Yes 27
b). No 13
Interpretation: According to this graph, this can be observed that the 27 resondnats are
those which have visited in the Balti Palace. While on the other way, 13 respendents are those
who have never visited in the refered restaurent.
Q.3 What is the most important thing in the quoted restaurant?
a). Services 21
b). Food 8
d). Other 11
9
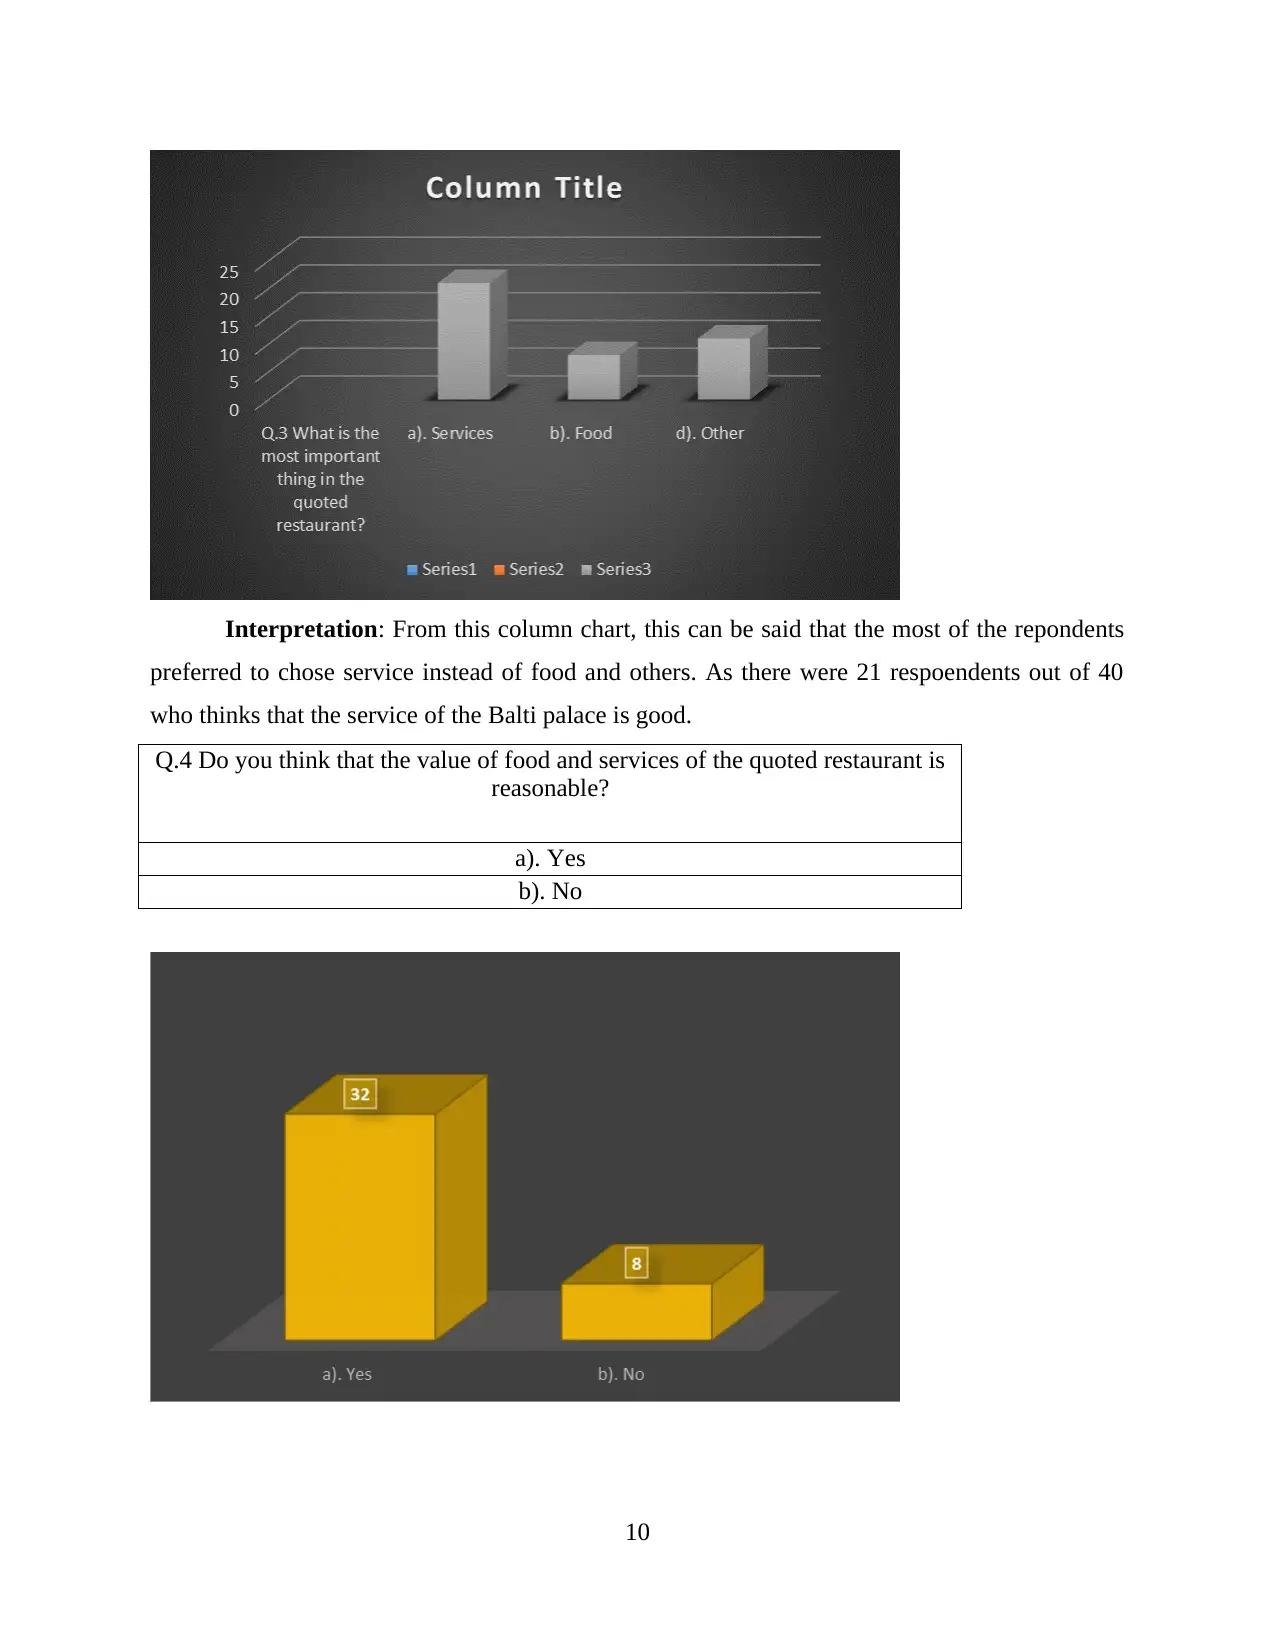
Interpretation: From this column chart, this can be said that the most of the repondents
preferred to chose service instead of food and others. As there were 21 respoendents out of 40
who thinks that the service of the Balti palace is good.
Q.4 Do you think that the value of food and services of the quoted restaurant is
reasonable?
a). Yes
b). No
10
preferred to chose service instead of food and others. As there were 21 respoendents out of 40
who thinks that the service of the Balti palace is good.
Q.4 Do you think that the value of food and services of the quoted restaurant is
reasonable?
a). Yes
b). No
10
⊘ This is a preview!⊘
Do you want full access?
Subscribe today to unlock all pages.
Trusted by 1+ million students worldwide
1 out of 21
Related Documents


Your All-in-One AI-Powered Toolkit for Academic Success.
+13062052269
info@desklib.com
Available 24*7 on WhatsApp / Email
![[object Object]](/_next/static/media/star-bottom.7253800d.svg)
Unlock your academic potential
Copyright © 2020–2026 A2Z Services. All Rights Reserved. Developed and managed by ZUCOL.