Business Decision Making Report: Restaurant Expansion and Analysis

Verified

Added on  2023/02/10

|16
|433
|36
Report
AI Summary
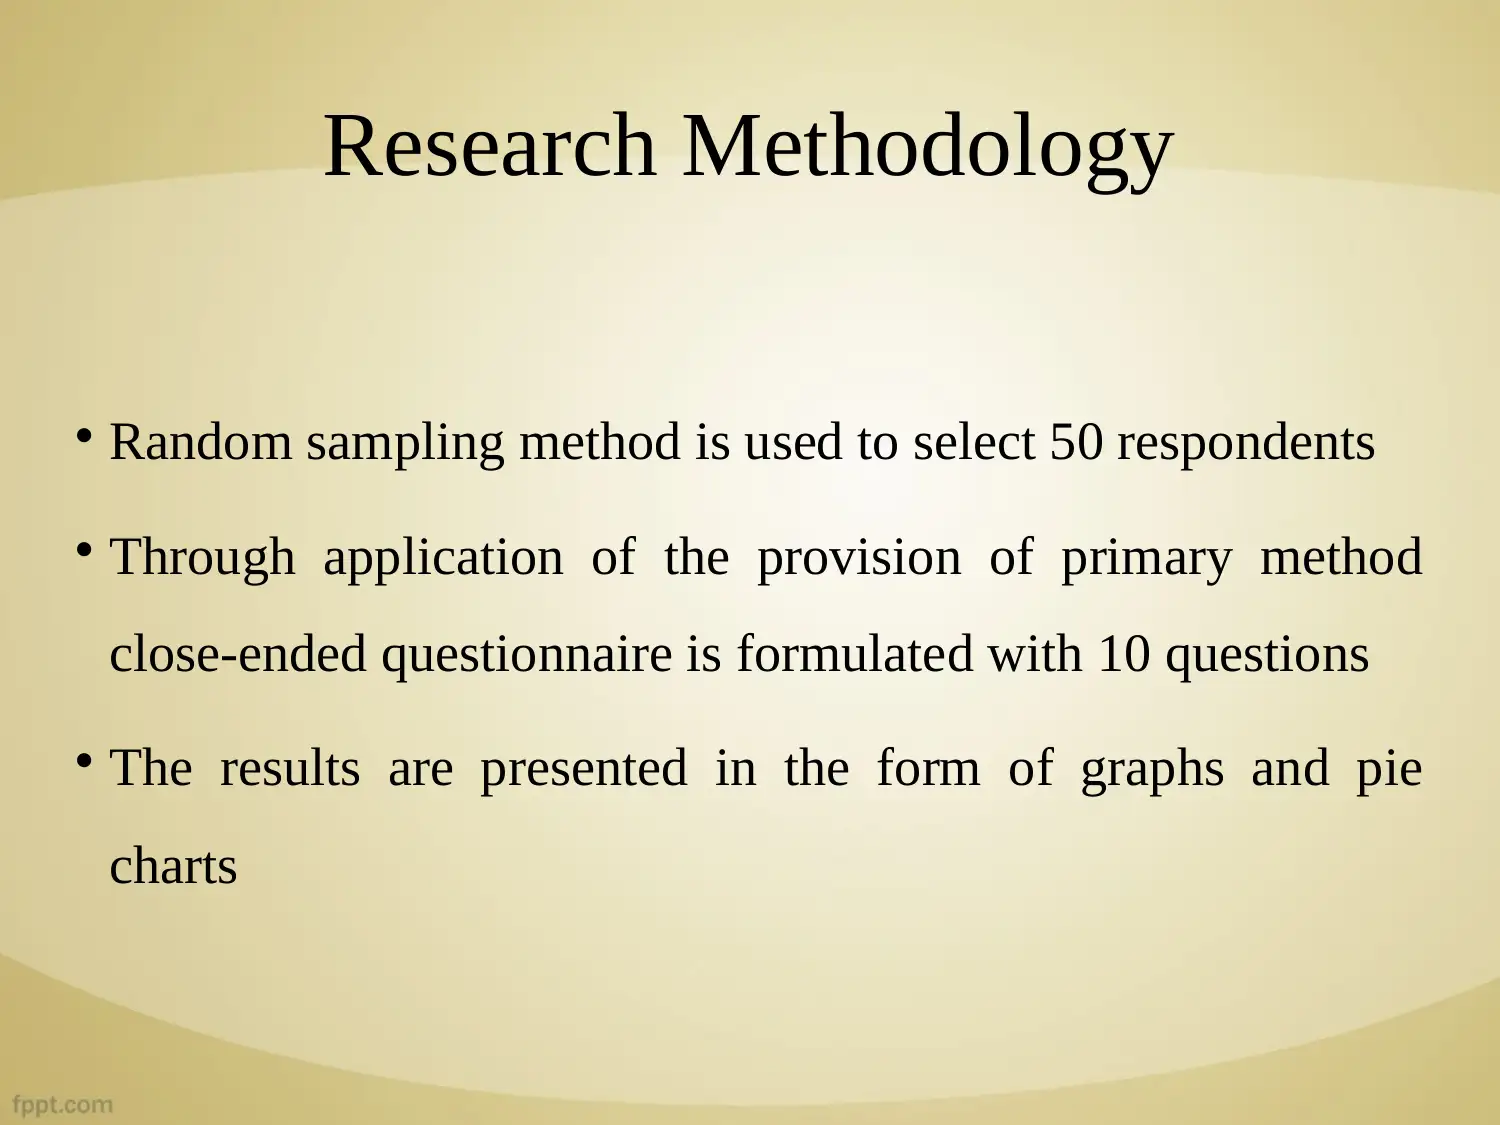
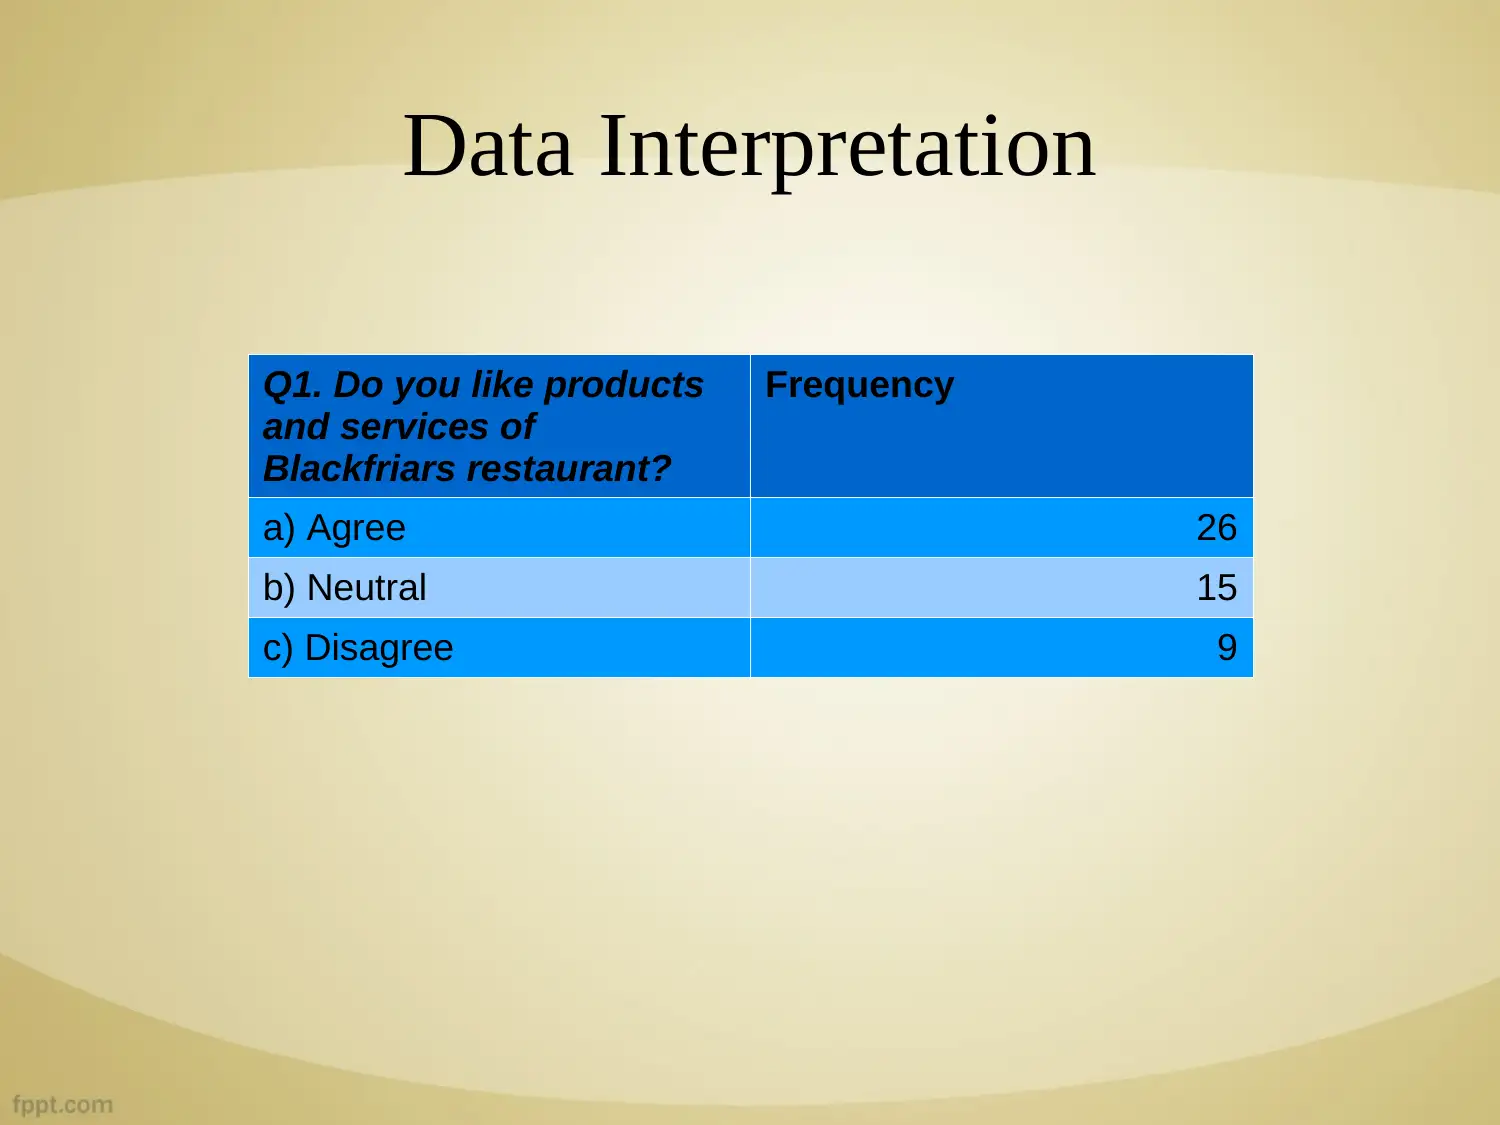
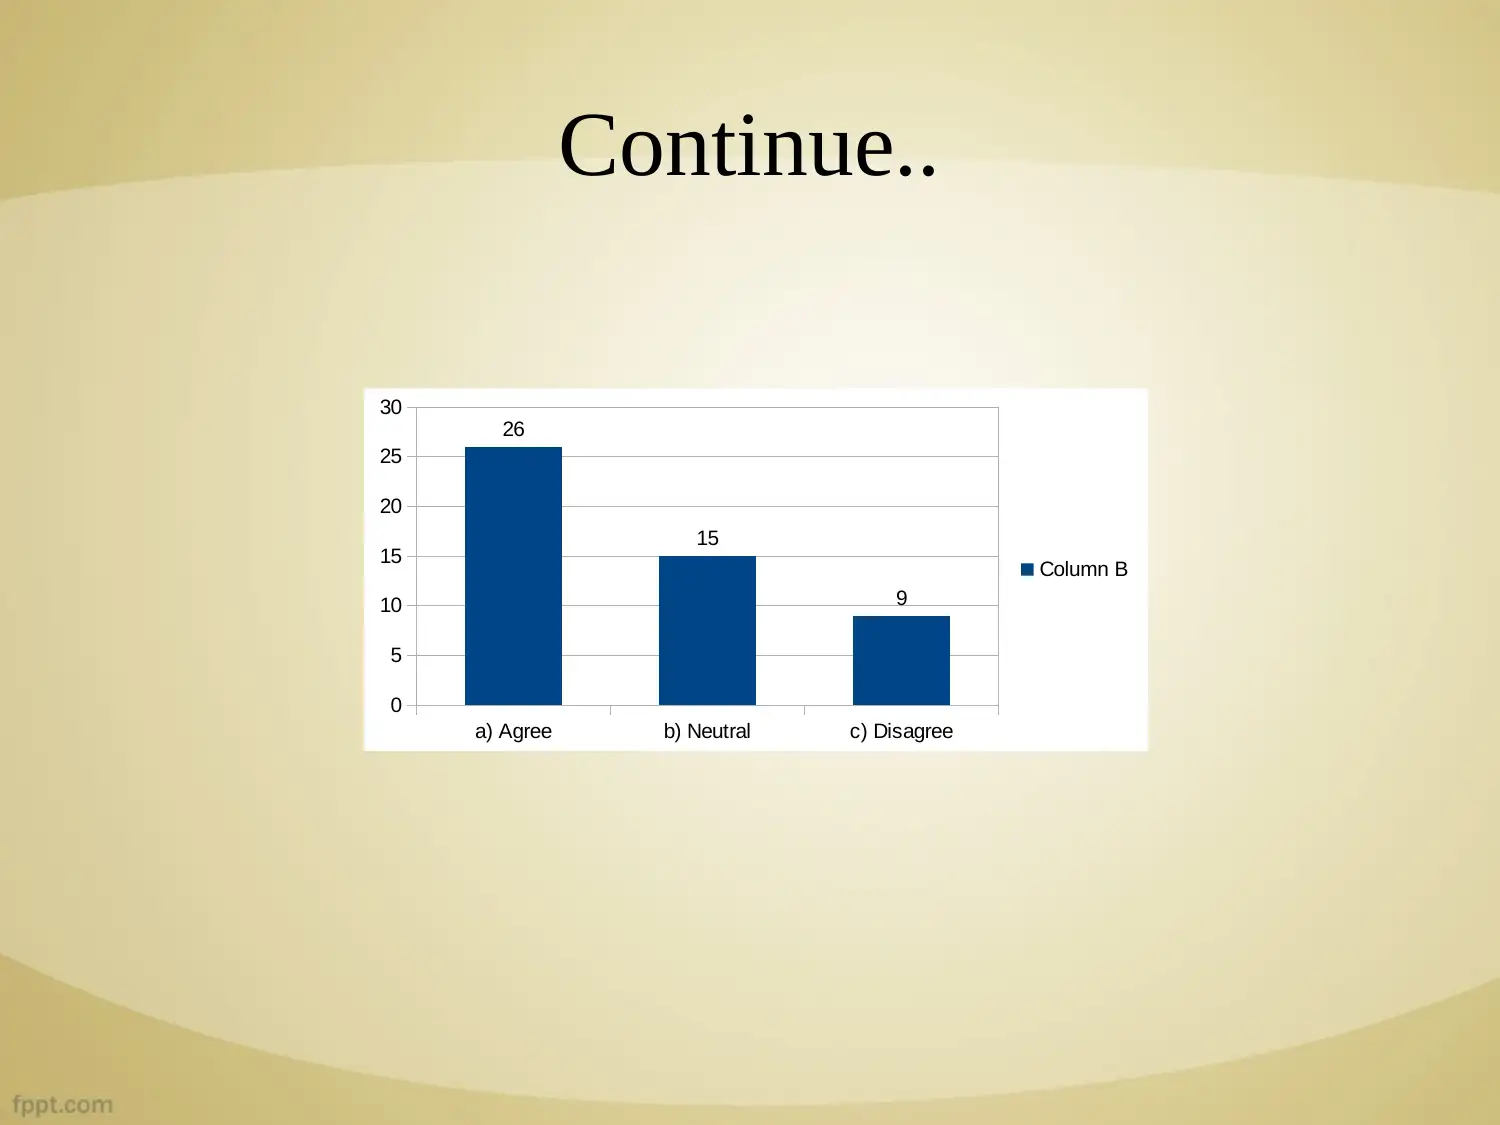
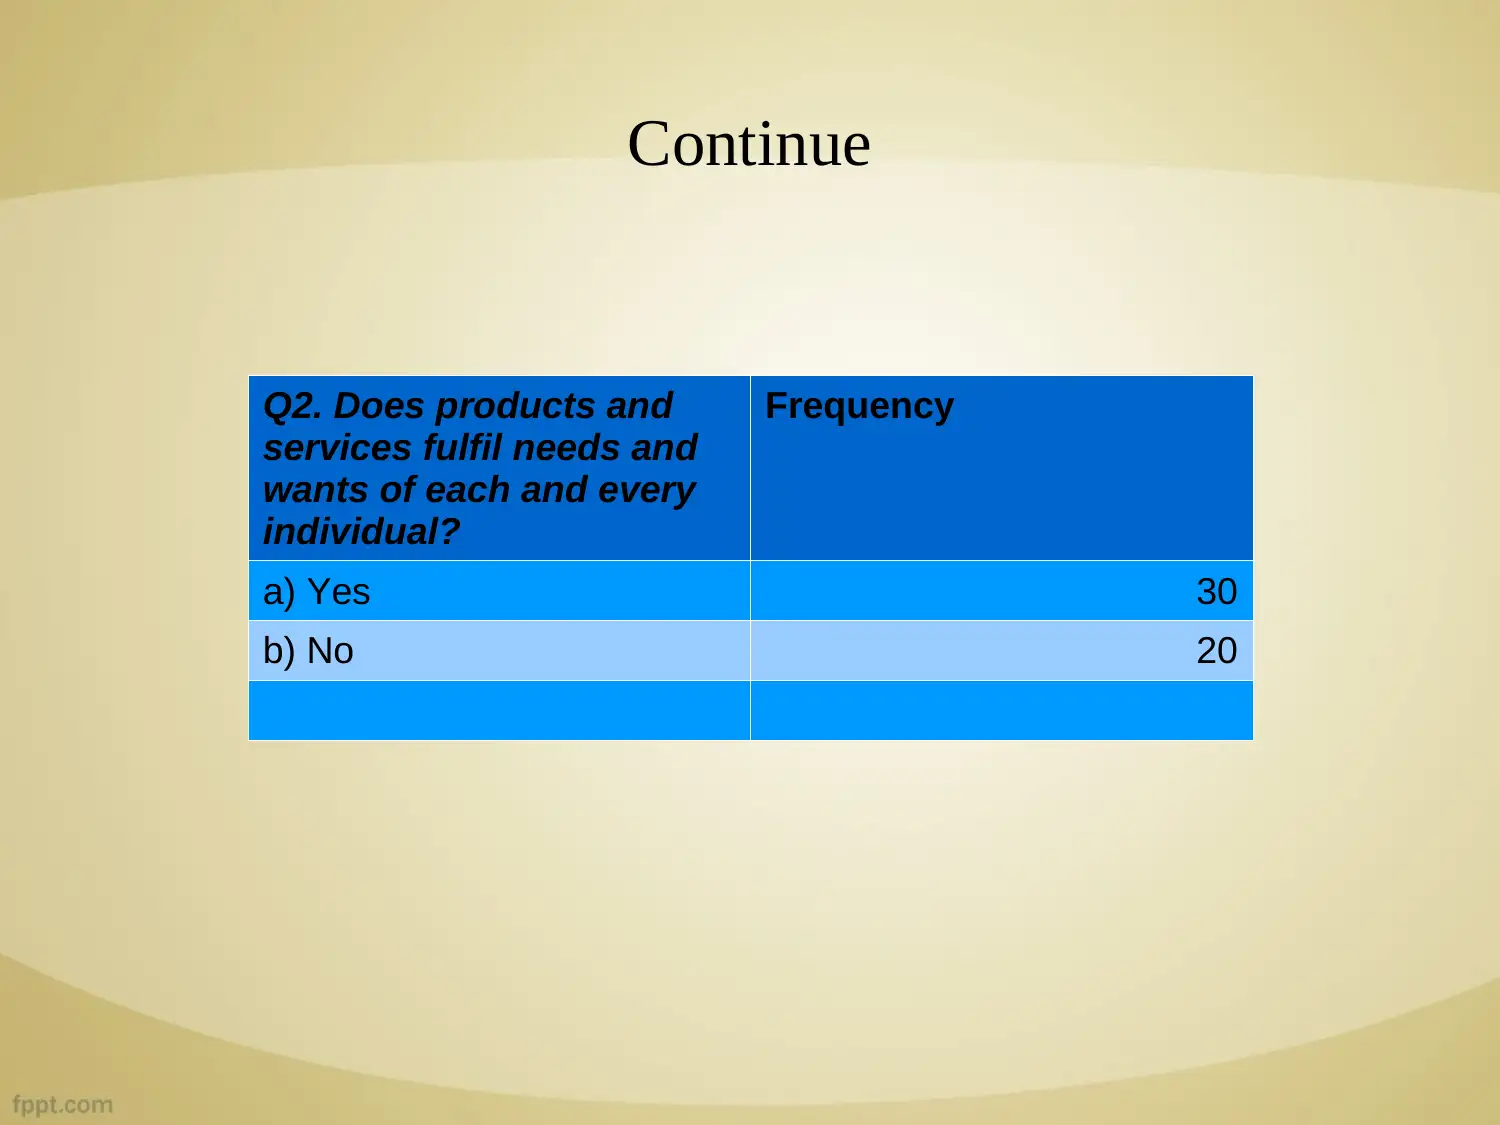
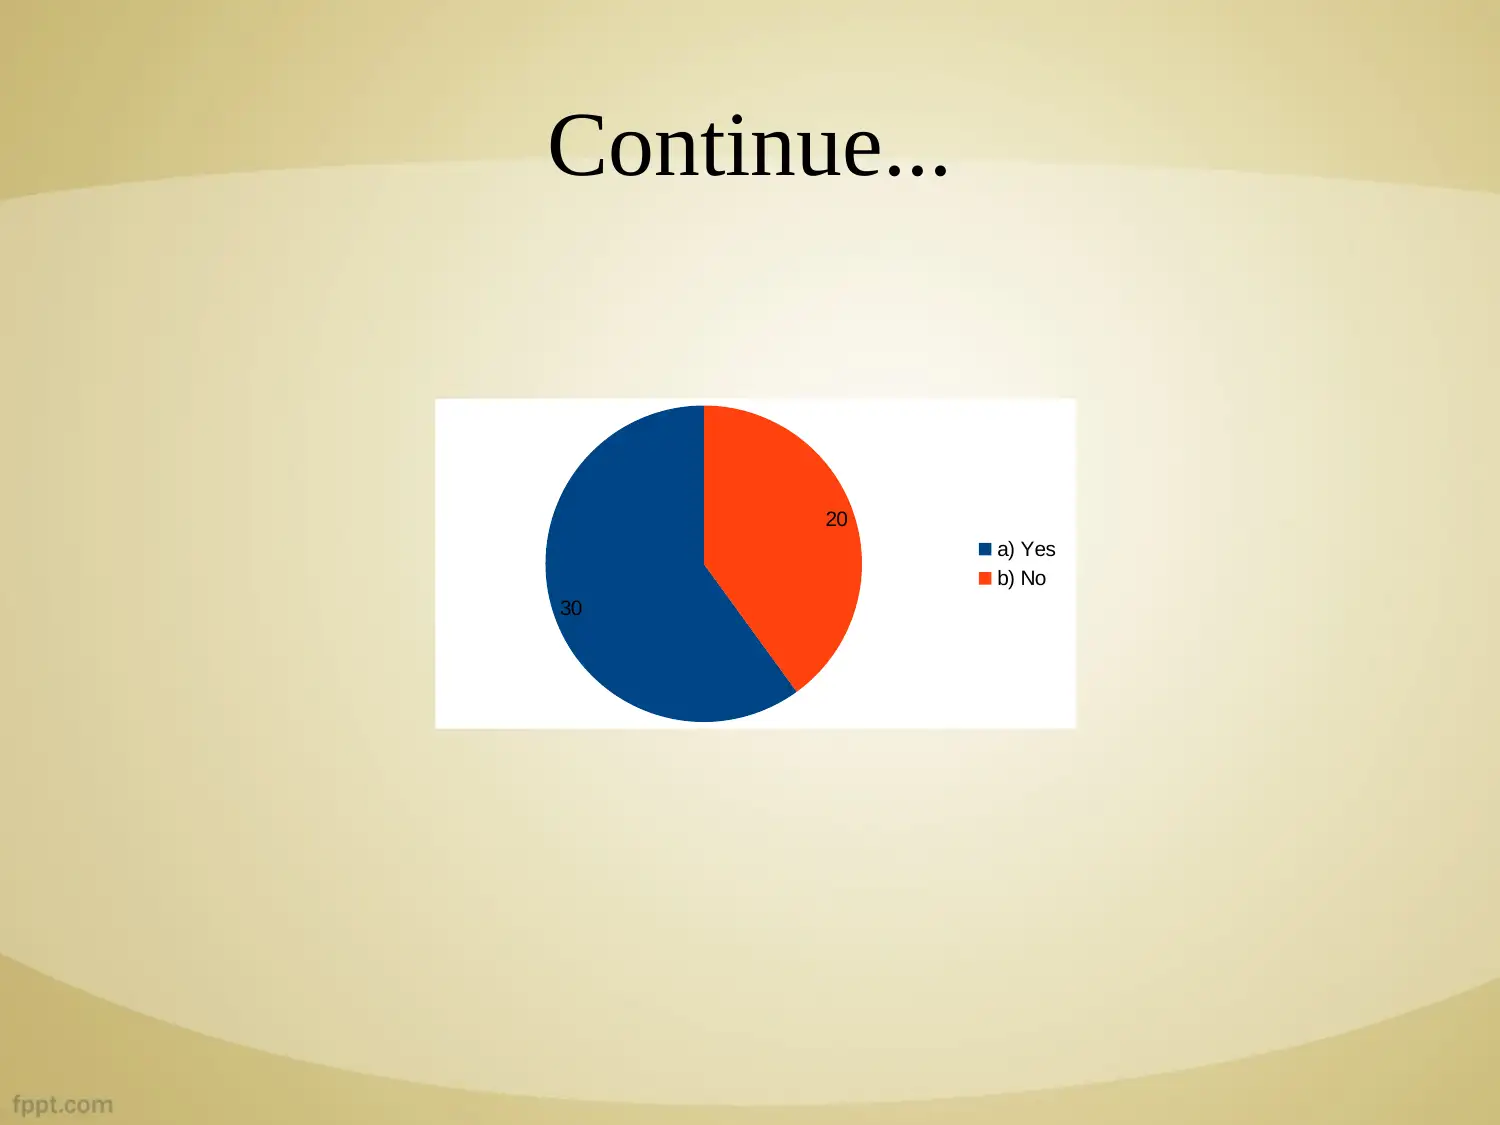
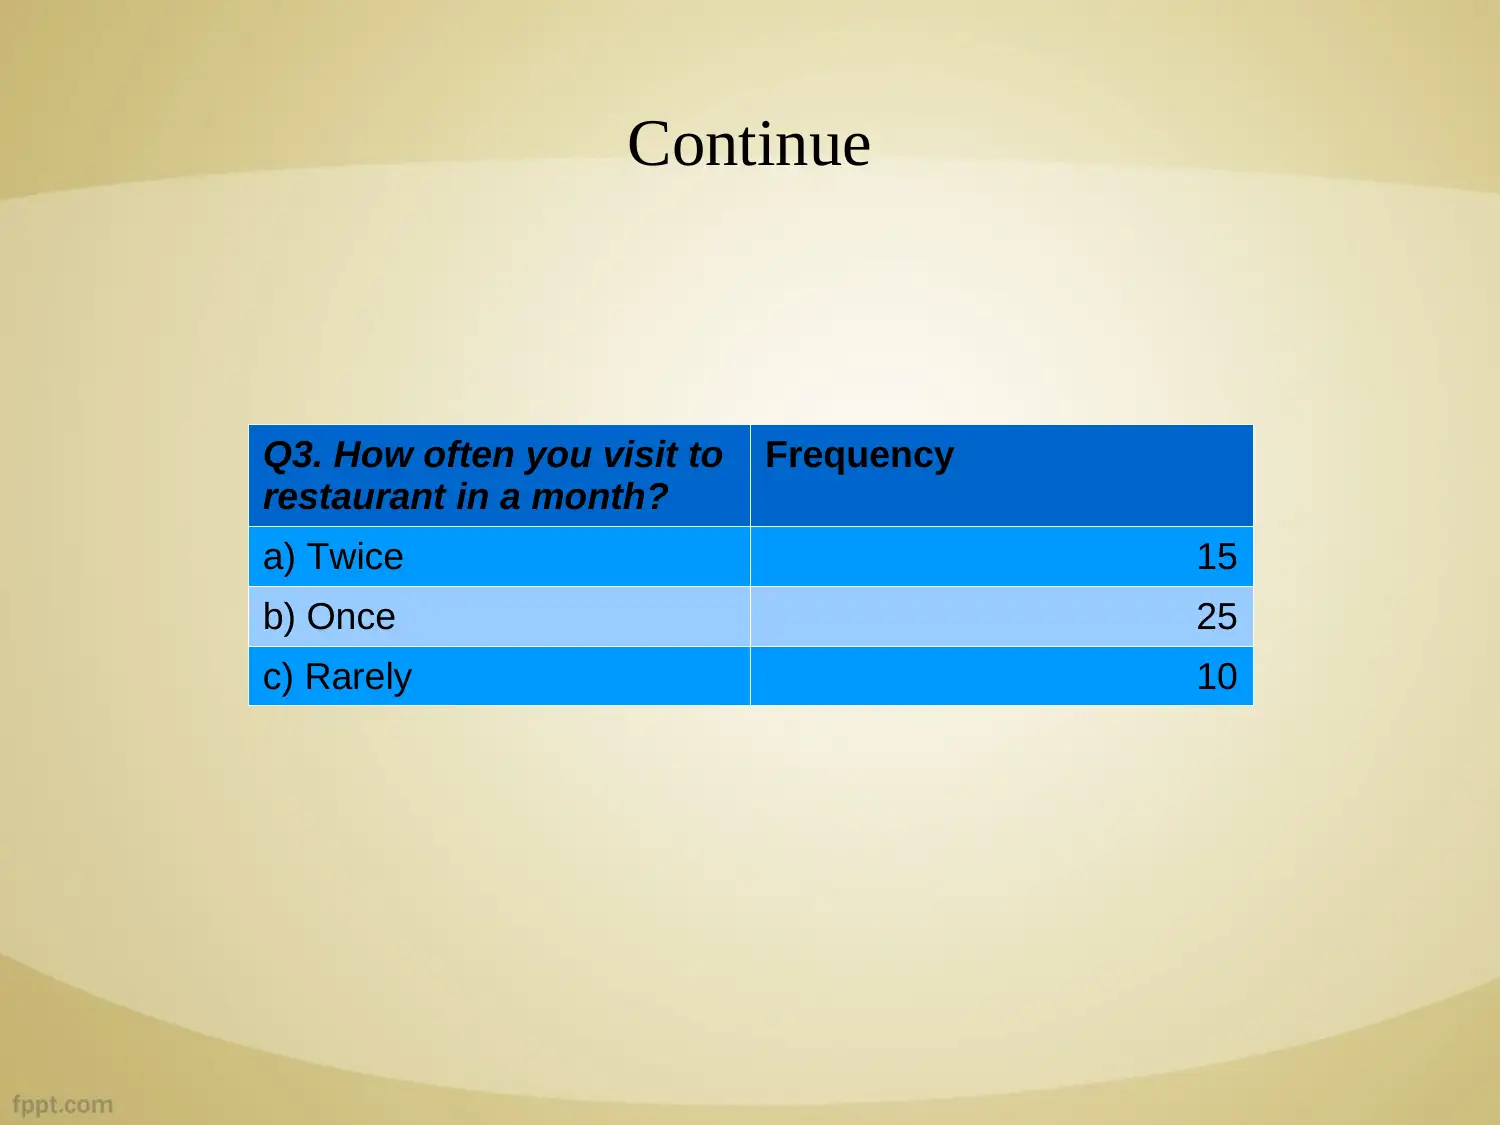
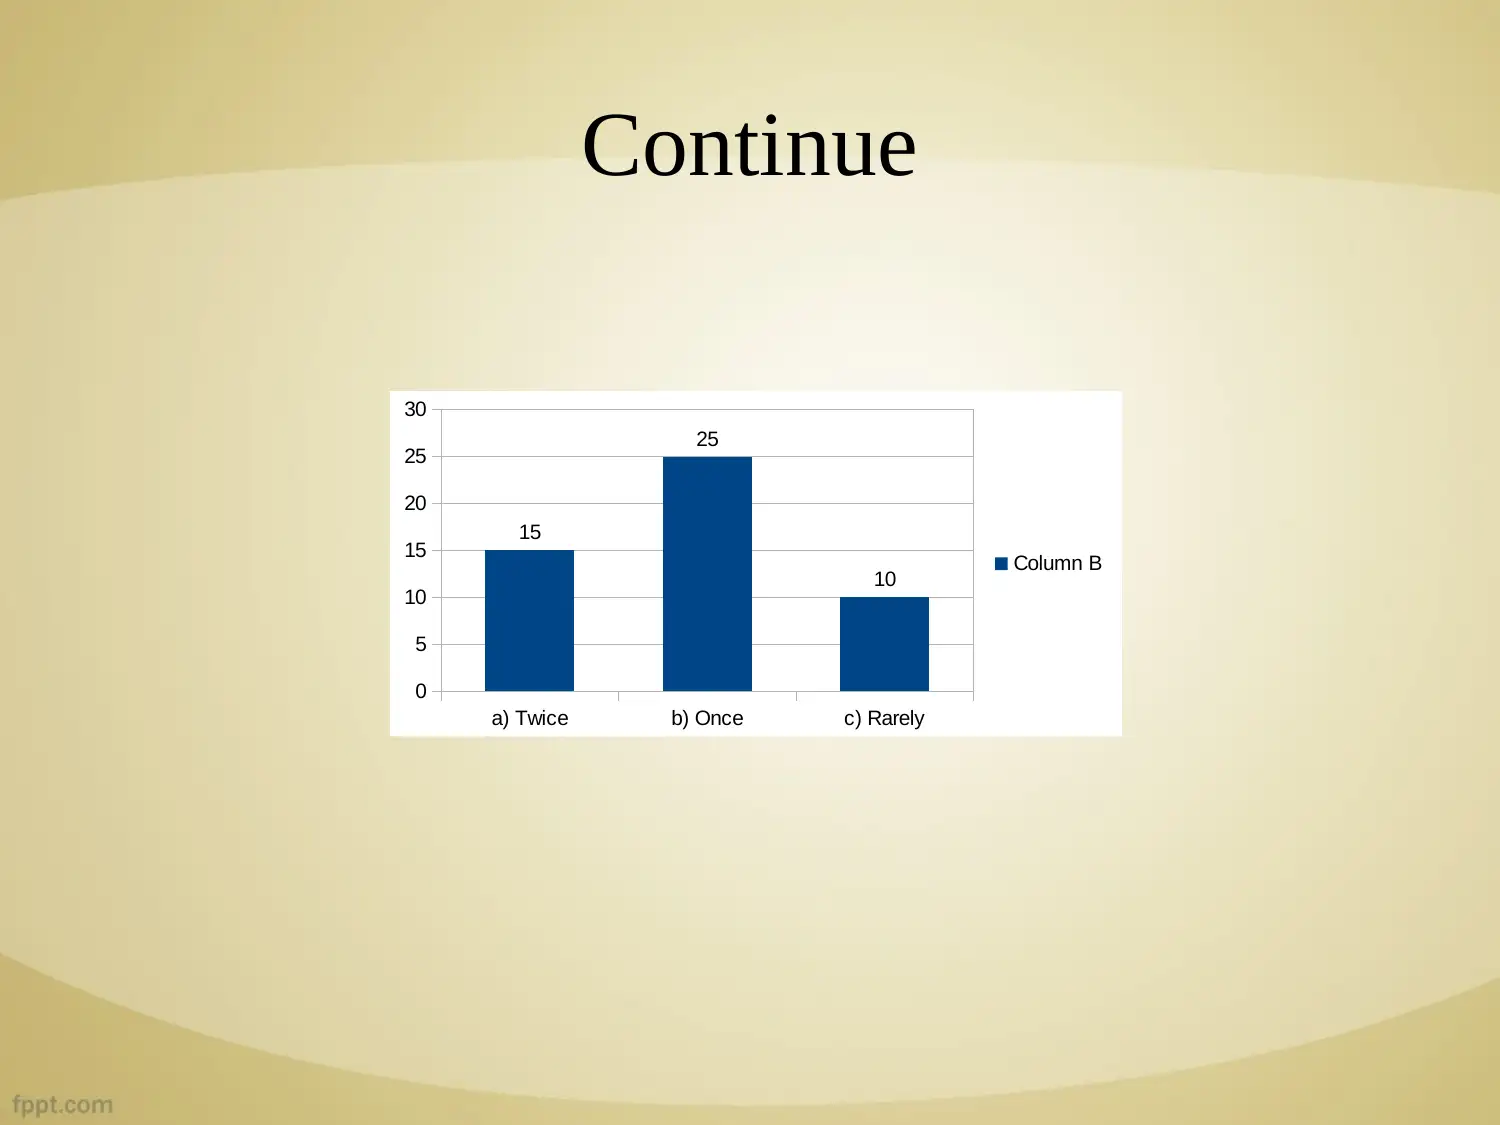
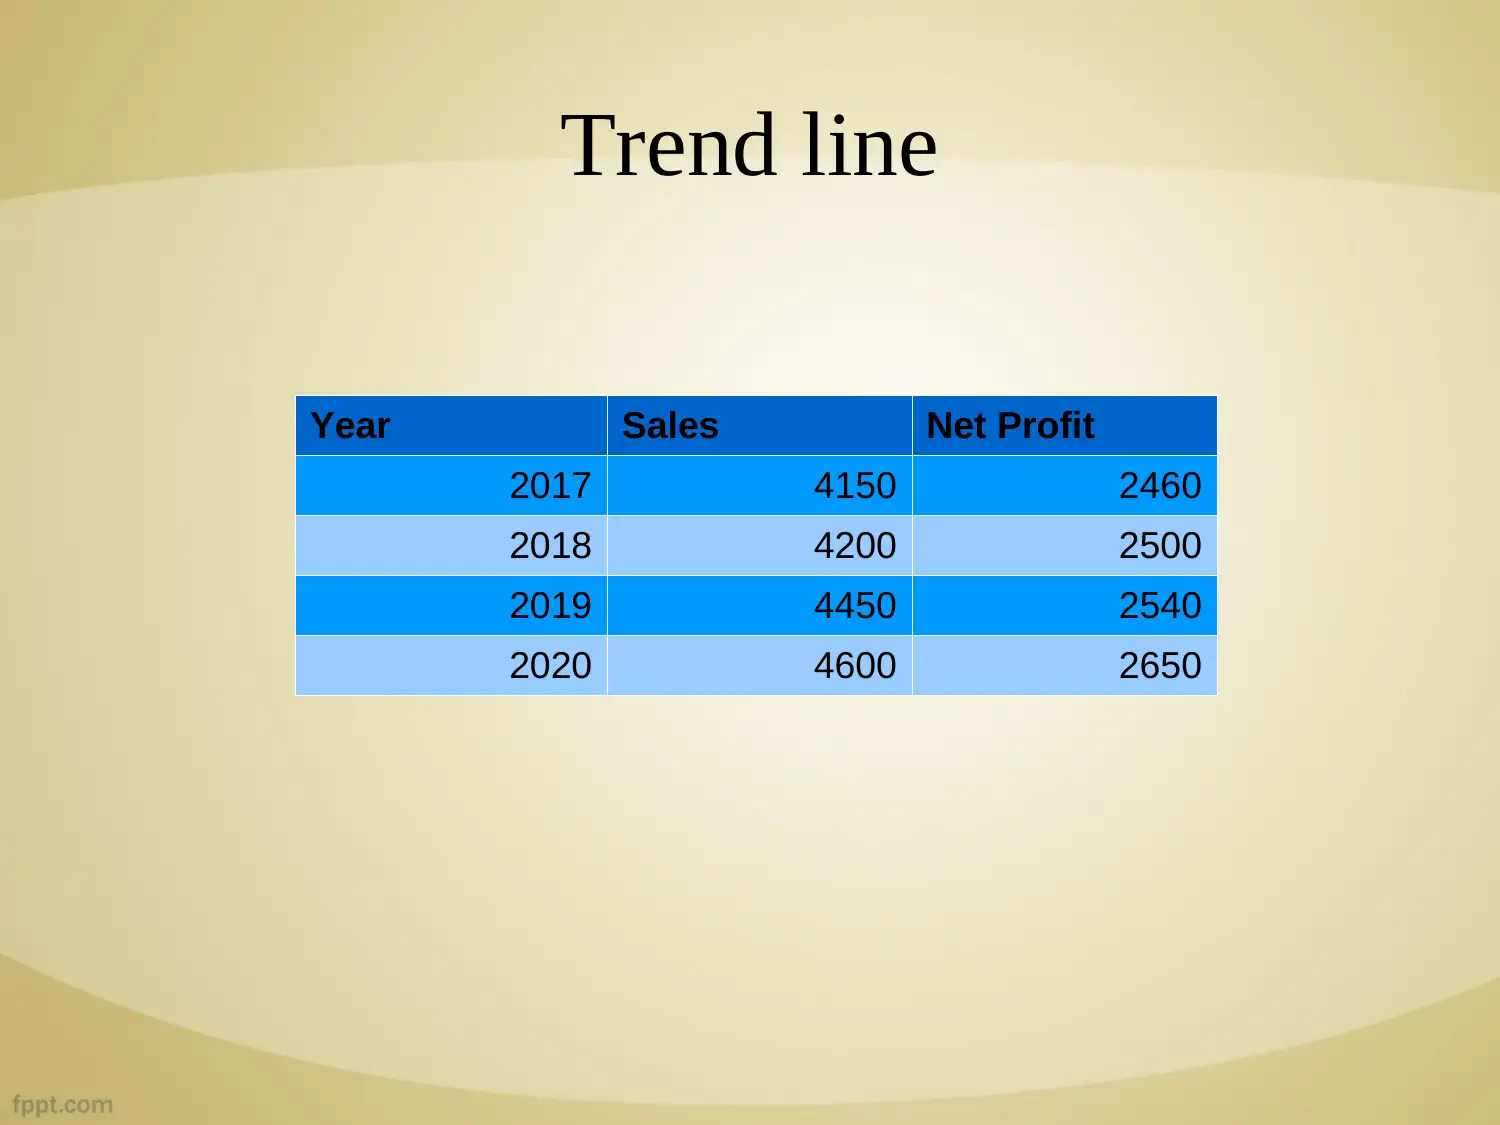
This report focuses on the business decision-making process for a restaurant, specifically examining the potential for expansion. The report begins with an introduction outlining the objectives and methodology, which includes a random sampling approach and the use of close-ended questionnaires. Data interpretation is presented through graphs and pie charts, analyzing customer satisfaction, needs fulfillment, and frequency of visits. The report further explores the restaurant's financial performance, using trend lines to illustrate sales and profit over time. The conclusion synthesizes the findings, emphasizing the importance of research and data analysis in making informed business decisions, particularly regarding expansion plans. The report references relevant literature and concludes with a thank you.
Document Page
Business Decision Making
Task 3.3
tabler-icon-diamond-filled.svg

Paraphrase This Document

Need a fresh take? Get an instant paraphrase of this document with our AI Paraphraser
Document Page
Covered content
Introduction
Objective
Research methodology
Data interpretation
Conclusion
References
Document Page
Introduction
Decision making is important aspect which includes the
process of collection of information to improve
understanding and selection of the most profitable
alternative which provides maximum benefits.
Document Page
Objective
To open new branch in London for expansion of business
activities
Earning of the large number of profits through
satisfaction of the various needs of customers
tabler-icon-diamond-filled.svg

Paraphrase This Document

Need a fresh take? Get an instant paraphrase of this document with our AI Paraphraser
Document Page
Research Methodology
Random sampling method is used to select 50 respondents
Through application of the provision of primary method
close-ended questionnaire is formulated with 10 questions
The results are presented in the form of graphs and pie
charts
Document Page
Data Interpretation
Q1. Do you like products
and services of
Blackfriars restaurant?
Frequency
a) Agree 26
b) Neutral 15
c) Disagree 9
Document Page
Continue..
a) Agree b) Neutral c) Disagree
0
5
10
15
20
25
30
26
15
9
Column B
tabler-icon-diamond-filled.svg

Paraphrase This Document

Need a fresh take? Get an instant paraphrase of this document with our AI Paraphraser
Document Page
Continue
Q2. Does products and
services fulfil needs and
wants of each and every
individual?
Frequency
a) Yes 30
b) No 20
Document Page
Continue...
30
20
a) Yes
b) No
Document Page
Continue
Q3. How often you visit to
restaurant in a month?
Frequency
a) Twice 15
b) Once 25
c) Rarely 10
tabler-icon-diamond-filled.svg

Paraphrase This Document

Need a fresh take? Get an instant paraphrase of this document with our AI Paraphraser
Document Page
Continue
a) Twice b) Once c) Rarely
0
5
10
15
20
25
30
15
25
10 Column B
Document Page
Trend line
Year Sales Net Profit
2017 4150 2460
2018 4200 2500
2019 4450 2540
2020 4600 2650
chevron_up_icon
1 out of 16
circle_padding
hide_on_mobile
zoom_out_icon
[object Object]