HND Business: Business Decision Making Assignment - UK Restaurant

Verified

Added on  2023/03/23

|9
|270
|97
Report
AI Summary
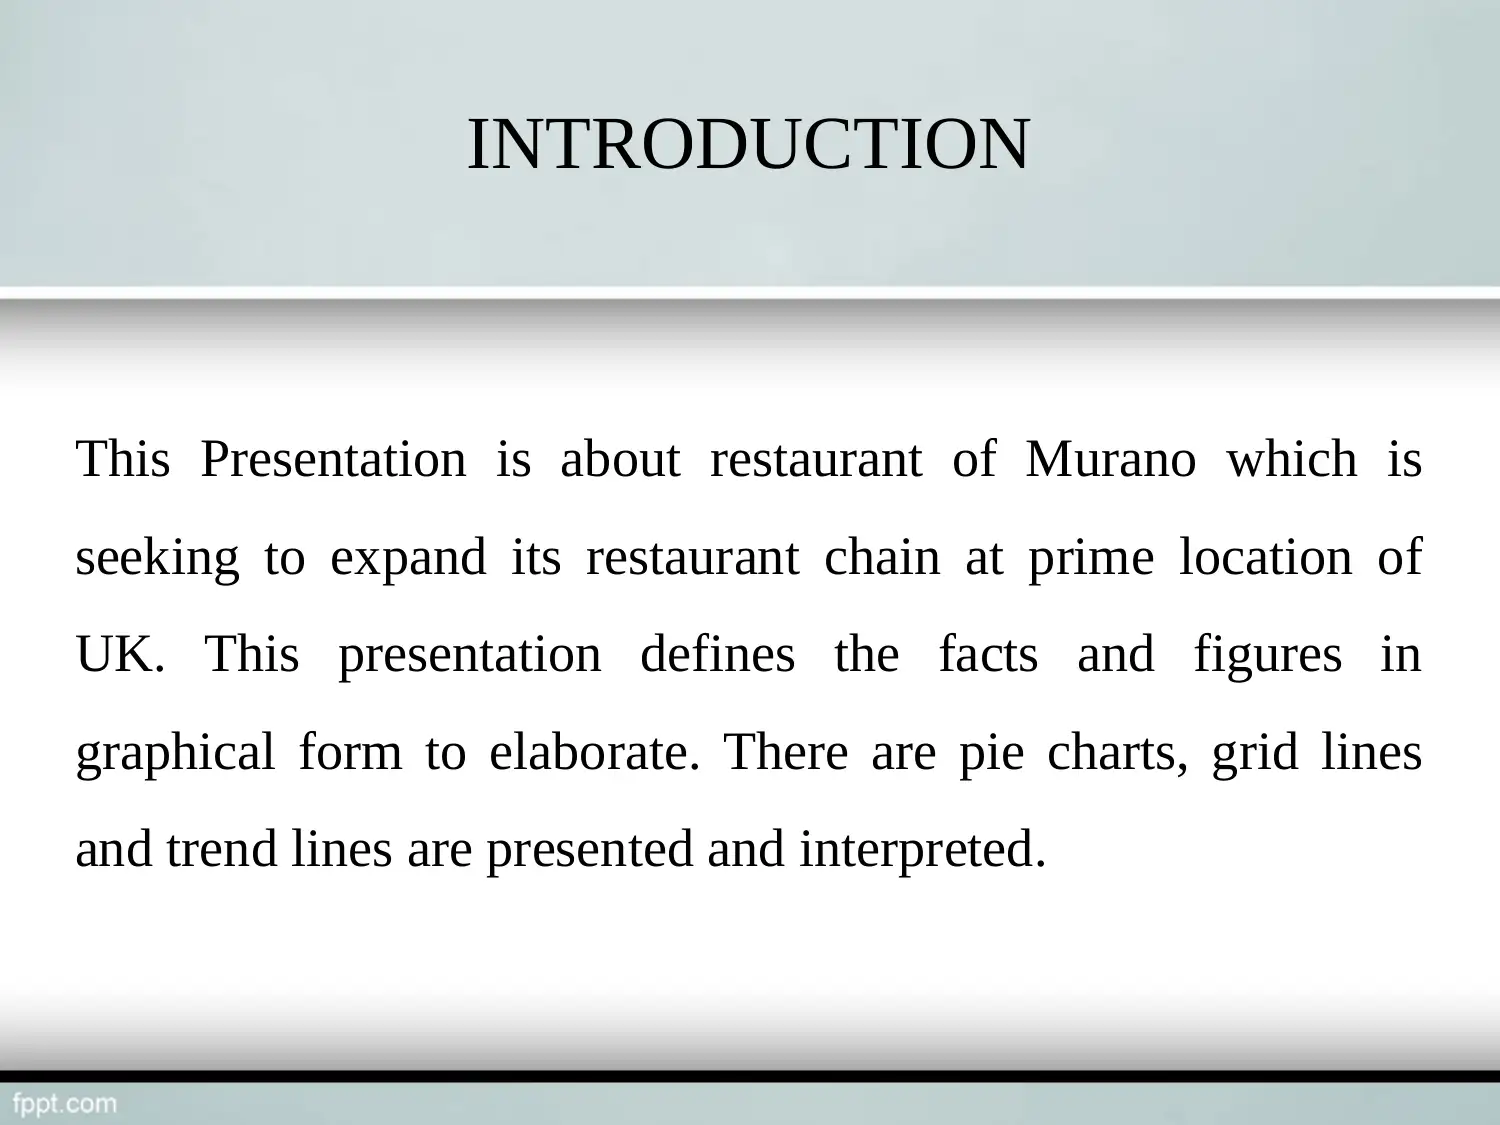
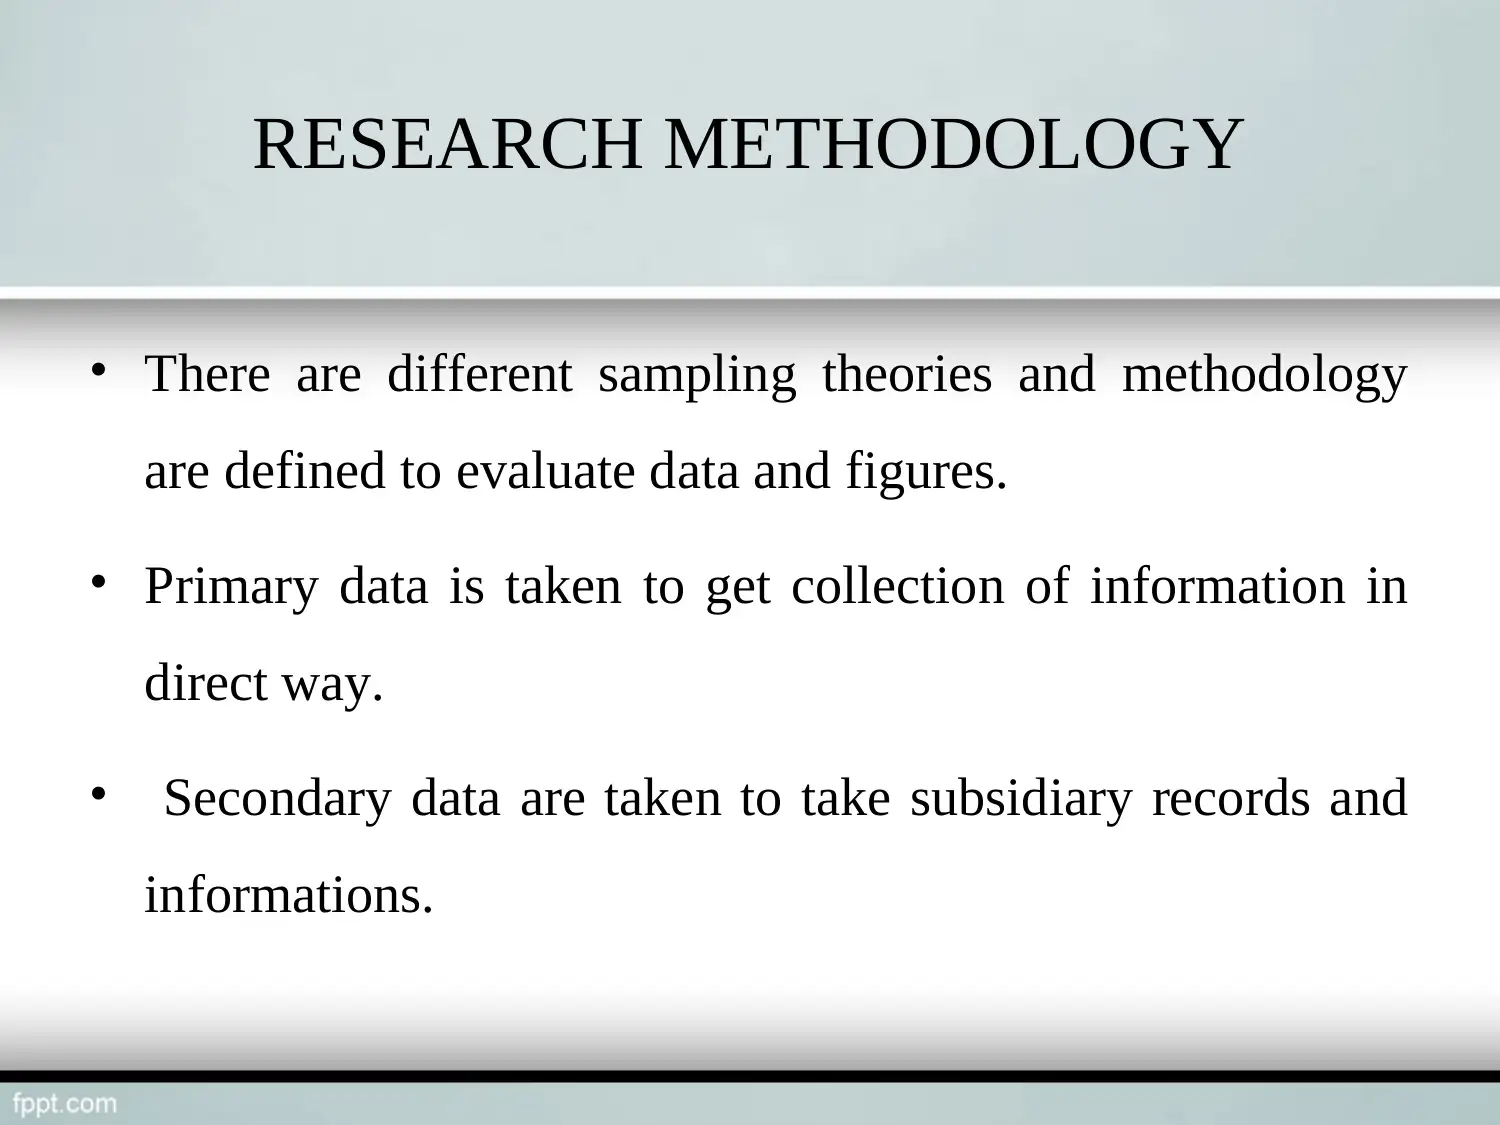
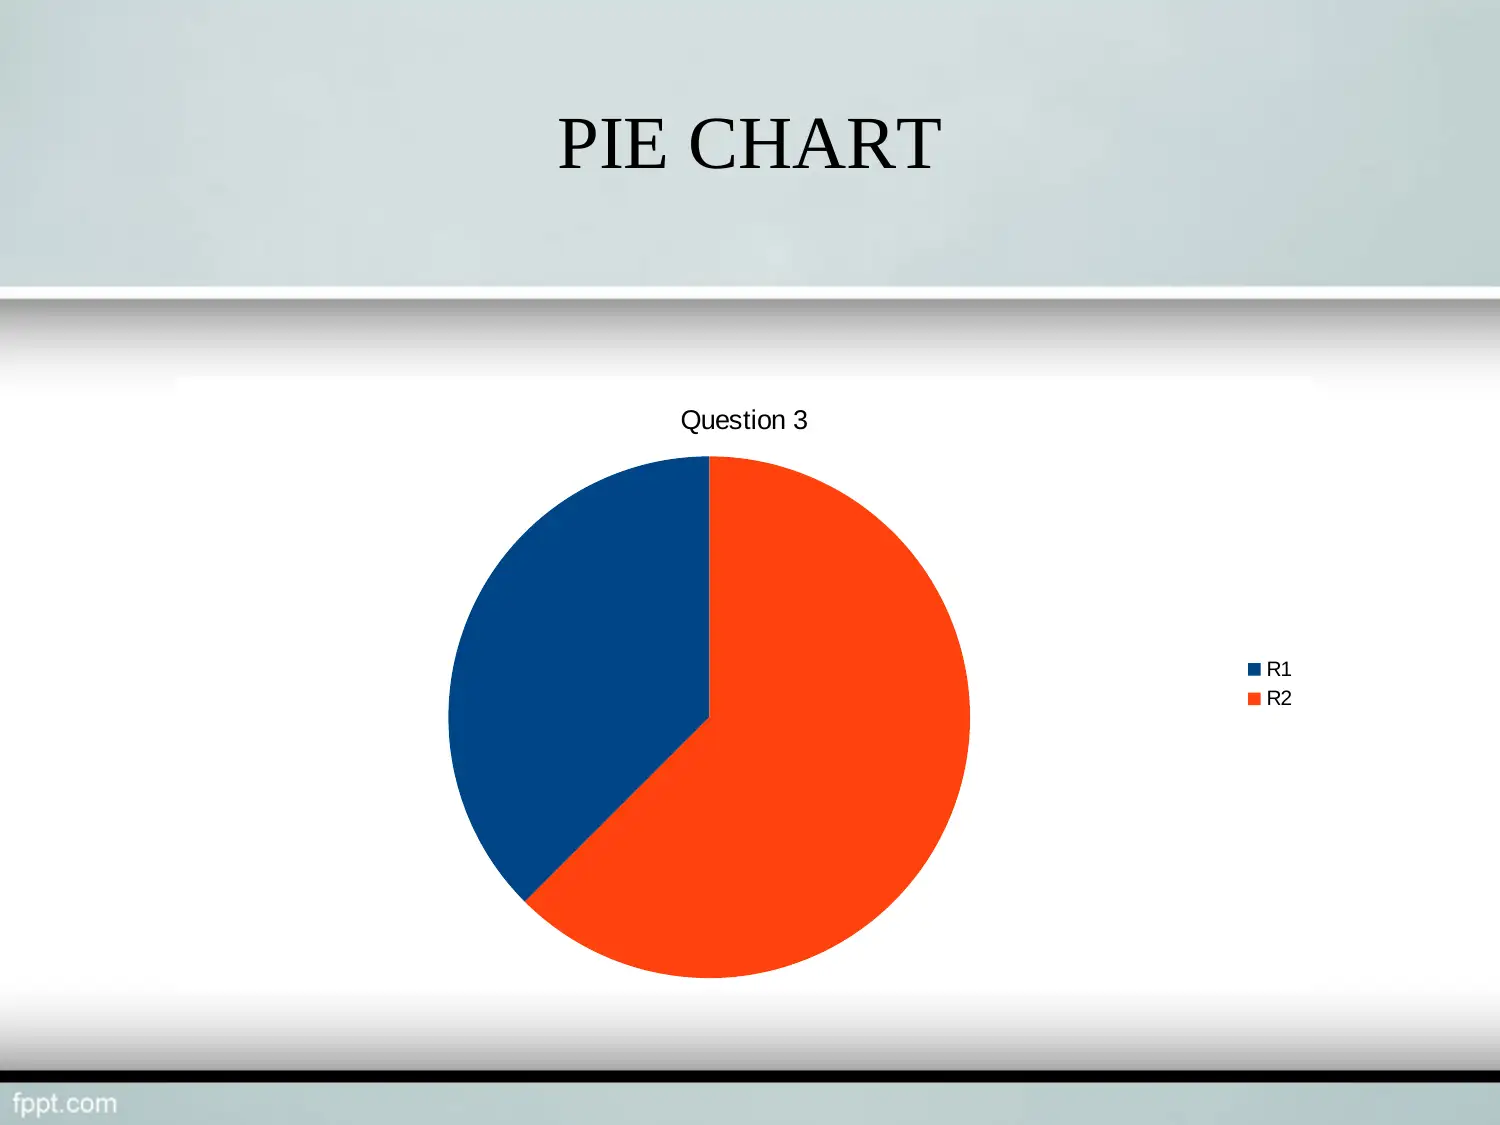
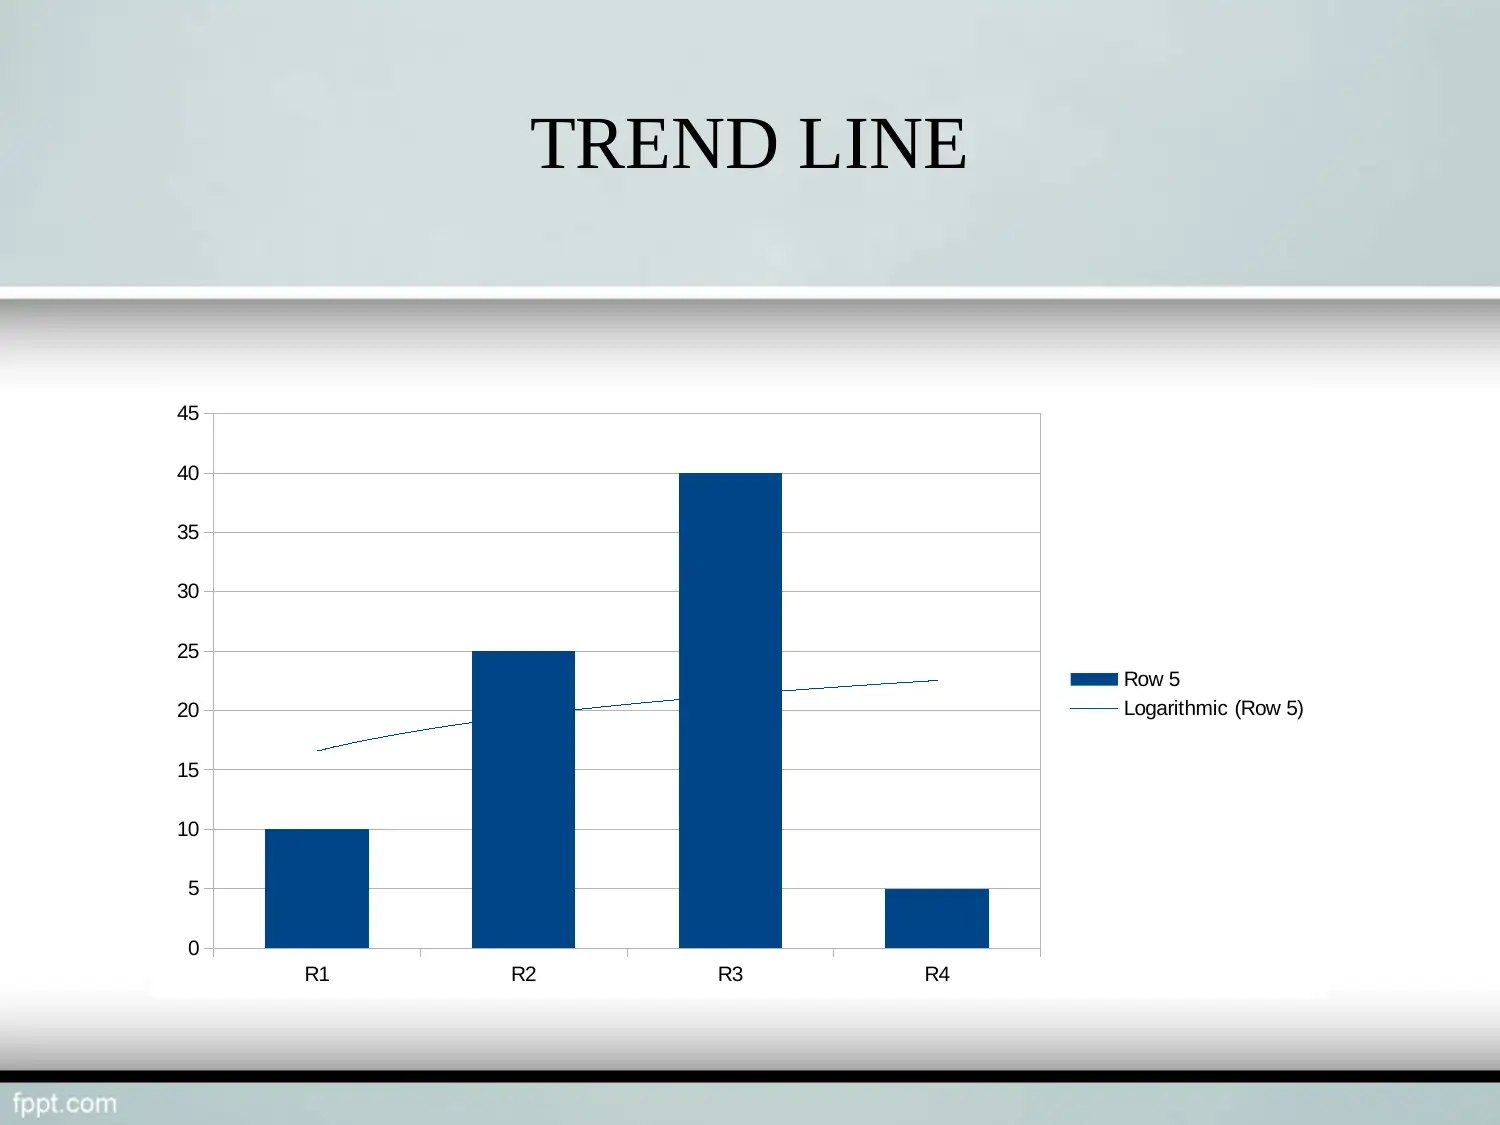
This assignment report focuses on business decision-making within the context of a restaurant chain's expansion plans. It begins by outlining the research methodology employed, which includes the use of both primary and secondary data collection methods. The report then presents and interprets data visualizations, such as pie charts and trend lines, to illustrate key findings related to customer preferences and market trends. The analysis includes an examination of customer satisfaction levels and the factors influencing their choices. Furthermore, the report provides a summary of the findings and concludes with a list of references to support the analysis and methodology used. The report aims to provide insights into the data-driven decision-making process for business expansion, specifically for the restaurant industry, highlighting how data analysis contributes to strategic planning and informed decision-making. The report is based on a real-world scenario and uses data visualization to present its findings, making it a valuable resource for students studying business decision-making.
Document Page
Business decision making
Task 3.3
tabler-icon-diamond-filled.svg

Paraphrase This Document

Need a fresh take? Get an instant paraphrase of this document with our AI Paraphraser
Document Page
COVER CONTENT
Introduction
Research Methodology
Trend line
Pie Chart
Findings
References
Document Page
INTRODUCTION
This Presentation is about restaurant of Murano which is
seeking to expand its restaurant chain at prime location of
UK. This presentation defines the facts and figures in
graphical form to elaborate. There are pie charts, grid lines
and trend lines are presented and interpreted.
Document Page
RESEARCH METHODOLOGY
There are different sampling theories and methodology
are defined to evaluate data and figures.
Primary data is taken to get collection of information in
direct way.
Secondary data are taken to take subsidiary records and
informations.
tabler-icon-diamond-filled.svg

Paraphrase This Document

Need a fresh take? Get an instant paraphrase of this document with our AI Paraphraser
Document Page
PIE CHART
Question 3
R1
R2
Document Page
TREND LINE
R1 R2 R3 R4
0
5
10
15
20
25
30
35
40
45
Row 5
Logarithmic (Row 5)
Document Page
FINDINGS
Customers seeks for quality foods and hygienic
atmosphere
Their trend line shows the variations of choosing different
destinations for Murano
Apart from it environment graph shows the level of
satisfaction in customers
tabler-icon-diamond-filled.svg

Paraphrase This Document

Need a fresh take? Get an instant paraphrase of this document with our AI Paraphraser
Document Page
REFERECNES
Vercellis, C., 2011. Business intelligence: data mining and optimization for
decision making. John Wiley & Sons.
Laudon, K.C. and Laudon, J.P., 2015. Management Information Systems:
Managing the Digital Firm Plus MyMISLab with Pearson eText--Access
Card Package. Prentice Hall Press.
Maxwell, A.L., Jeffrey, S.A. and Lévesque, M., 2011. Business angel early
stage decision making. Journal of Business Venturing. 26(2). pp.212-
225.
Document Page
THANK- YOU
chevron_up_icon
1 out of 9
circle_padding
hide_on_mobile
zoom_out_icon