Business Decision Making Report: Restaurant Chain Expansion Analysis

Verified

Added on  2023/03/20

|11
|695
|35
Report
AI Summary
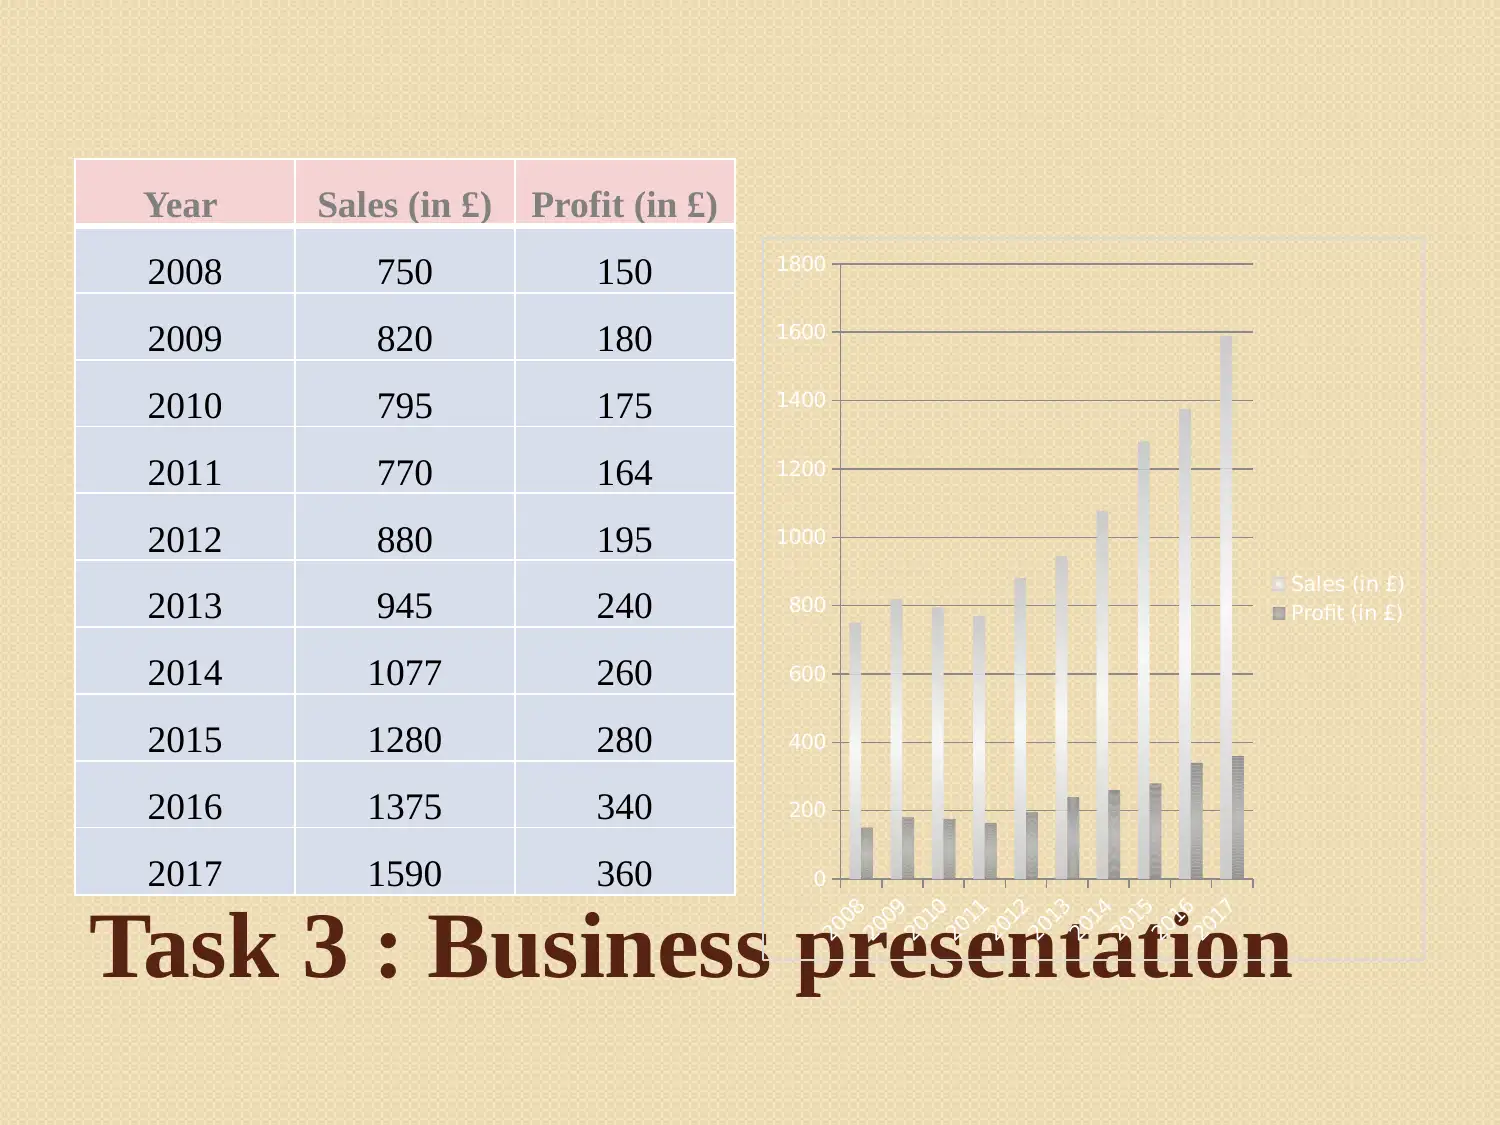
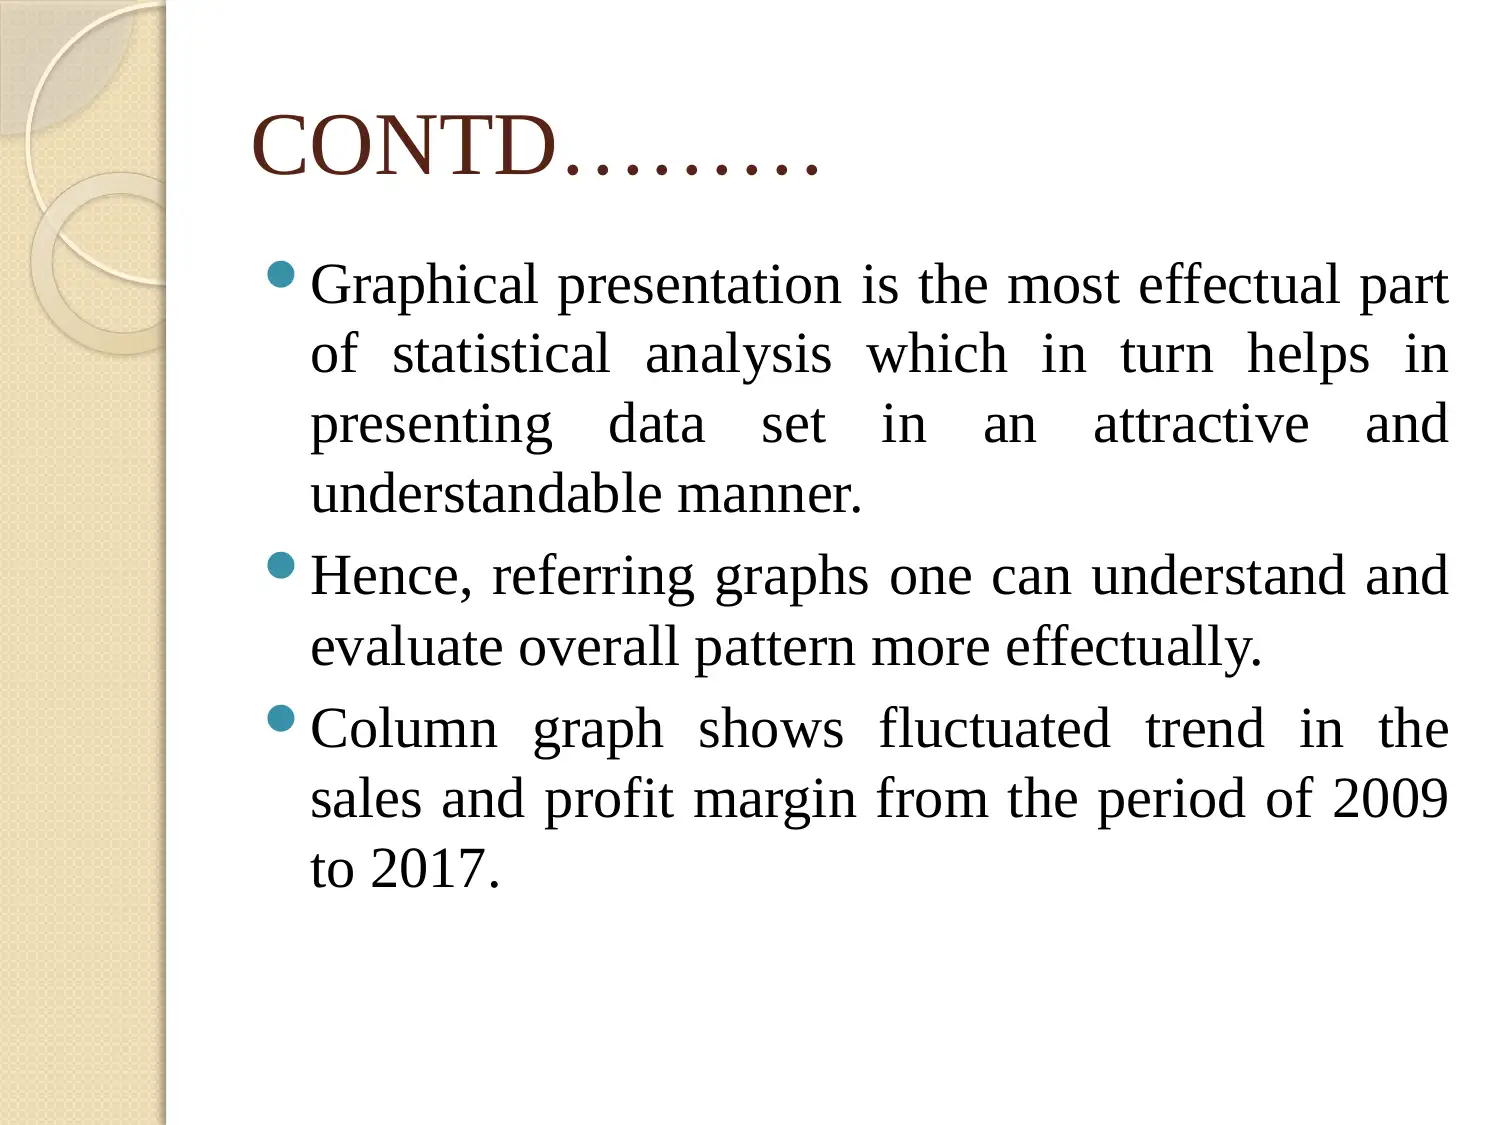
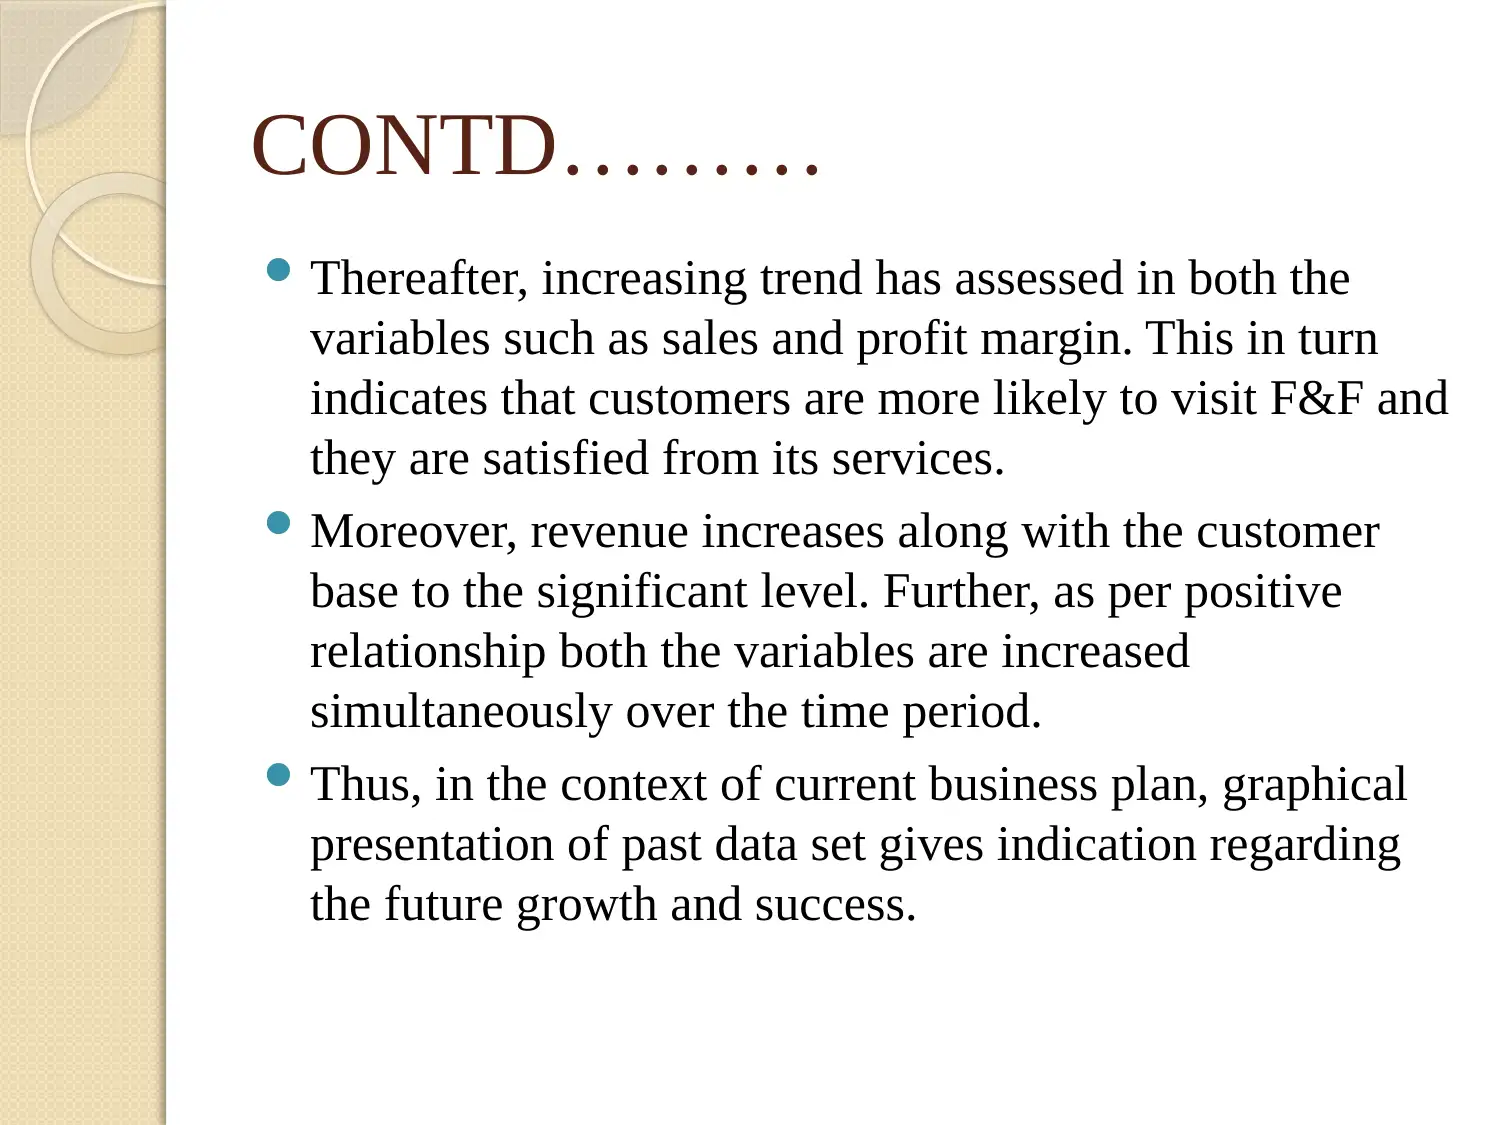
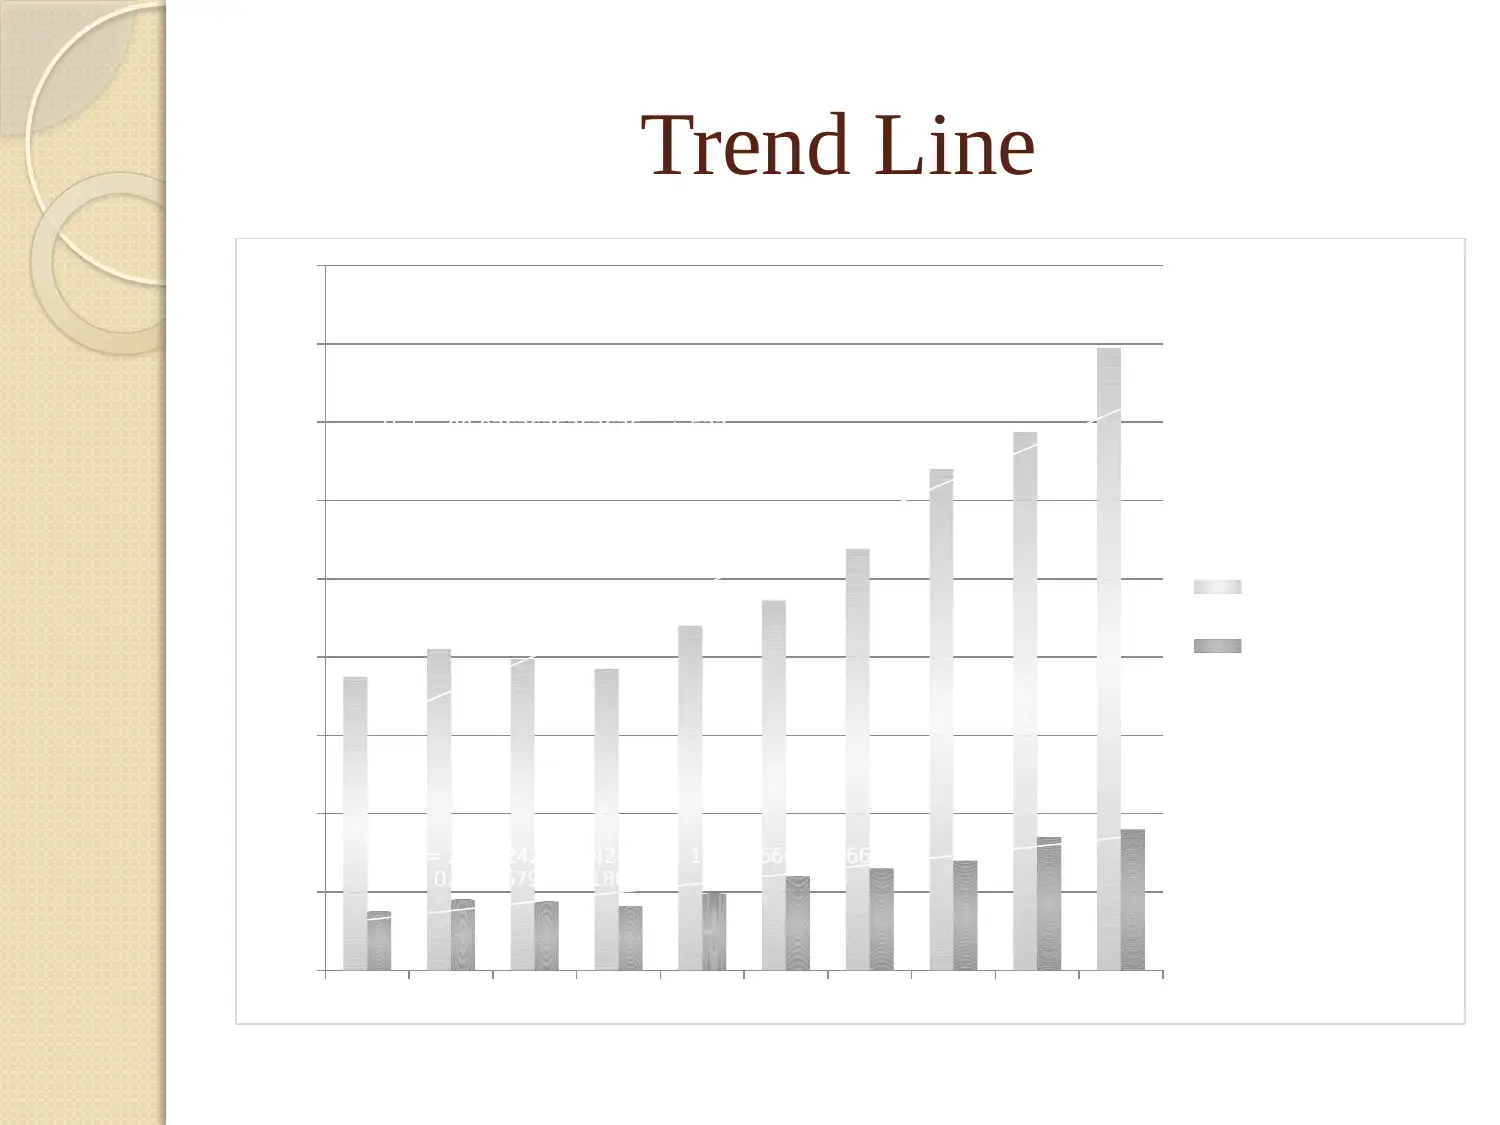
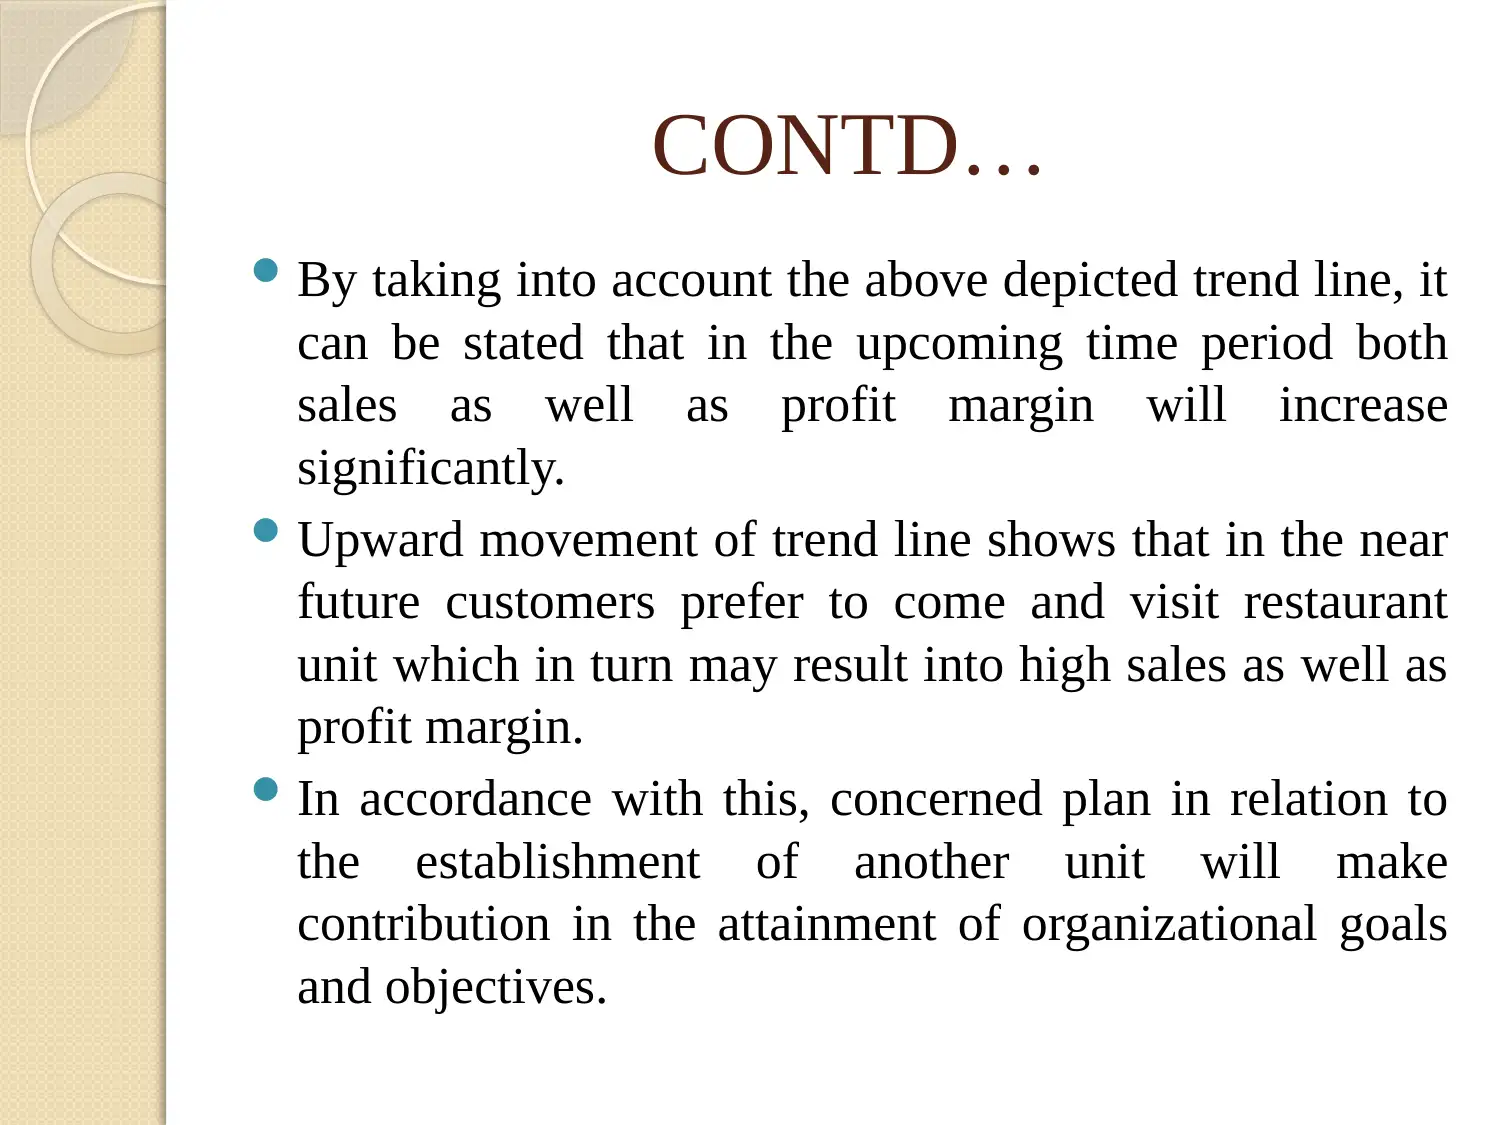
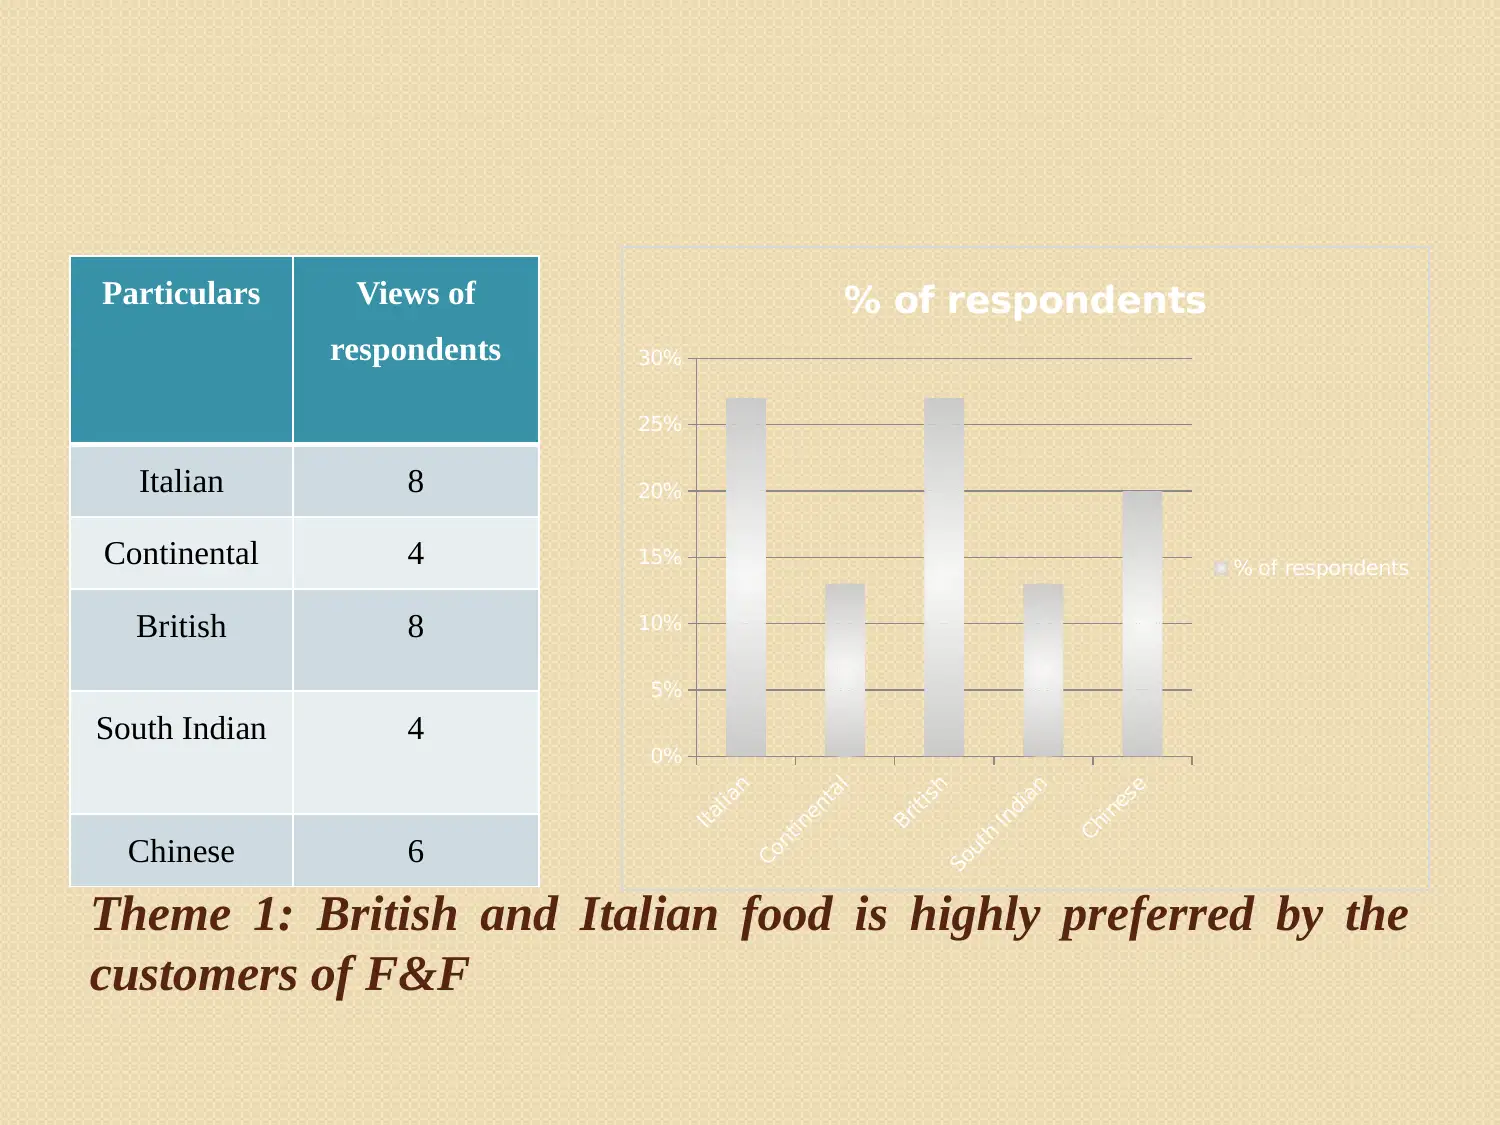
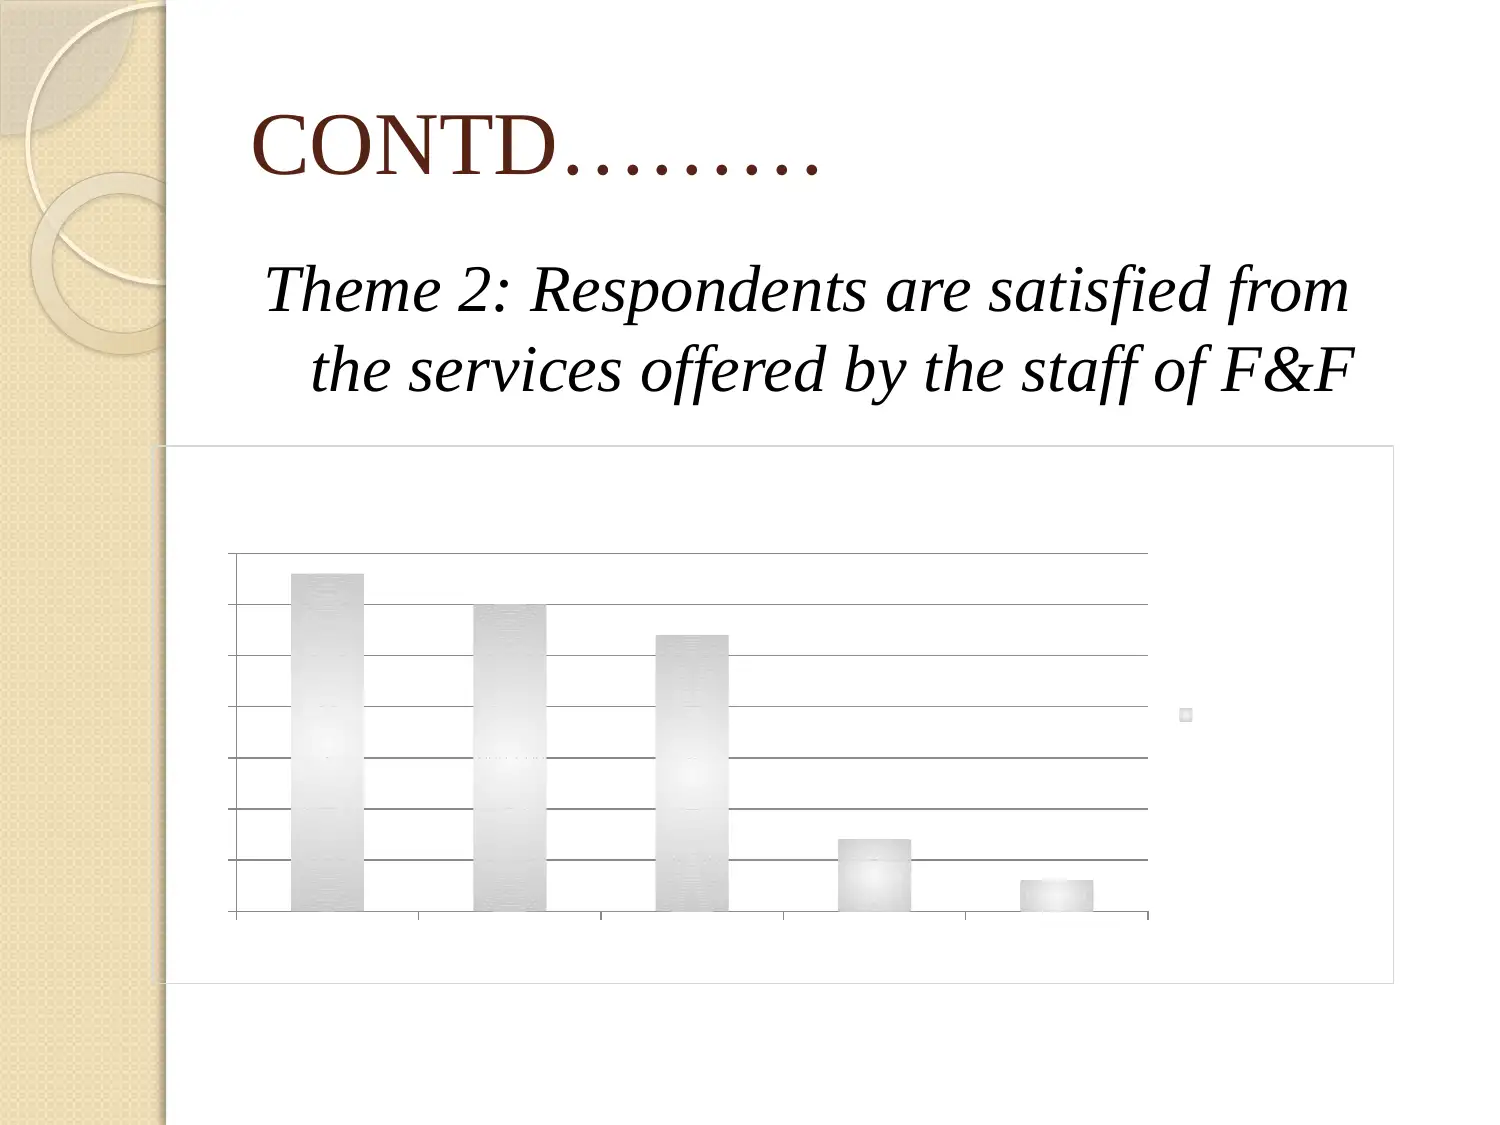
This report provides a comprehensive analysis of a restaurant chain's business decisions, focusing on sales and profit trends from 2008 to 2017. The analysis includes a graphical presentation of sales and profit margins, demonstrating fluctuating trends followed by an increasing pattern, indicating customer satisfaction and revenue growth. Trend line analysis projects future increases in sales and profit, supporting the plan for a second restaurant unit. Customer preference data reveals a strong preference for British and Italian food, with high satisfaction levels among staff. The report uses primary data assessment and references to support its findings. This report is a valuable resource for understanding business decision-making processes and strategies in the context of a restaurant chain's expansion plans.
Document Page
Business Decision Making
tabler-icon-diamond-filled.svg

Paraphrase This Document

Need a fresh take? Get an instant paraphrase of this document with our AI Paraphraser
Document Page
Task 3 : Business presentation
Year Sales (in £) Profit (in £)
2008 750 150
2009 820 180
2010 795 175
2011 770 164
2012 880 195
2013 945 240
2014 1077 260
2015 1280 280
2016 1375 340
2017 1590 360
2008
2009
2010
2011
2012
2013
2014
2015
2016
2017
0
200
400
600
800
1000
1200
1400
1600
1800
Sales (in £)
Profit (in £)
Document Page
CONTD………
Graphical presentation is the most effectual part
of statistical analysis which in turn helps in
presenting data set in an attractive and
understandable manner.
Hence, referring graphs one can understand and
evaluate overall pattern more effectually.
Column graph shows fluctuated trend in the
sales and profit margin from the period of 2009
to 2017.
Document Page
CONTD………
Thereafter, increasing trend has assessed in both the
variables such as sales and profit margin. This in turn
indicates that customers are more likely to visit F&F and
they are satisfied from its services.
Moreover, revenue increases along with the customer
base to the significant level. Further, as per positive
relationship both the variables are increased
simultaneously over the time period.
Thus, in the context of current business plan, graphical
presentation of past data set gives indication regarding
the future growth and success.
tabler-icon-diamond-filled.svg

Paraphrase This Document

Need a fresh take? Get an instant paraphrase of this document with our AI Paraphraser
Document Page
Trend Line
2008 2009 2010 2011 2012 2013 2014 2015 2016 2017
0
200
400
600
800
1000
1200
1400
1600
1800
f(x) = 90.0363636363636 x + 533
R² = 0.865914059206855
f(x) = 23.4424242424242 x + 105.466666666667
R² = 0.910167919731803
Sales (in £)
Linear (Sales (in £))
Profit (in £)
Linear (Profit (in £))
Document Page
CONTD…
By taking into account the above depicted trend line, it
can be stated that in the upcoming time period both
sales as well as profit margin will increase
significantly.
Upward movement of trend line shows that in the near
future customers prefer to come and visit restaurant
unit which in turn may result into high sales as well as
profit margin.
In accordance with this, concerned plan in relation to
the establishment of another unit will make
contribution in the attainment of organizational goals
and objectives.
Document Page
Theme 1: British and Italian food is highly preferred by the
customers of F&F
Particulars Views of
respondents
Italian 8
Continental 4
British 8
South Indian 4
Chinese 6
Italian
Continental
British
South Indian
Chinese
0%
5%
10%
15%
20%
25%
30%
% of respondents
% of respondents
tabler-icon-diamond-filled.svg

Paraphrase This Document

Need a fresh take? Get an instant paraphrase of this document with our AI Paraphraser
Document Page
CONTD………
Theme 2: Respondents are satisfied from
the services offered by the staff of F&F
Satisfied Highly satisfied Neither satisfied
nor dissatisfied
Dissatisfied Highly
dissatisfied
0%
5%
10%
15%
20%
25%
30%
35%
% of respondents
% of respondents
Document Page
CONTD………
Primary data assessment shows that 33%
customers are satisfied and other 30% falls into
the category of highly satisfied.
Hence, considering overall evaluation it can be
depicted that respondents are highly satisfied
from the skills and abilities of staff.
Document Page
REFERENCES
Johnston, M. P., 2017. Secondary data analysis: A
method of which the time has come. Qualitative and
quantitative methods in libraries. 3(3). pp.619-626.
Keum, J. and Coulibaly, P., 2017. Information theory‐
based decision support system for integrated design
of multivariable hydrometric networks. Water
Resources Research. 53(7). pp.6239-6259.
Le Tran, M. A. and et.al., 2017. Data Collection 1:
Observations and Document Analysis: Who's
looking?. In Qualitative Research and Intercultural
Understanding (pp. 38-47). Routledge.
tabler-icon-diamond-filled.svg

Paraphrase This Document

Need a fresh take? Get an instant paraphrase of this document with our AI Paraphraser
Document Page
chevron_up_icon
1 out of 11
circle_padding
hide_on_mobile
zoom_out_icon
[object Object]