Business Decision-Making Report: Analysis for Restaurant Expansion
VerifiedAdded on 2020/01/21
|24
|5229
|117
Report
AI Summary
This report provides a comprehensive analysis of business decision-making, focusing on a restaurant chain's potential expansion into London. The report begins with a detailed plan for collecting primary and secondary data, including survey methodology, sampling frames, and questionnaire design. It then delves into data analysis using representative values, measures of dispersion, and correlation coefficients to draw valid business conclusions. The assignment also covers graphical presentations using spreadsheets, trend line creation for forecasting, and the preparation of business presentations and reports. Furthermore, it explores the use of information processing and project management tools, including project planning and critical path determination, alongside financial tools for decision-making such as payback period, accounting rate of return, net present value, and internal rate of return. The report concludes with a summary of findings and recommendations, supported by relevant tables, illustrations, and references.
Business decision-making
1
1
Paraphrase This Document
Need a fresh take? Get an instant paraphrase of this document with our AI Paraphraser
Table of Contents
INTRODUCTION................................................................................................................................3
TASK 1.................................................................................................................................................3
1.1 Create a plan for primary and secondary data...........................................................................3
1.2 Survey methodology and sampling frame.................................................................................4
1.3 Design a questionnaire for given business problem..................................................................5
LO 2......................................................................................................................................................8
2.1 Create information for decisions-making by summarising data using representative values....8
2.2 Analyse the results to draw valid conclusions in business context..........................................11
2.3 Analyse data using measures of dispersion to inform business...............................................12
2.4 Explain how quartile. Percentile and correlation coefficient are used to draw useful
conclusion......................................................................................................................................12
TASK 2 ..............................................................................................................................................13
3.1 Produce graph using spreadsheet and draw valid conclusions based on the derived
information.....................................................................................................................................13
3.2 Create trend lines in spreadsheet graphs to assist in forecasting for specified business
information.....................................................................................................................................15
3.3 Prepare a business presentation using suitable software and techniques to disseminate
information effectively...................................................................................................................16
3.4 Prepare a formal business report..............................................................................................16
LO 4....................................................................................................................................................17
4.1 Use appropriate information processing tools.........................................................................17
4.2 Prepare a project plan for an activity and determine critical path...........................................17
.......................................................................................................................................................18
.......................................................................................................................................................18
4.3 Use financial tools for decision-making..................................................................................19
CONCLUSION..................................................................................................................................20
REFERENCES...................................................................................................................................21
Index of Tables
Table 1: Determination of critical path of the project........................................................................21
Table 2: Calculation of pay-back period ............................................................................................21
Table 3: Calculation of accounting rate of return ..............................................................................22
Table 4: Calculation of net present value and internal rate of return ................................................22
Illustration Index
Illustration 1: Sources of data collection .............................................................................................4
Illustration 2: Methods of sample selection .........................................................................................6
Illustration 3: Previous 10 year's sales and profit of restaurant..........................................................12
Illustration 4: Descriptive statistics of sales and profit .....................................................................12
Illustration 5: Formula of standard deviation and variance................................................................13
Illustration 6: Correlation ..................................................................................................................14
Illustration 7: Column graph of sales an profit ..................................................................................15
Illustration 8: Line graph of sales and profit .....................................................................................16
Illustration 9: Bar graph of sales and profit .......................................................................................17
Illustration 10: Trend line of sales and profit ....................................................................................18
Illustration 11: Project plan to open second restaurant in London.....................................................19
2
Illustration 12: Gantt chart to open new restaurant in London...........................................................20
Illustration 13: Network diagram of new restaurant's project............................................................21
3
Illustration 13: Network diagram of new restaurant's project............................................................21
3
⊘ This is a preview!⊘
Do you want full access?
Subscribe today to unlock all pages.
Trusted by 1+ million students worldwide
INTRODUCTION
In all the business organizations, managers are responsible to govern business operations
and take decisions to improve potential performance. Decisions-making is the cognitive process
through which the most effective course of action can be selected among several alternative
possibilities. In the present report, a restaurant chain planned to open its second restaurant in
London. In order to assess the viability of such expansion program, this assignment will focus on
gathering data from both primary and secondary sources and analyse it by various statistical tools
and techniques and graphical presentation as well. Along with this, capital budgeting tools will be
used to identify most viable capital project. Besides this, the role of management information
system to record huge quantity of data and project management tools will be undertaken to
accomplish project within set time.
TASK 1
LO 1
1.1 Create a plan for primary and secondary data
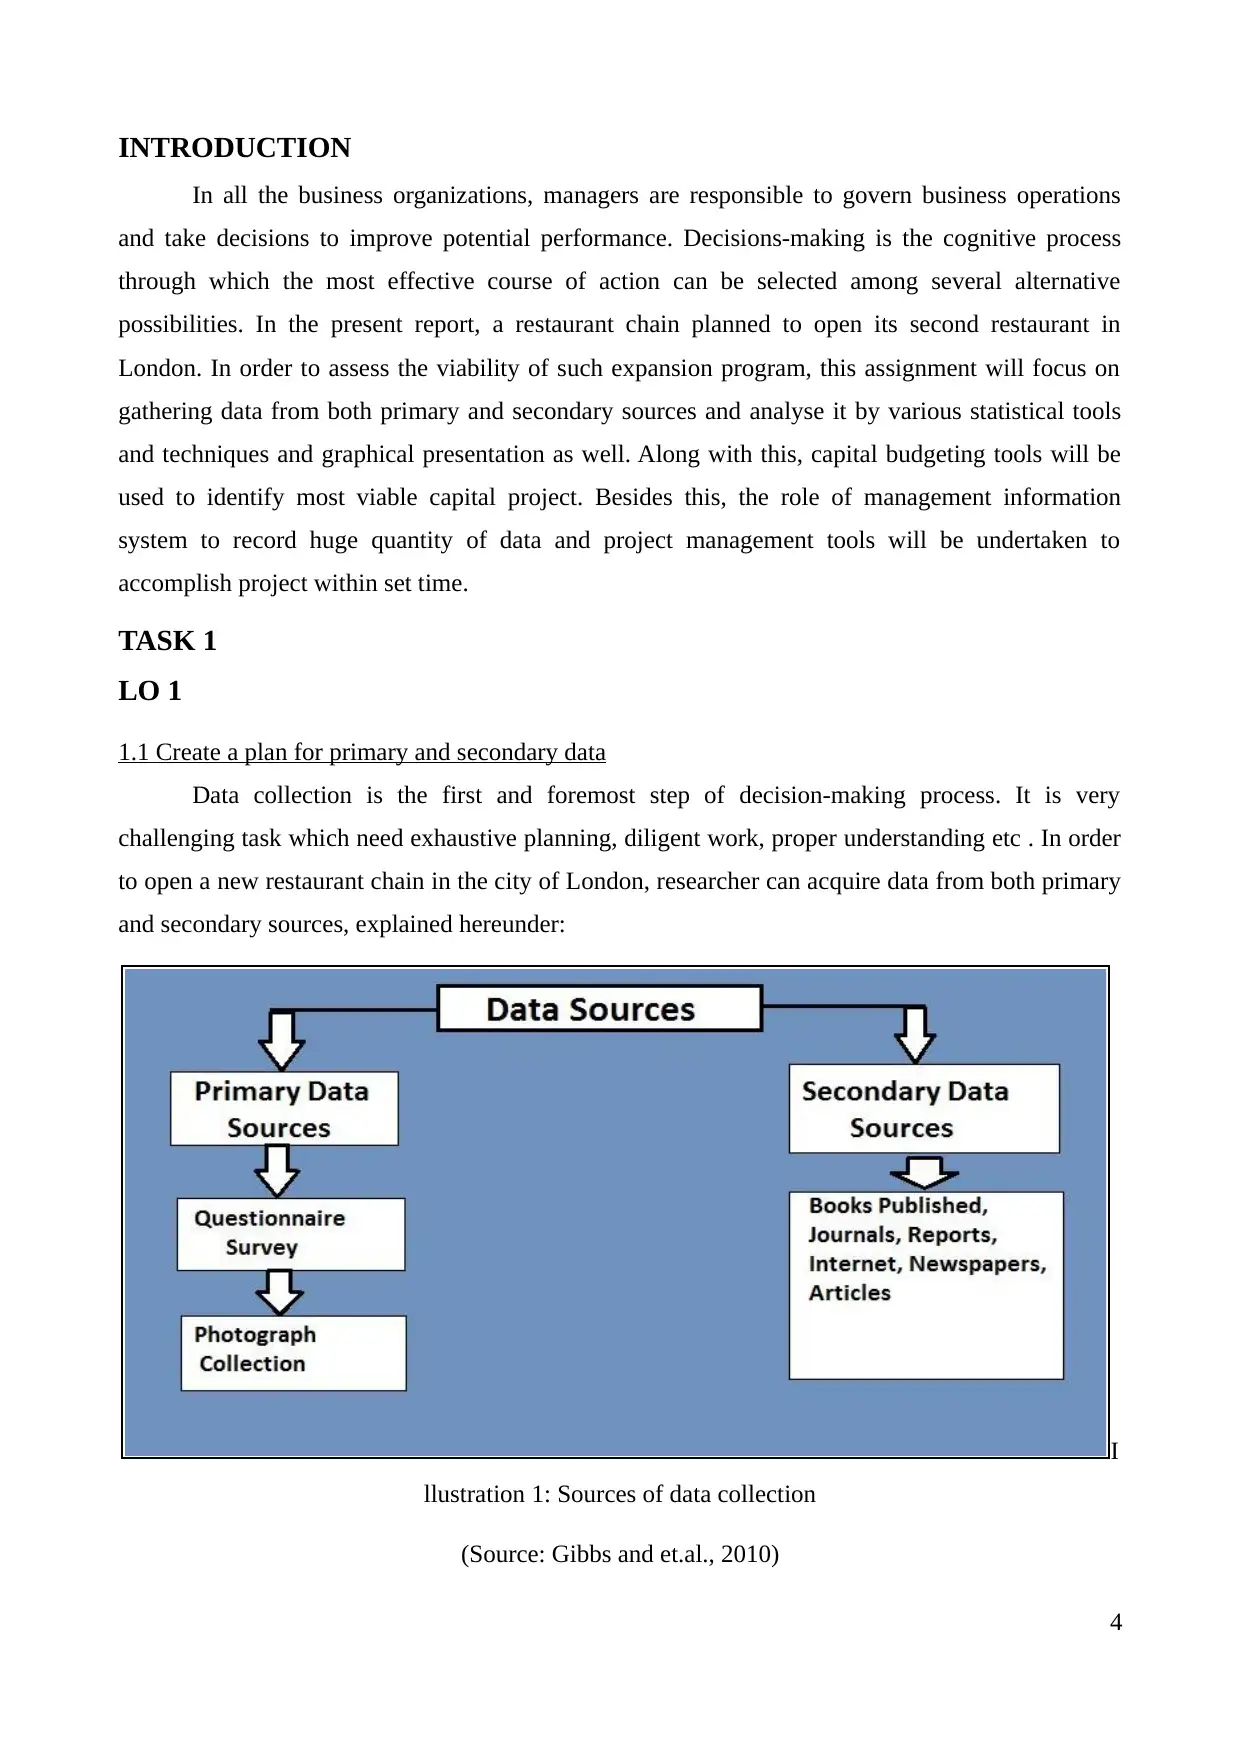
Data collection is the first and foremost step of decision-making process. It is very
challenging task which need exhaustive planning, diligent work, proper understanding etc . In order
to open a new restaurant chain in the city of London, researcher can acquire data from both primary
and secondary sources, explained hereunder:
I
llustration 1: Sources of data collection
(Source: Gibbs and et.al., 2010)
4
In all the business organizations, managers are responsible to govern business operations
and take decisions to improve potential performance. Decisions-making is the cognitive process
through which the most effective course of action can be selected among several alternative
possibilities. In the present report, a restaurant chain planned to open its second restaurant in
London. In order to assess the viability of such expansion program, this assignment will focus on
gathering data from both primary and secondary sources and analyse it by various statistical tools
and techniques and graphical presentation as well. Along with this, capital budgeting tools will be
used to identify most viable capital project. Besides this, the role of management information
system to record huge quantity of data and project management tools will be undertaken to
accomplish project within set time.
TASK 1
LO 1
1.1 Create a plan for primary and secondary data
Data collection is the first and foremost step of decision-making process. It is very
challenging task which need exhaustive planning, diligent work, proper understanding etc . In order
to open a new restaurant chain in the city of London, researcher can acquire data from both primary
and secondary sources, explained hereunder:
I
llustration 1: Sources of data collection
(Source: Gibbs and et.al., 2010)
4
Paraphrase This Document
Need a fresh take? Get an instant paraphrase of this document with our AI Paraphraser
Primary sources:
This sources provide new and authentic information that is particularly associated with
research goals and objectives (Polkinghorne, 2005). Following techniques are available to gather
primary information, given below:
◦ Observation
◦ Interviews
◦ Experiments
◦ Focus group
◦ Surveys
With regards to restaurant, survey of selected sample will be conducted through the use of
web-questionnaire. It will helps to assess customer taste, preferences, buying habits, price
sensitivity etc. Henceforth, it will make researcher able to open new restaurant according to the
consumers preferences.
Secondary sources:
It is second hand information which has been collected previously by any other person for
his or her research goal (Reynolds and et.al., 2005). Both internal and external sources are available
to the restaurant chain to obtain secondary information that are given below:
Internal sources External sources
Past financial statements of restaurant
chain
Governmental reports
Sales record Trade journals
Inventory reports Economic reports
Profit records Media, newspapers, telcasts
Internet
Articles
With reference to present research, internal data will be generated about sales and profit
figures over last few years whilst secondary data will be gather from web sources (Gibbs and et.al.,
2010). Secondary sources of data collection technique take less time and resources as compare to
primary sources.
1.2 Survey methodology and sampling frame
Survey methodology: It is the process of studying only the selected sample size from the universe.
Survey is a primary techniques of data collection in which research can gather required information
through direct or indirectly communicating with the affected parties like consumers (Matthews and
Ross, 2014). In present report, consumer survey will be undertaken by constructing questionnaire. It
5
comprises different set of questions like open-ended, close-ended, ranking etc. to obtain needed
information. The most important benefit of this is it enhance the accuracy and reliability of data.
With the assistance of this, restaurant can assess consumer's demand and perceptions towards taking
meal out so that, they can make logical selection for its proposed expansion.
Sampling frame:
Study the universe is not possible due to its complexity. Henceforth, all the researcher often
use sampling frame to select an appropriate size of sample by taking into consideration all the
characteristics of the population (Malhotra, 2012). Through this, restaurant will be able to conduct
survey of sample and analyse it to assess overall population of London.
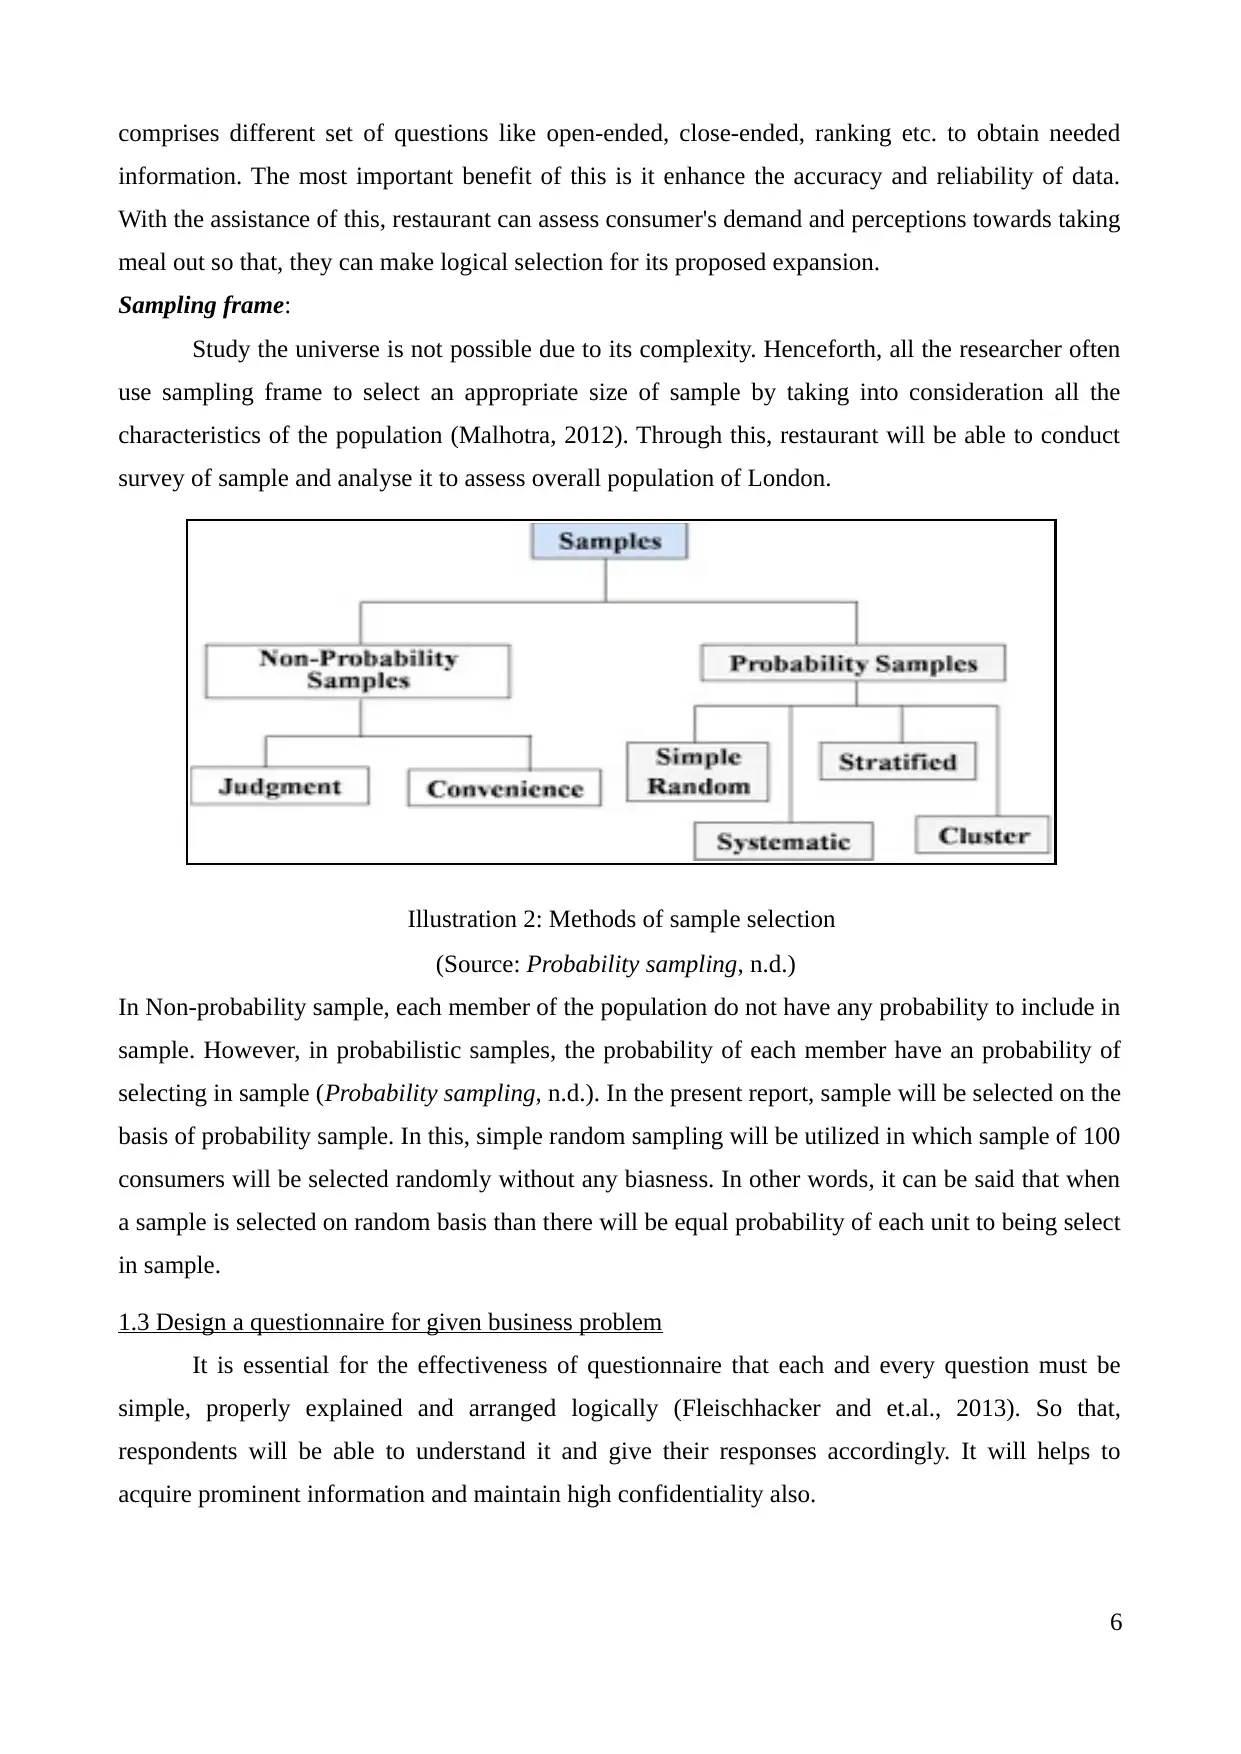
Illustration 2: Methods of sample selection
(Source: Probability sampling, n.d.)
In Non-probability sample, each member of the population do not have any probability to include in
sample. However, in probabilistic samples, the probability of each member have an probability of
selecting in sample (Probability sampling, n.d.). In the present report, sample will be selected on the
basis of probability sample. In this, simple random sampling will be utilized in which sample of 100
consumers will be selected randomly without any biasness. In other words, it can be said that when
a sample is selected on random basis than there will be equal probability of each unit to being select
in sample.
1.3 Design a questionnaire for given business problem
It is essential for the effectiveness of questionnaire that each and every question must be
simple, properly explained and arranged logically (Fleischhacker and et.al., 2013). So that,
respondents will be able to understand it and give their responses accordingly. It will helps to
acquire prominent information and maintain high confidentiality also.
6
information. The most important benefit of this is it enhance the accuracy and reliability of data.
With the assistance of this, restaurant can assess consumer's demand and perceptions towards taking
meal out so that, they can make logical selection for its proposed expansion.
Sampling frame:
Study the universe is not possible due to its complexity. Henceforth, all the researcher often
use sampling frame to select an appropriate size of sample by taking into consideration all the
characteristics of the population (Malhotra, 2012). Through this, restaurant will be able to conduct
survey of sample and analyse it to assess overall population of London.
Illustration 2: Methods of sample selection
(Source: Probability sampling, n.d.)
In Non-probability sample, each member of the population do not have any probability to include in
sample. However, in probabilistic samples, the probability of each member have an probability of
selecting in sample (Probability sampling, n.d.). In the present report, sample will be selected on the
basis of probability sample. In this, simple random sampling will be utilized in which sample of 100
consumers will be selected randomly without any biasness. In other words, it can be said that when
a sample is selected on random basis than there will be equal probability of each unit to being select
in sample.
1.3 Design a questionnaire for given business problem
It is essential for the effectiveness of questionnaire that each and every question must be
simple, properly explained and arranged logically (Fleischhacker and et.al., 2013). So that,
respondents will be able to understand it and give their responses accordingly. It will helps to
acquire prominent information and maintain high confidentiality also.
6
⊘ This is a preview!⊘
Do you want full access?
Subscribe today to unlock all pages.
Trusted by 1+ million students worldwide
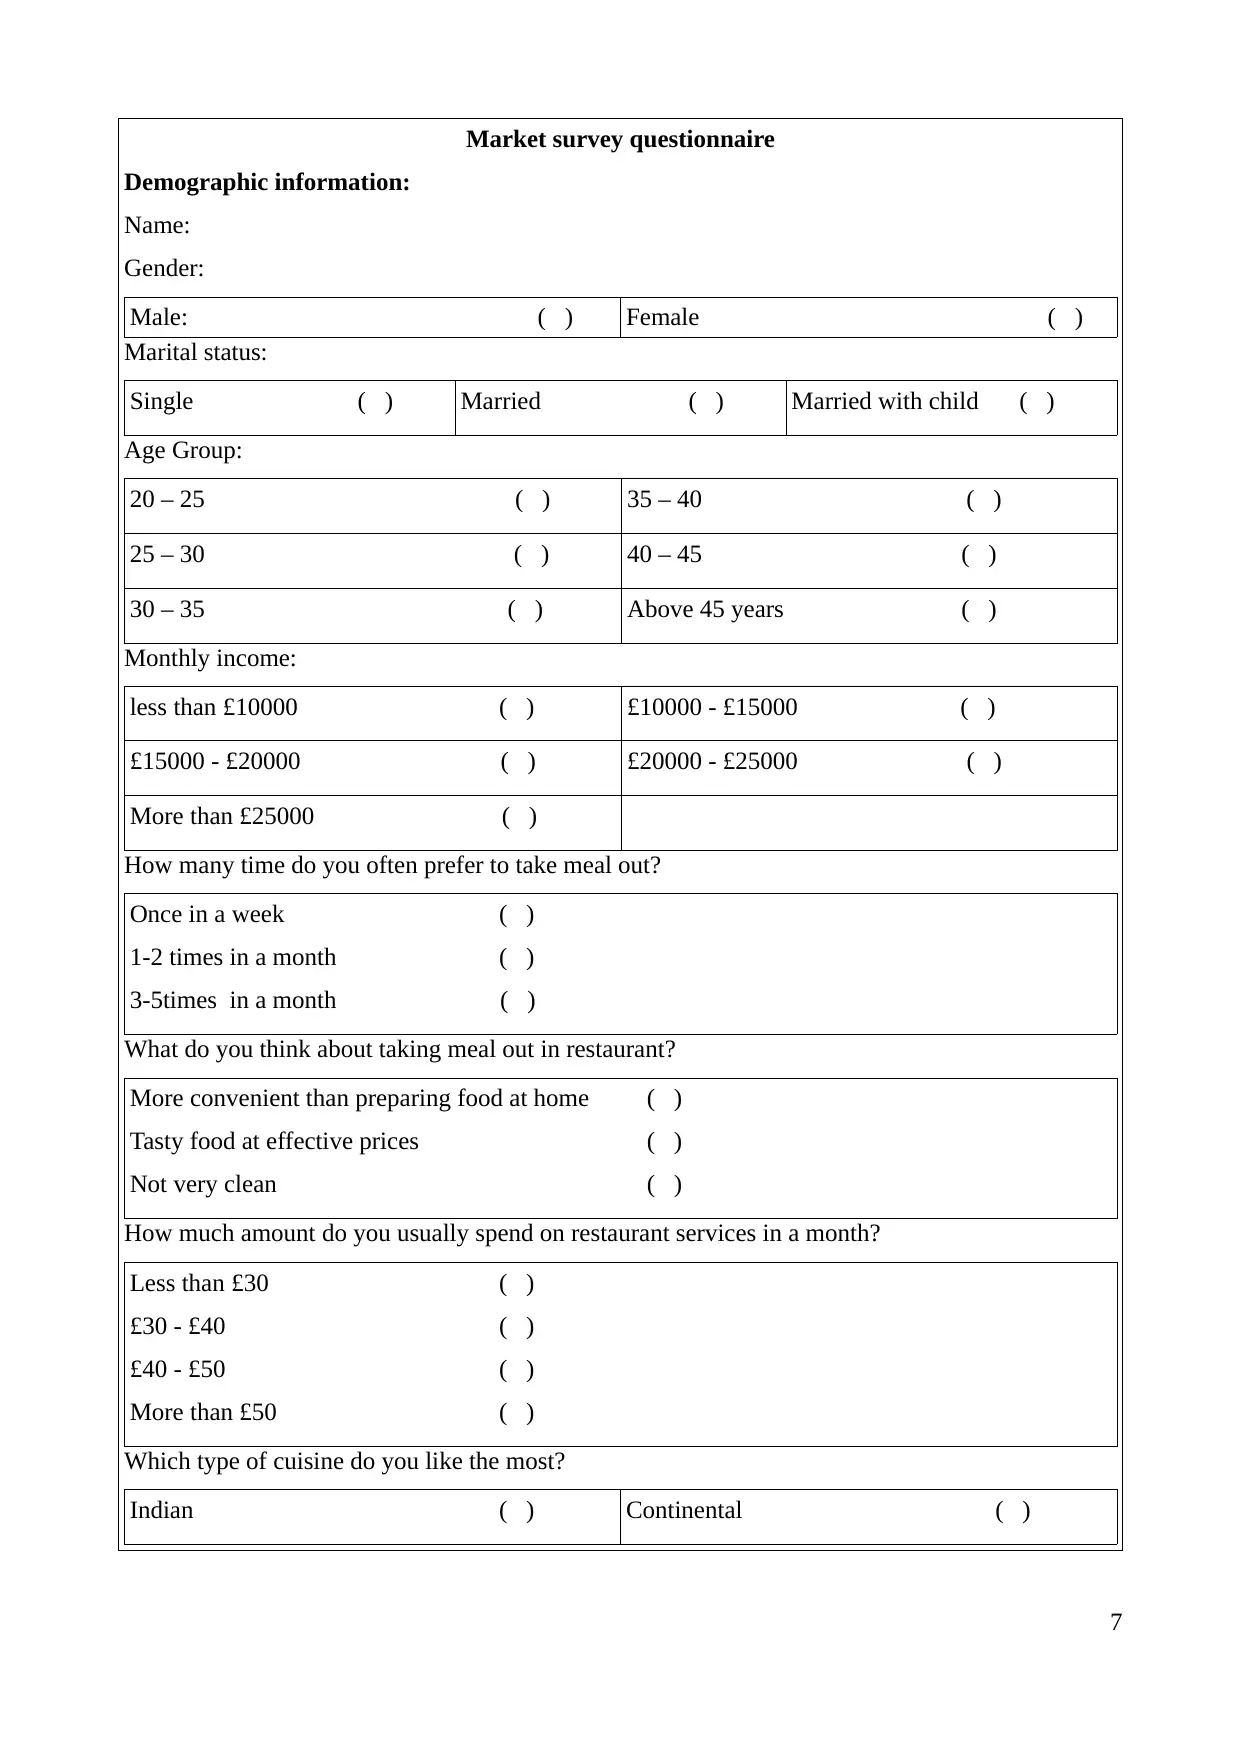
Market survey questionnaire
Demographic information:
Name:
Gender:
Male: ( ) Female ( )
Marital status:
Single ( ) Married ( ) Married with child ( )
Age Group:
20 – 25 ( ) 35 – 40 ( )
25 – 30 ( ) 40 – 45 ( )
30 – 35 ( ) Above 45 years ( )
Monthly income:
less than £10000 ( ) £10000 - £15000 ( )
£15000 - £20000 ( ) £20000 - £25000 ( )
More than £25000 ( )
How many time do you often prefer to take meal out?
Once in a week ( )
1-2 times in a month ( )
3-5times in a month ( )
What do you think about taking meal out in restaurant?
More convenient than preparing food at home ( )
Tasty food at effective prices ( )
Not very clean ( )
How much amount do you usually spend on restaurant services in a month?
Less than £30 ( )
£30 - £40 ( )
£40 - £50 ( )
More than £50 ( )
Which type of cuisine do you like the most?
Indian ( ) Continental ( )
7
Paraphrase This Document
Need a fresh take? Get an instant paraphrase of this document with our AI Paraphraser
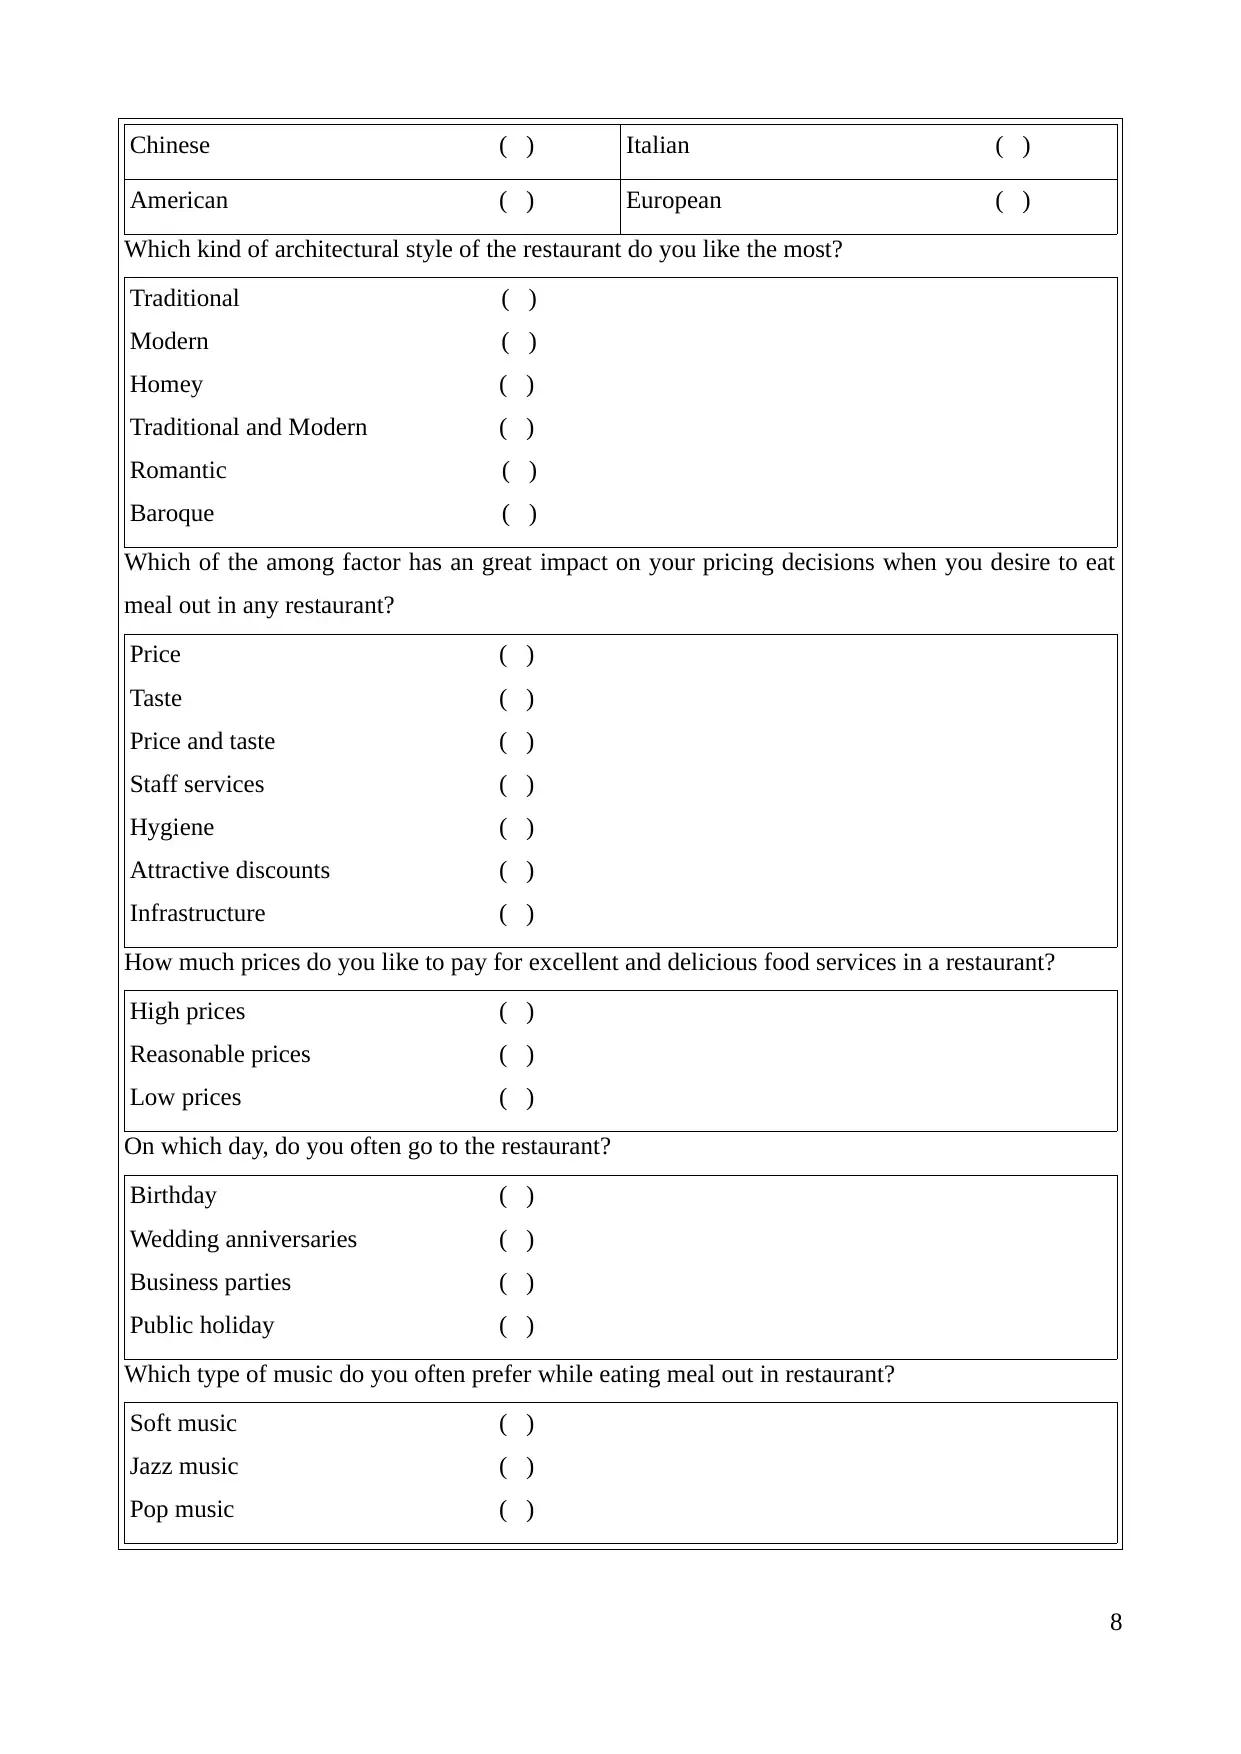
Chinese ( ) Italian ( )
American ( ) European ( )
Which kind of architectural style of the restaurant do you like the most?
Traditional ( )
Modern ( )
Homey ( )
Traditional and Modern ( )
Romantic ( )
Baroque ( )
Which of the among factor has an great impact on your pricing decisions when you desire to eat
meal out in any restaurant?
Price ( )
Taste ( )
Price and taste ( )
Staff services ( )
Hygiene ( )
Attractive discounts ( )
Infrastructure ( )
How much prices do you like to pay for excellent and delicious food services in a restaurant?
High prices ( )
Reasonable prices ( )
Low prices ( )
On which day, do you often go to the restaurant?
Birthday ( )
Wedding anniversaries ( )
Business parties ( )
Public holiday ( )
Which type of music do you often prefer while eating meal out in restaurant?
Soft music ( )
Jazz music ( )
Pop music ( )
8
Please recommend ways to enhance level of customer satisfaction in a restaurant.
-----------------------------------------------------------------------------------------------------------------
Thank you for giving your responses
LO 2
2.1 Create information for decisions-making by summarising data using representative values
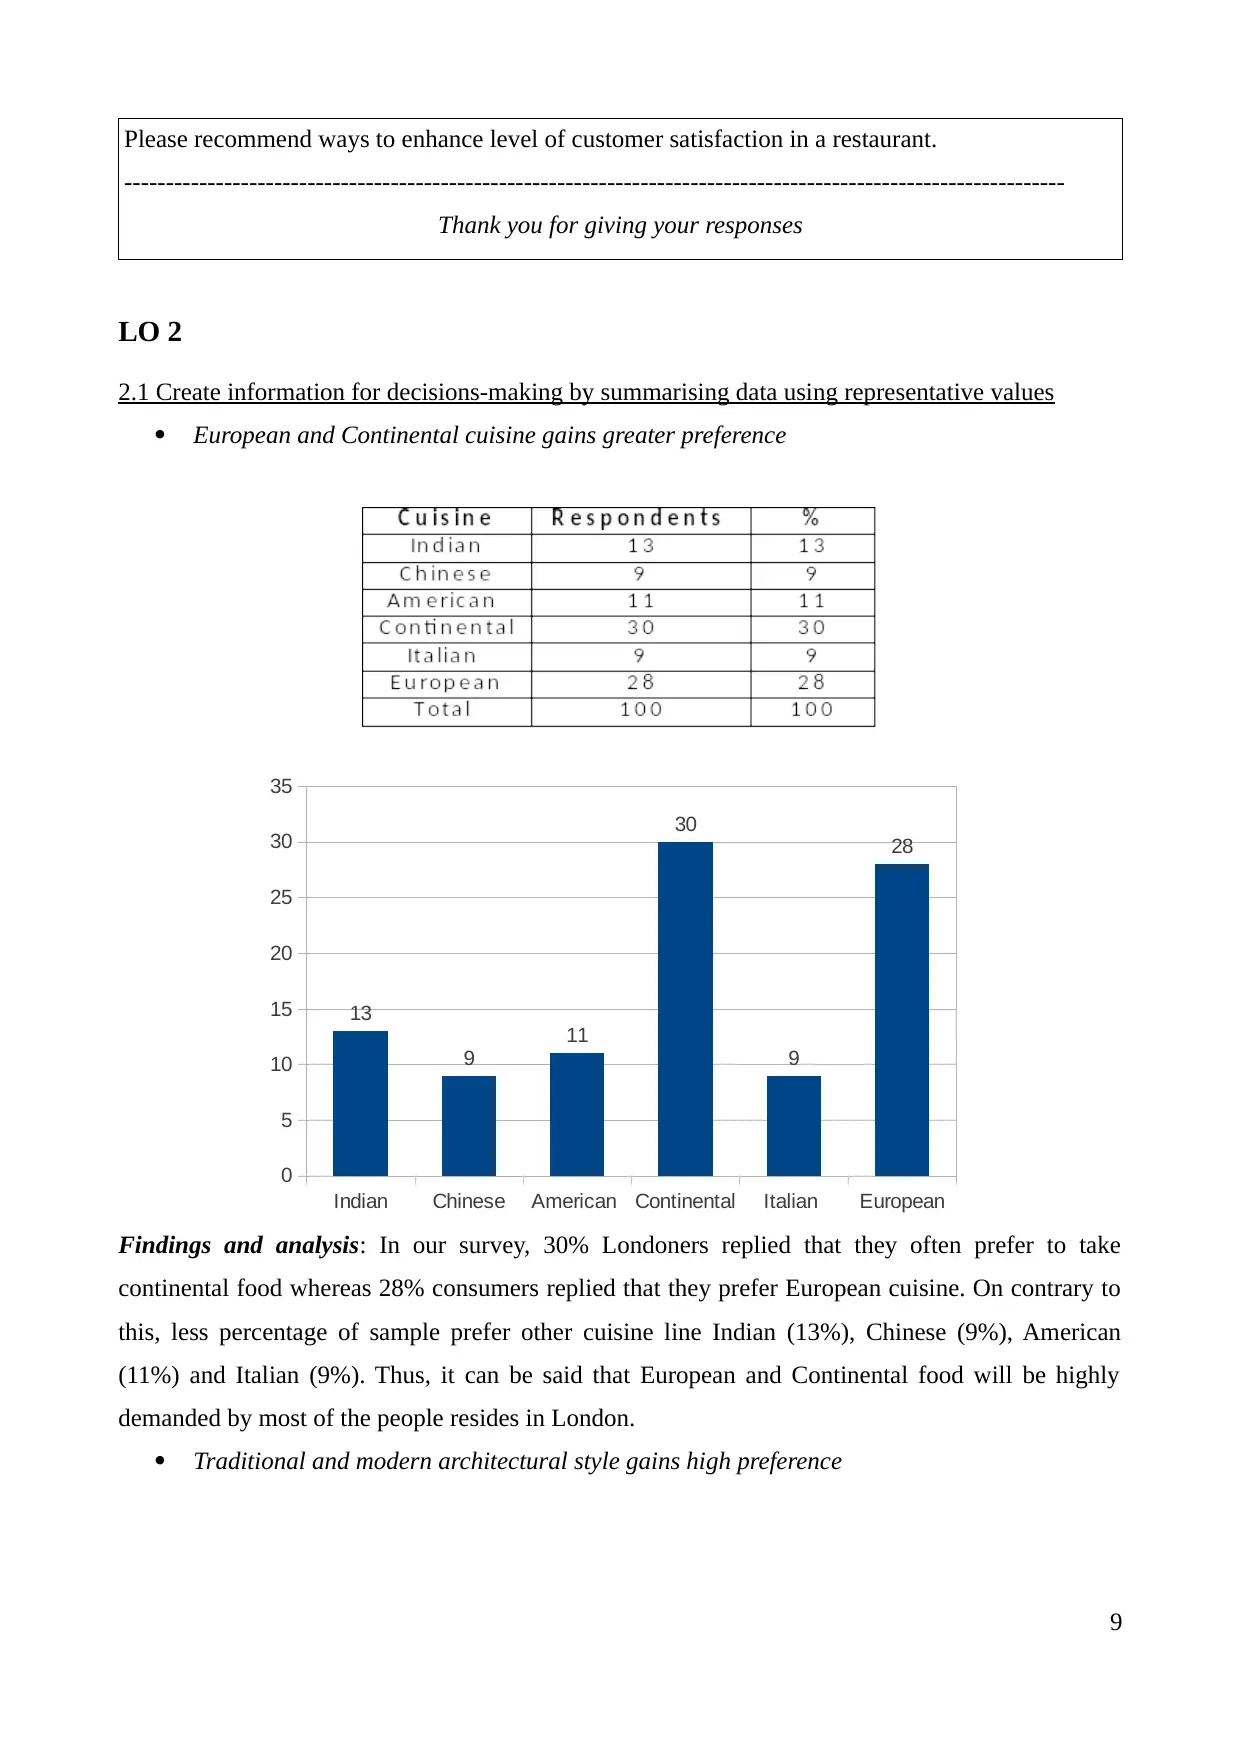
European and Continental cuisine gains greater preference
Findings and analysis: In our survey, 30% Londoners replied that they often prefer to take
continental food whereas 28% consumers replied that they prefer European cuisine. On contrary to
this, less percentage of sample prefer other cuisine line Indian (13%), Chinese (9%), American
(11%) and Italian (9%). Thus, it can be said that European and Continental food will be highly
demanded by most of the people resides in London.
Traditional and modern architectural style gains high preference
9
Indian Chinese American Continental Italian European
0
5
10
15
20
25
30
35
13
9
11
30
9
28
-----------------------------------------------------------------------------------------------------------------
Thank you for giving your responses
LO 2
2.1 Create information for decisions-making by summarising data using representative values
European and Continental cuisine gains greater preference
Findings and analysis: In our survey, 30% Londoners replied that they often prefer to take
continental food whereas 28% consumers replied that they prefer European cuisine. On contrary to
this, less percentage of sample prefer other cuisine line Indian (13%), Chinese (9%), American
(11%) and Italian (9%). Thus, it can be said that European and Continental food will be highly
demanded by most of the people resides in London.
Traditional and modern architectural style gains high preference
9
Indian Chinese American Continental Italian European
0
5
10
15
20
25
30
35
13
9
11
30
9
28
⊘ This is a preview!⊘
Do you want full access?
Subscribe today to unlock all pages.
Trusted by 1+ million students worldwide
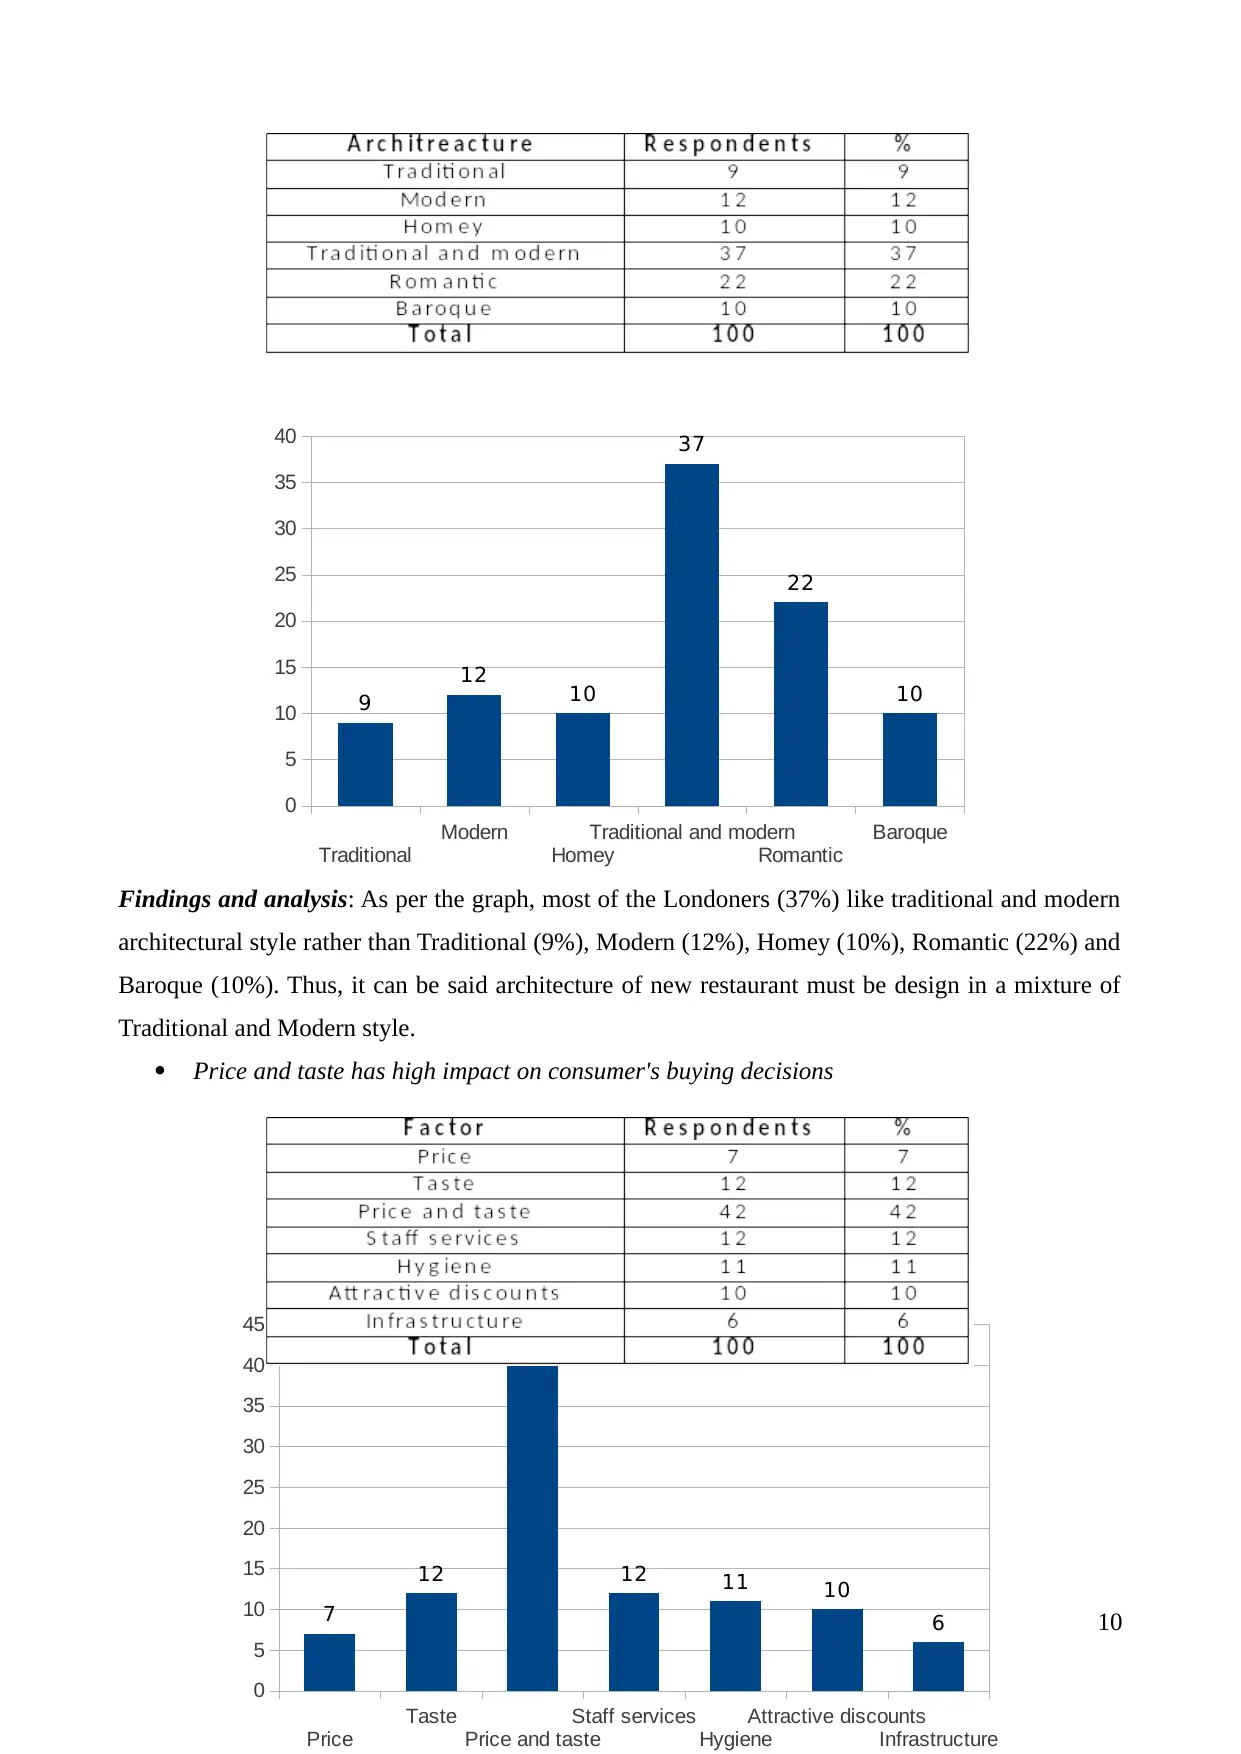
Findings and analysis: As per the graph, most of the Londoners (37%) like traditional and modern
architectural style rather than Traditional (9%), Modern (12%), Homey (10%), Romantic (22%) and
Baroque (10%). Thus, it can be said architecture of new restaurant must be design in a mixture of
Traditional and Modern style.
Price and taste has high impact on consumer's buying decisions
10
Traditional
Modern
Homey
Traditional and modern
Romantic
Baroque
0
5
10
15
20
25
30
35
40
9
12 10
37
22
10
Price
Taste
Price and taste
Staff services
Hygiene
Attractive discounts
Infrastructure
0
5
10
15
20
25
30
35
40
45
7
12
42
12 11 10
6
Paraphrase This Document
Need a fresh take? Get an instant paraphrase of this document with our AI Paraphraser
Findings and analysis: Above graph reflects that 42% of the sample replied that both price and
taste gains equal importance and affect their buying decisions to a great extent. On contrary to this,
factors like only price, taste, personnel service, discounts, hygiene and infrastructure gains less
importance over price and taste. So that, it can be said that new food outlet should be based on
quality products at reasonable prices.
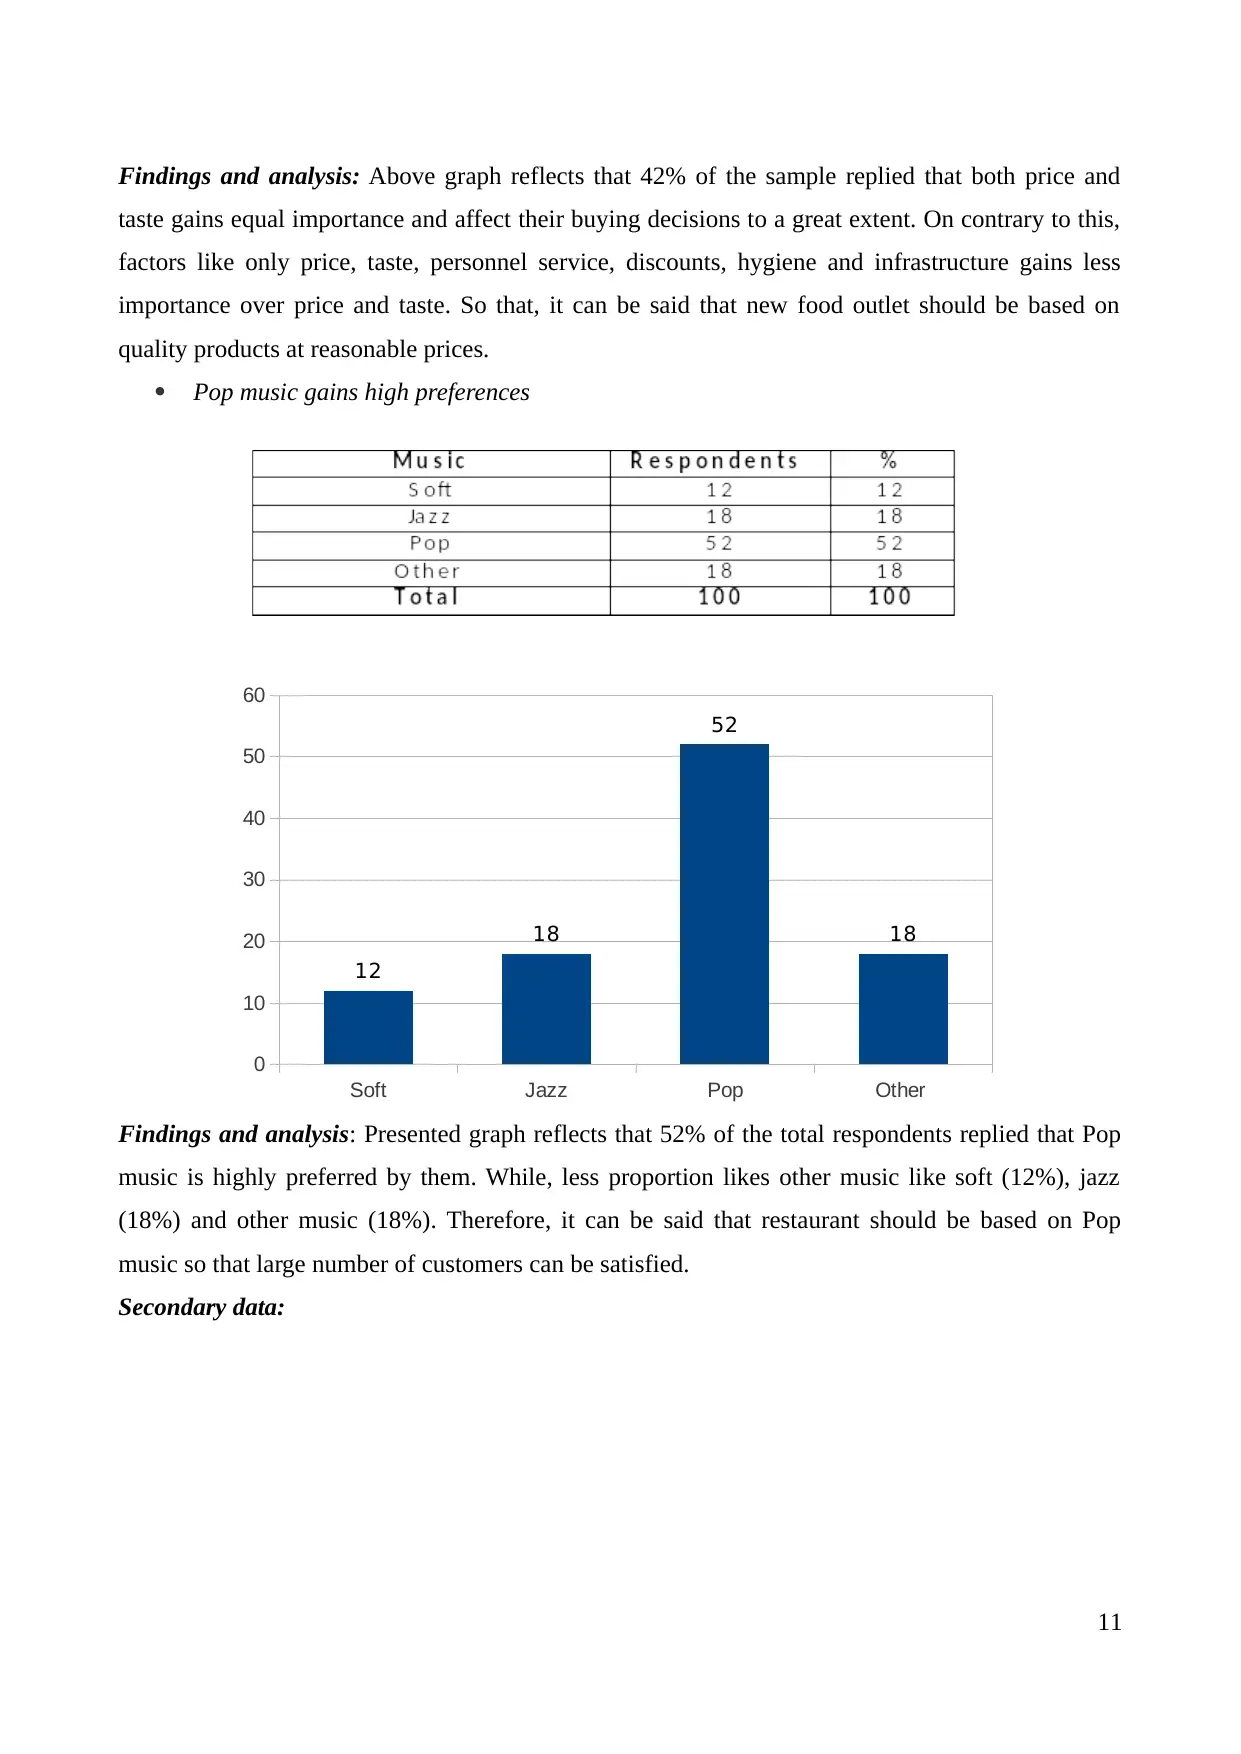
Pop music gains high preferences
Findings and analysis: Presented graph reflects that 52% of the total respondents replied that Pop
music is highly preferred by them. While, less proportion likes other music like soft (12%), jazz
(18%) and other music (18%). Therefore, it can be said that restaurant should be based on Pop
music so that large number of customers can be satisfied.
Secondary data:
11
Soft Jazz Pop Other
0
10
20
30
40
50
60
12
18
52
18
taste gains equal importance and affect their buying decisions to a great extent. On contrary to this,
factors like only price, taste, personnel service, discounts, hygiene and infrastructure gains less
importance over price and taste. So that, it can be said that new food outlet should be based on
quality products at reasonable prices.
Pop music gains high preferences
Findings and analysis: Presented graph reflects that 52% of the total respondents replied that Pop
music is highly preferred by them. While, less proportion likes other music like soft (12%), jazz
(18%) and other music (18%). Therefore, it can be said that restaurant should be based on Pop
music so that large number of customers can be satisfied.
Secondary data:
11
Soft Jazz Pop Other
0
10
20
30
40
50
60
12
18
52
18
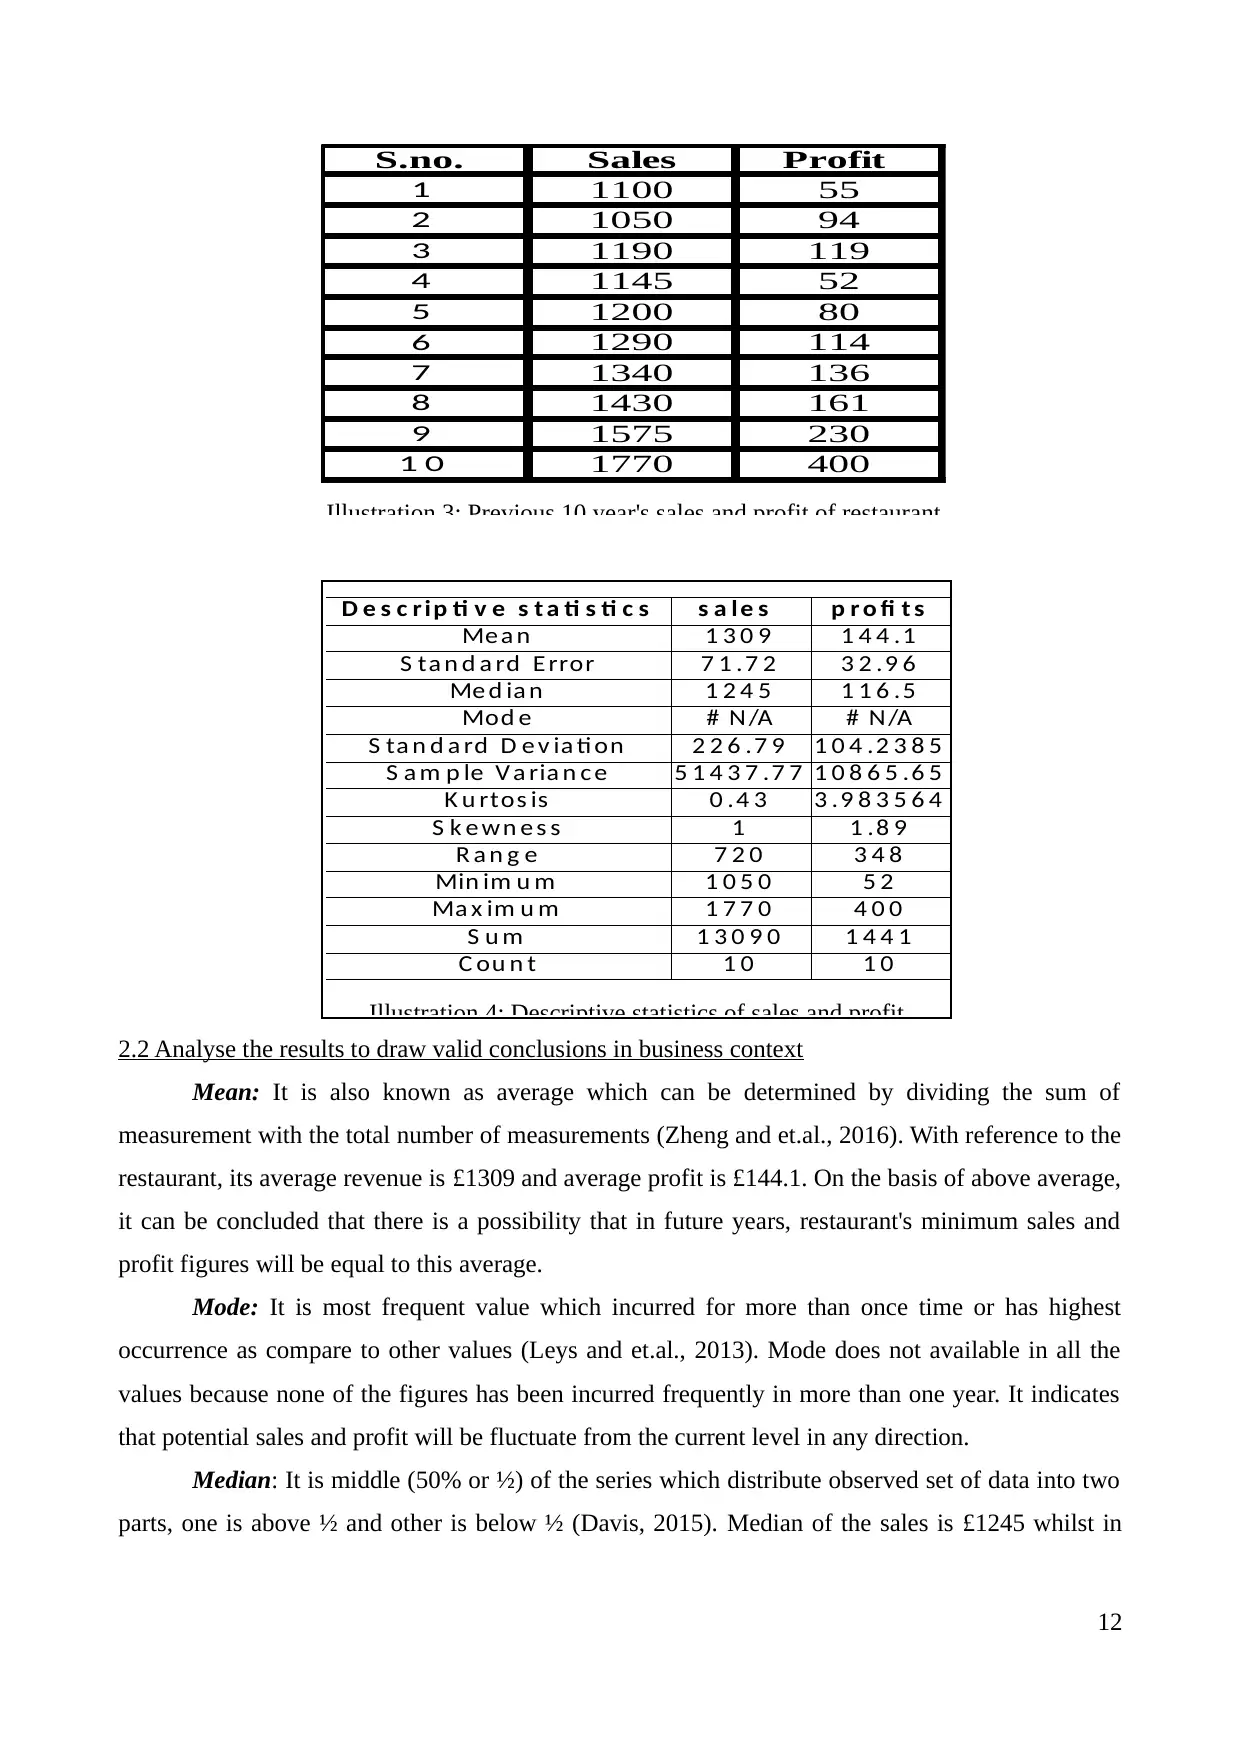
2.2 Analyse the results to draw valid conclusions in business context
Mean: It is also known as average which can be determined by dividing the sum of
measurement with the total number of measurements (Zheng and et.al., 2016). With reference to the
restaurant, its average revenue is £1309 and average profit is £144.1. On the basis of above average,
it can be concluded that there is a possibility that in future years, restaurant's minimum sales and
profit figures will be equal to this average.
Mode: It is most frequent value which incurred for more than once time or has highest
occurrence as compare to other values (Leys and et.al., 2013). Mode does not available in all the
values because none of the figures has been incurred frequently in more than one year. It indicates
that potential sales and profit will be fluctuate from the current level in any direction.
Median: It is middle (50% or ½) of the series which distribute observed set of data into two
parts, one is above ½ and other is below ½ (Davis, 2015). Median of the sales is £1245 whilst in
12
D e s c r ip ti v e s t a ti s ti c s s a le s p r o fi t s
Me a n 1 3 0 9 1 4 4 .1
S ta n d a rd E rror 7 1 .7 2 3 2 .9 6
Me d ia n 1 2 4 5 1 1 6 .5
Mod e # N /A # N/A
S ta n d a rd D e v ia ti on 2 2 6 .7 9 1 0 4 .2 3 8 5
S a m p le V a ria n c e 5 1 4 3 7 .7 7 1 0 8 6 5 .6 5
K u rtos is 0 .4 3 3 .9 8 3 5 6 4
S k e w n e s s 1 1 .8 9
R a n g e 7 2 0 3 4 8
Min im u m 1 0 5 0 5 2
Ma x im u m 1 7 7 0 4 0 0
S u m 1 3 0 9 0 1 4 4 1
C ou n t 1 0 1 0
Illustration 4: Descriptive statistics of sales and profit
S.no. Sales Profit
1 1100 55
2 1050 94
3 1190 119
4 1145 52
5 1200 80
6 1290 114
7 1340 136
8 1430 161
9 1575 230
1 0 1770 400
Illustration 3: Previous 10 year's sales and profit of restaurant
⊘ This is a preview!⊘
Do you want full access?
Subscribe today to unlock all pages.
Trusted by 1+ million students worldwide
1 out of 24
Related Documents


Your All-in-One AI-Powered Toolkit for Academic Success.
+13062052269
info@desklib.com
Available 24*7 on WhatsApp / Email
![[object Object]](/_next/static/media/star-bottom.7253800d.svg)
Unlock your academic potential
Copyright © 2020–2026 A2Z Services. All Rights Reserved. Developed and managed by ZUCOL.