Financial Analysis & Forecast: Italian Restaurant Business Plan
VerifiedAdded on 2023/06/11
|11
|2935
|290
Report
AI Summary
This report presents a financial forecast for an Italian restaurant business plan, including a profit and loss statement, cash flow statement, forecasted balance sheet, break-even point analysis, and margin of safety calculation. The profit and loss statement projects revenues, material costs, direct wages, gross profit, and various operating expenses over three years. The cash flow statement details cash inflows and outflows from operating, investing, and financing activities. The balance sheet forecasts shareholders’ funds, liabilities, and assets for three years. The break-even point is calculated to determine the sales volume needed to cover all costs. The margin of safety indicates the buffer between actual sales and the break-even point. Desklib provides students with access to past papers and solved assignments for further study.

E Managing Enterprise in the
21st Century
21st Century
Paraphrase This Document
Need a fresh take? Get an instant paraphrase of this document with our AI Paraphraser
Contents
INTRODUCTION.......................................................................................................................................................................................3
MAIN BODY..............................................................................................................................................................................................3
Profit and Loss Forecasted Statement......................................................................................................................................................3
Cash Flow Statement...............................................................................................................................................................................4
Forecasted Balance Sheet........................................................................................................................................................................6
Break-Even Point.....................................................................................................................................................................................7
Margin of Safety......................................................................................................................................................................................7
REFERENCES............................................................................................................................................................................................8
INTRODUCTION
A business plan is a document which elaborates in detail about how the business will continue its business operations and it also
states the objective and goals of the management. It also draws a map for which includes various strategies such as financial, operation
and marketing strategies of management. In the following report it is related with the Italian restaurant (Davidson III, 2018).
.
MAIN BODY
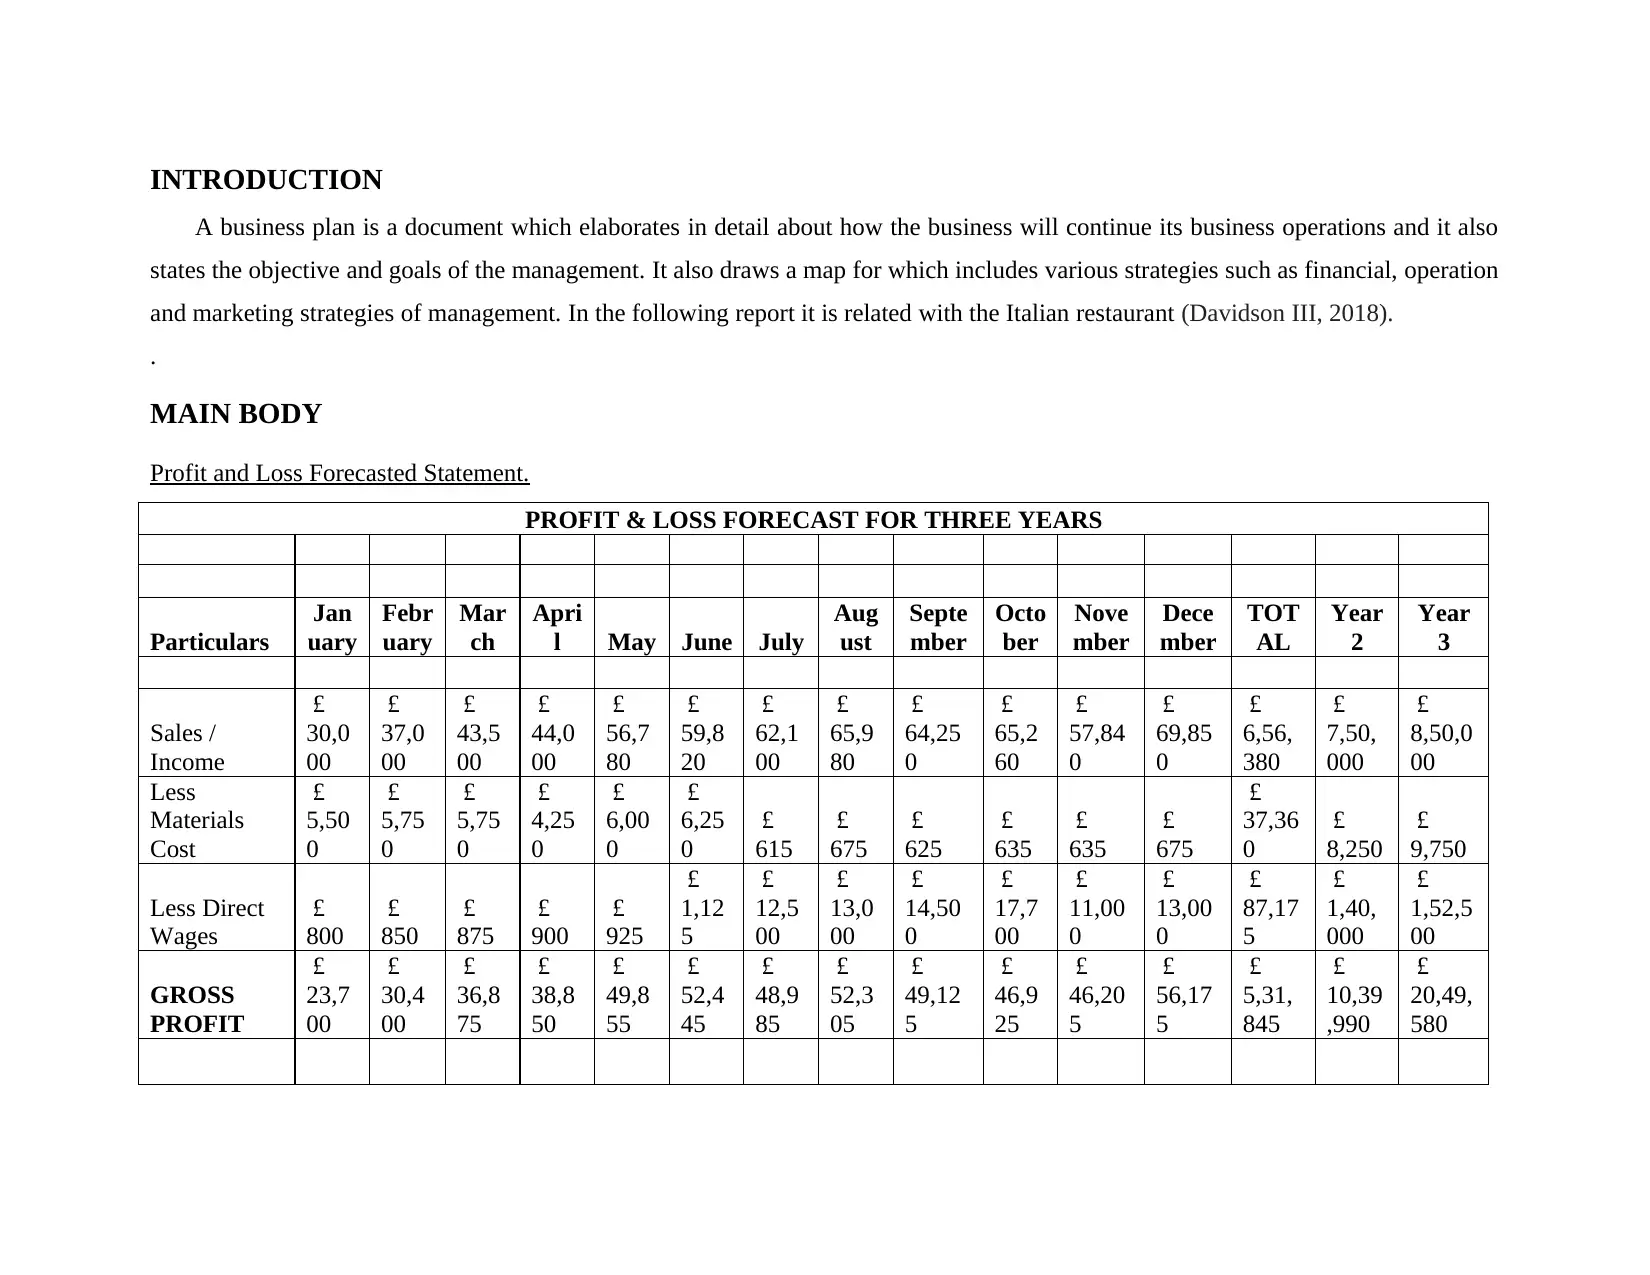
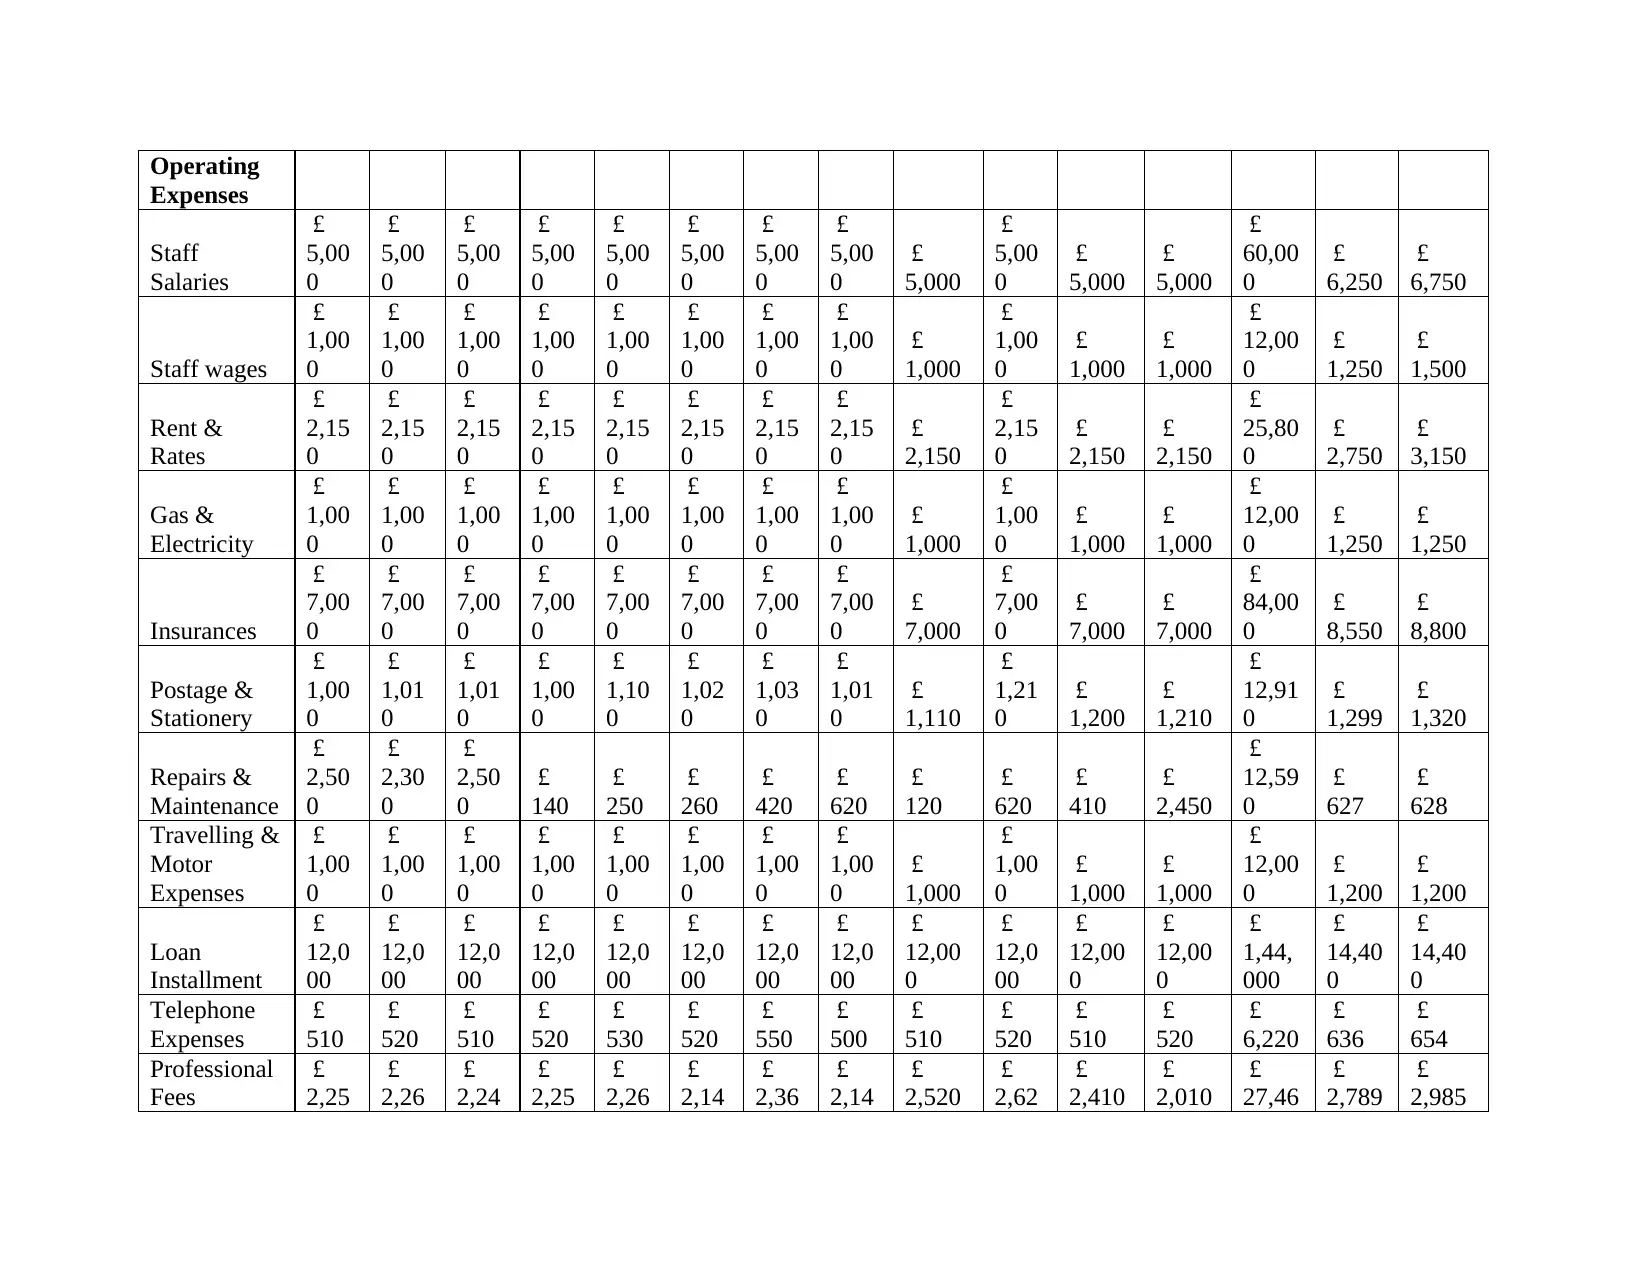
Profit and Loss Forecasted Statement.
PROFIT & LOSS FORECAST FOR THREE YEARS
Particulars
Jan
uary
Febr
uary
Mar
ch
Apri
l May June July
Aug
ust
Septe
mber
Octo
ber
Nove
mber
Dece
mber
TOT
AL
Year
2
Year
3
Sales /
Income
£
30,0
00
£
37,0
00
£
43,5
00
£
44,0
00
£
56,7
80
£
59,8
20
£
62,1
00
£
65,9
80
£
64,25
0
£
65,2
60
£
57,84
0
£
69,85
0
£
6,56,
380
£
7,50,
000
£
8,50,0
00
Less
Materials
Cost
£
5,50
0
£
5,75
0
£
5,75
0
£
4,25
0
£
6,00
0
£
6,25
0
£
615
£
675
£
625
£
635
£
635
£
675
£
37,36
0
£
8,250
£
9,750
Less Direct
Wages
£
800
£
850
£
875
£
900
£
925
£
1,12
5
£
12,5
00
£
13,0
00
£
14,50
0
£
17,7
00
£
11,00
0
£
13,00
0
£
87,17
5
£
1,40,
000
£
1,52,5
00
GROSS
PROFIT
£
23,7
00
£
30,4
00
£
36,8
75
£
38,8
50
£
49,8
55
£
52,4
45
£
48,9
85
£
52,3
05
£
49,12
5
£
46,9
25
£
46,20
5
£
56,17
5
£
5,31,
845
£
10,39
,990
£
20,49,
580
A business plan is a document which elaborates in detail about how the business will continue its business operations and it also
states the objective and goals of the management. It also draws a map for which includes various strategies such as financial, operation
and marketing strategies of management. In the following report it is related with the Italian restaurant (Davidson III, 2018).
.
MAIN BODY
Profit and Loss Forecasted Statement.
PROFIT & LOSS FORECAST FOR THREE YEARS
Particulars
Jan
uary
Febr
uary
Mar
ch
Apri
l May June July
Aug
ust
Septe
mber
Octo
ber
Nove
mber
Dece
mber
TOT
AL
Year
2
Year
3
Sales /
Income
£
30,0
00
£
37,0
00
£
43,5
00
£
44,0
00
£
56,7
80
£
59,8
20
£
62,1
00
£
65,9
80
£
64,25
0
£
65,2
60
£
57,84
0
£
69,85
0
£
6,56,
380
£
7,50,
000
£
8,50,0
00
Less
Materials
Cost
£
5,50
0
£
5,75
0
£
5,75
0
£
4,25
0
£
6,00
0
£
6,25
0
£
615
£
675
£
625
£
635
£
635
£
675
£
37,36
0
£
8,250
£
9,750
Less Direct
Wages
£
800
£
850
£
875
£
900
£
925
£
1,12
5
£
12,5
00
£
13,0
00
£
14,50
0
£
17,7
00
£
11,00
0
£
13,00
0
£
87,17
5
£
1,40,
000
£
1,52,5
00
GROSS
PROFIT
£
23,7
00
£
30,4
00
£
36,8
75
£
38,8
50
£
49,8
55
£
52,4
45
£
48,9
85
£
52,3
05
£
49,12
5
£
46,9
25
£
46,20
5
£
56,17
5
£
5,31,
845
£
10,39
,990
£
20,49,
580
⊘ This is a preview!⊘
Do you want full access?
Subscribe today to unlock all pages.
Trusted by 1+ million students worldwide
Operating
Expenses
Staff
Salaries
£
5,00
0
£
5,00
0
£
5,00
0
£
5,00
0
£
5,00
0
£
5,00
0
£
5,00
0
£
5,00
0
£
5,000
£
5,00
0
£
5,000
£
5,000
£
60,00
0
£
6,250
£
6,750
Staff wages
£
1,00
0
£
1,00
0
£
1,00
0
£
1,00
0
£
1,00
0
£
1,00
0
£
1,00
0
£
1,00
0
£
1,000
£
1,00
0
£
1,000
£
1,000
£
12,00
0
£
1,250
£
1,500
Rent &
Rates
£
2,15
0
£
2,15
0
£
2,15
0
£
2,15
0
£
2,15
0
£
2,15
0
£
2,15
0
£
2,15
0
£
2,150
£
2,15
0
£
2,150
£
2,150
£
25,80
0
£
2,750
£
3,150
Gas &
Electricity
£
1,00
0
£
1,00
0
£
1,00
0
£
1,00
0
£
1,00
0
£
1,00
0
£
1,00
0
£
1,00
0
£
1,000
£
1,00
0
£
1,000
£
1,000
£
12,00
0
£
1,250
£
1,250
Insurances
£
7,00
0
£
7,00
0
£
7,00
0
£
7,00
0
£
7,00
0
£
7,00
0
£
7,00
0
£
7,00
0
£
7,000
£
7,00
0
£
7,000
£
7,000
£
84,00
0
£
8,550
£
8,800
Postage &
Stationery
£
1,00
0
£
1,01
0
£
1,01
0
£
1,00
0
£
1,10
0
£
1,02
0
£
1,03
0
£
1,01
0
£
1,110
£
1,21
0
£
1,200
£
1,210
£
12,91
0
£
1,299
£
1,320
Repairs &
Maintenance
£
2,50
0
£
2,30
0
£
2,50
0
£
140
£
250
£
260
£
420
£
620
£
120
£
620
£
410
£
2,450
£
12,59
0
£
627
£
628
Travelling &
Motor
Expenses
£
1,00
0
£
1,00
0
£
1,00
0
£
1,00
0
£
1,00
0
£
1,00
0
£
1,00
0
£
1,00
0
£
1,000
£
1,00
0
£
1,000
£
1,000
£
12,00
0
£
1,200
£
1,200
Loan
Installment
£
12,0
00
£
12,0
00
£
12,0
00
£
12,0
00
£
12,0
00
£
12,0
00
£
12,0
00
£
12,0
00
£
12,00
0
£
12,0
00
£
12,00
0
£
12,00
0
£
1,44,
000
£
14,40
0
£
14,40
0
Telephone
Expenses
£
510
£
520
£
510
£
520
£
530
£
520
£
550
£
500
£
510
£
520
£
510
£
520
£
6,220
£
636
£
654
Professional
Fees
£
2,25
£
2,26
£
2,24
£
2,25
£
2,26
£
2,14
£
2,36
£
2,14
£
2,520
£
2,62
£
2,410
£
2,010
£
27,46
£
2,789
£
2,985
Expenses
Staff
Salaries
£
5,00
0
£
5,00
0
£
5,00
0
£
5,00
0
£
5,00
0
£
5,00
0
£
5,00
0
£
5,00
0
£
5,000
£
5,00
0
£
5,000
£
5,000
£
60,00
0
£
6,250
£
6,750
Staff wages
£
1,00
0
£
1,00
0
£
1,00
0
£
1,00
0
£
1,00
0
£
1,00
0
£
1,00
0
£
1,00
0
£
1,000
£
1,00
0
£
1,000
£
1,000
£
12,00
0
£
1,250
£
1,500
Rent &
Rates
£
2,15
0
£
2,15
0
£
2,15
0
£
2,15
0
£
2,15
0
£
2,15
0
£
2,15
0
£
2,15
0
£
2,150
£
2,15
0
£
2,150
£
2,150
£
25,80
0
£
2,750
£
3,150
Gas &
Electricity
£
1,00
0
£
1,00
0
£
1,00
0
£
1,00
0
£
1,00
0
£
1,00
0
£
1,00
0
£
1,00
0
£
1,000
£
1,00
0
£
1,000
£
1,000
£
12,00
0
£
1,250
£
1,250
Insurances
£
7,00
0
£
7,00
0
£
7,00
0
£
7,00
0
£
7,00
0
£
7,00
0
£
7,00
0
£
7,00
0
£
7,000
£
7,00
0
£
7,000
£
7,000
£
84,00
0
£
8,550
£
8,800
Postage &
Stationery
£
1,00
0
£
1,01
0
£
1,01
0
£
1,00
0
£
1,10
0
£
1,02
0
£
1,03
0
£
1,01
0
£
1,110
£
1,21
0
£
1,200
£
1,210
£
12,91
0
£
1,299
£
1,320
Repairs &
Maintenance
£
2,50
0
£
2,30
0
£
2,50
0
£
140
£
250
£
260
£
420
£
620
£
120
£
620
£
410
£
2,450
£
12,59
0
£
627
£
628
Travelling &
Motor
Expenses
£
1,00
0
£
1,00
0
£
1,00
0
£
1,00
0
£
1,00
0
£
1,00
0
£
1,00
0
£
1,00
0
£
1,000
£
1,00
0
£
1,000
£
1,000
£
12,00
0
£
1,200
£
1,200
Loan
Installment
£
12,0
00
£
12,0
00
£
12,0
00
£
12,0
00
£
12,0
00
£
12,0
00
£
12,0
00
£
12,0
00
£
12,00
0
£
12,0
00
£
12,00
0
£
12,00
0
£
1,44,
000
£
14,40
0
£
14,40
0
Telephone
Expenses
£
510
£
520
£
510
£
520
£
530
£
520
£
550
£
500
£
510
£
520
£
510
£
520
£
6,220
£
636
£
654
Professional
Fees
£
2,25
£
2,26
£
2,24
£
2,25
£
2,26
£
2,14
£
2,36
£
2,14
£
2,520
£
2,62
£
2,410
£
2,010
£
27,46
£
2,789
£
2,985
Paraphrase This Document
Need a fresh take? Get an instant paraphrase of this document with our AI Paraphraser
0 0 0 0 0 0 0 0 0 0
Advertising
&
Promotions
£
2,25
0
£
2,25
0
£
2,25
0
£
2,25
0
£
2,25
0
£
2,25
0
£
2,25
0
£
2,25
0
£
2,250
£
2,25
0
£
2,250
£
2,250
£
27,00
0
£
2,700
£
2,700
Miscellaneo
us Expenses
£
240
£
260
£
250
£
260
£
250
£
210
£
210
£
240
£
290
£
280
£
270
£
280
£
3,040
£
319
£
326
TOTAL
EXPENSES
£
£
37,9
00
£
37,7
50
£
37,9
10
£
35,5
70
£
35,7
90
£
35,5
50
£
35,9
70
£
35,9
10
£
35,95
0
£
36,6
50
£
36,20
0
£
37,87
0
£
4,39,
020
£
8,40,
140
£
16,42,
530
Net Profit
(Loss)
Before Tax
-£
14,2
00
-£
7,35
0
-£
1,03
5
£
3,28
0
£
14,0
65
£
16,8
95
£
13,0
15
£
16,3
95
£
13,17
5
£
10,2
75
£
10,00
5
£
18,30
5
£
92,82
5
£
1,99,
850
£
4,07,0
50
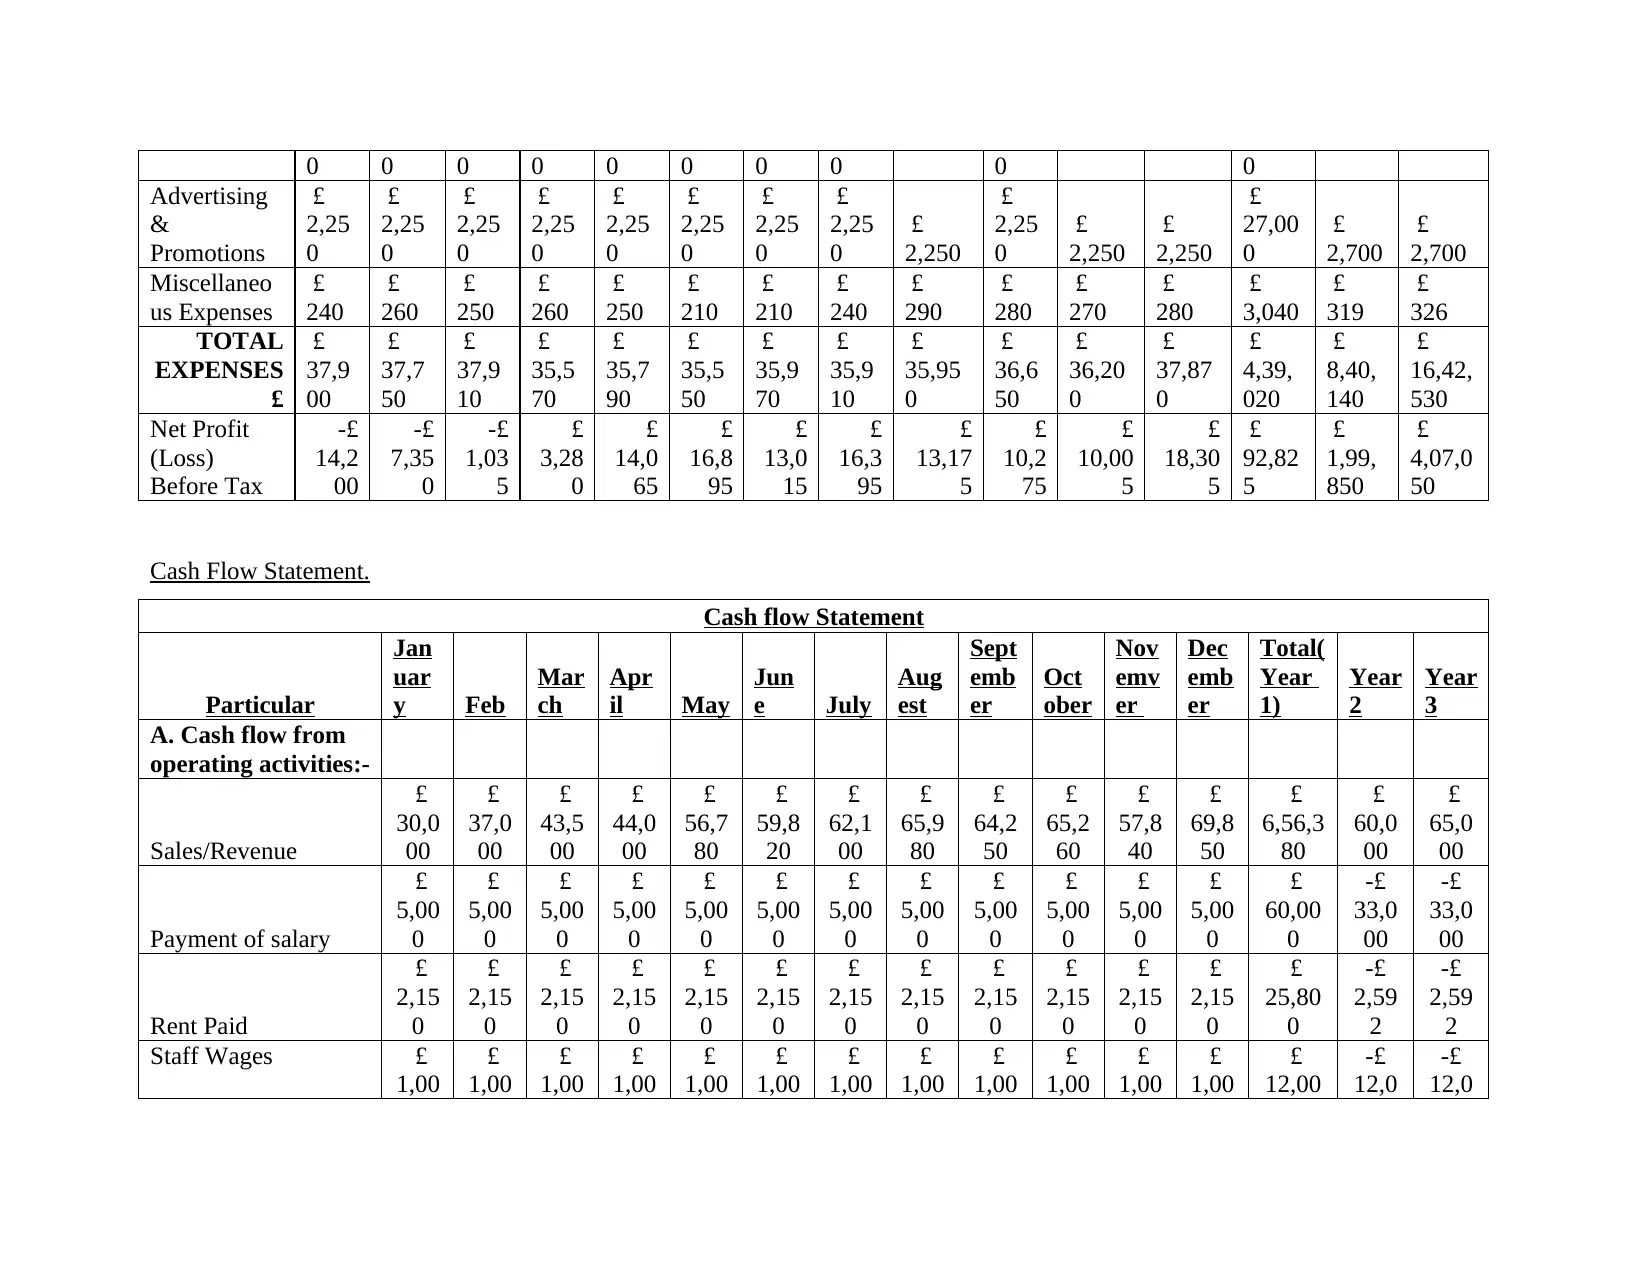
Cash Flow Statement.
Cash flow Statement
Particular
Jan
uar
y Feb
Mar
ch
Apr
il May
Jun
e July
Aug
est
Sept
emb
er
Oct
ober
Nov
emv
er
Dec
emb
er
Total(
Year
1)
Year
2
Year
3
A. Cash flow from
operating activities:-
Sales/Revenue
£
30,0
00
£
37,0
00
£
43,5
00
£
44,0
00
£
56,7
80
£
59,8
20
£
62,1
00
£
65,9
80
£
64,2
50
£
65,2
60
£
57,8
40
£
69,8
50
£
6,56,3
80
£
60,0
00
£
65,0
00
Payment of salary
£
5,00
0
£
5,00
0
£
5,00
0
£
5,00
0
£
5,00
0
£
5,00
0
£
5,00
0
£
5,00
0
£
5,00
0
£
5,00
0
£
5,00
0
£
5,00
0
£
60,00
0
-£
33,0
00
-£
33,0
00
Rent Paid
£
2,15
0
£
2,15
0
£
2,15
0
£
2,15
0
£
2,15
0
£
2,15
0
£
2,15
0
£
2,15
0
£
2,15
0
£
2,15
0
£
2,15
0
£
2,15
0
£
25,80
0
-£
2,59
2
-£
2,59
2
Staff Wages £
1,00
£
1,00
£
1,00
£
1,00
£
1,00
£
1,00
£
1,00
£
1,00
£
1,00
£
1,00
£
1,00
£
1,00
£
12,00
-£
12,0
-£
12,0
Advertising
&
Promotions
£
2,25
0
£
2,25
0
£
2,25
0
£
2,25
0
£
2,25
0
£
2,25
0
£
2,25
0
£
2,25
0
£
2,250
£
2,25
0
£
2,250
£
2,250
£
27,00
0
£
2,700
£
2,700
Miscellaneo
us Expenses
£
240
£
260
£
250
£
260
£
250
£
210
£
210
£
240
£
290
£
280
£
270
£
280
£
3,040
£
319
£
326
TOTAL
EXPENSES
£
£
37,9
00
£
37,7
50
£
37,9
10
£
35,5
70
£
35,7
90
£
35,5
50
£
35,9
70
£
35,9
10
£
35,95
0
£
36,6
50
£
36,20
0
£
37,87
0
£
4,39,
020
£
8,40,
140
£
16,42,
530
Net Profit
(Loss)
Before Tax
-£
14,2
00
-£
7,35
0
-£
1,03
5
£
3,28
0
£
14,0
65
£
16,8
95
£
13,0
15
£
16,3
95
£
13,17
5
£
10,2
75
£
10,00
5
£
18,30
5
£
92,82
5
£
1,99,
850
£
4,07,0
50
Cash Flow Statement.
Cash flow Statement
Particular
Jan
uar
y Feb
Mar
ch
Apr
il May
Jun
e July
Aug
est
Sept
emb
er
Oct
ober
Nov
emv
er
Dec
emb
er
Total(
Year
1)
Year
2
Year
3
A. Cash flow from
operating activities:-
Sales/Revenue
£
30,0
00
£
37,0
00
£
43,5
00
£
44,0
00
£
56,7
80
£
59,8
20
£
62,1
00
£
65,9
80
£
64,2
50
£
65,2
60
£
57,8
40
£
69,8
50
£
6,56,3
80
£
60,0
00
£
65,0
00
Payment of salary
£
5,00
0
£
5,00
0
£
5,00
0
£
5,00
0
£
5,00
0
£
5,00
0
£
5,00
0
£
5,00
0
£
5,00
0
£
5,00
0
£
5,00
0
£
5,00
0
£
60,00
0
-£
33,0
00
-£
33,0
00
Rent Paid
£
2,15
0
£
2,15
0
£
2,15
0
£
2,15
0
£
2,15
0
£
2,15
0
£
2,15
0
£
2,15
0
£
2,15
0
£
2,15
0
£
2,15
0
£
2,15
0
£
25,80
0
-£
2,59
2
-£
2,59
2
Staff Wages £
1,00
£
1,00
£
1,00
£
1,00
£
1,00
£
1,00
£
1,00
£
1,00
£
1,00
£
1,00
£
1,00
£
1,00
£
12,00
-£
12,0
-£
12,0
0 0 0 0 0 0 0 0 0 0 0 0 0 00 00
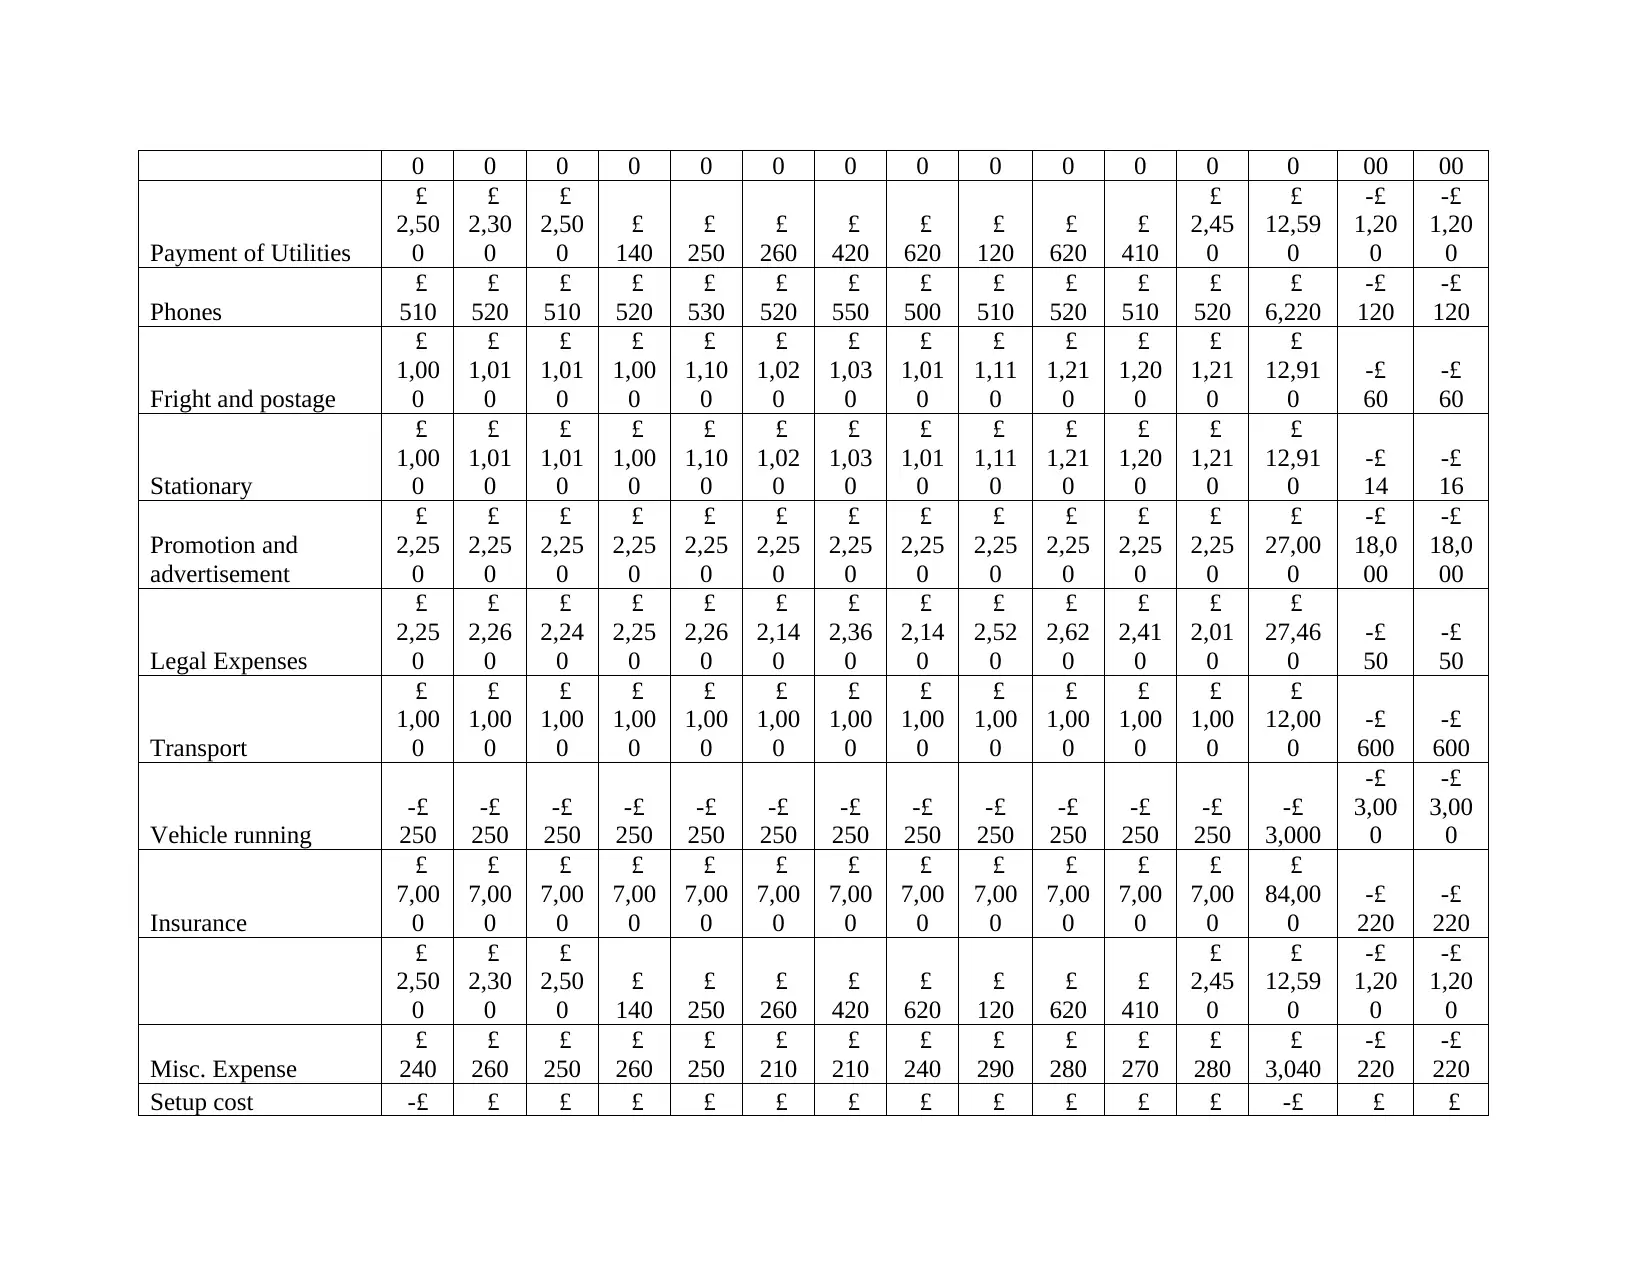
Payment of Utilities
£
2,50
0
£
2,30
0
£
2,50
0
£
140
£
250
£
260
£
420
£
620
£
120
£
620
£
410
£
2,45
0
£
12,59
0
-£
1,20
0
-£
1,20
0
Phones
£
510
£
520
£
510
£
520
£
530
£
520
£
550
£
500
£
510
£
520
£
510
£
520
£
6,220
-£
120
-£
120
Fright and postage
£
1,00
0
£
1,01
0
£
1,01
0
£
1,00
0
£
1,10
0
£
1,02
0
£
1,03
0
£
1,01
0
£
1,11
0
£
1,21
0
£
1,20
0
£
1,21
0
£
12,91
0
-£
60
-£
60
Stationary
£
1,00
0
£
1,01
0
£
1,01
0
£
1,00
0
£
1,10
0
£
1,02
0
£
1,03
0
£
1,01
0
£
1,11
0
£
1,21
0
£
1,20
0
£
1,21
0
£
12,91
0
-£
14
-£
16
Promotion and
advertisement
£
2,25
0
£
2,25
0
£
2,25
0
£
2,25
0
£
2,25
0
£
2,25
0
£
2,25
0
£
2,25
0
£
2,25
0
£
2,25
0
£
2,25
0
£
2,25
0
£
27,00
0
-£
18,0
00
-£
18,0
00
Legal Expenses
£
2,25
0
£
2,26
0
£
2,24
0
£
2,25
0
£
2,26
0
£
2,14
0
£
2,36
0
£
2,14
0
£
2,52
0
£
2,62
0
£
2,41
0
£
2,01
0
£
27,46
0
-£
50
-£
50
Transport
£
1,00
0
£
1,00
0
£
1,00
0
£
1,00
0
£
1,00
0
£
1,00
0
£
1,00
0
£
1,00
0
£
1,00
0
£
1,00
0
£
1,00
0
£
1,00
0
£
12,00
0
-£
600
-£
600
Vehicle running
-£
250
-£
250
-£
250
-£
250
-£
250
-£
250
-£
250
-£
250
-£
250
-£
250
-£
250
-£
250
-£
3,000
-£
3,00
0
-£
3,00
0
Insurance
£
7,00
0
£
7,00
0
£
7,00
0
£
7,00
0
£
7,00
0
£
7,00
0
£
7,00
0
£
7,00
0
£
7,00
0
£
7,00
0
£
7,00
0
£
7,00
0
£
84,00
0
-£
220
-£
220
£
2,50
0
£
2,30
0
£
2,50
0
£
140
£
250
£
260
£
420
£
620
£
120
£
620
£
410
£
2,45
0
£
12,59
0
-£
1,20
0
-£
1,20
0
Misc. Expense
£
240
£
260
£
250
£
260
£
250
£
210
£
210
£
240
£
290
£
280
£
270
£
280
£
3,040
-£
220
-£
220
Setup cost -£ £ £ £ £ £ £ £ £ £ £ £ -£ £ £
⊘ This is a preview!⊘
Do you want full access?
Subscribe today to unlock all pages.
Trusted by 1+ million students worldwide
14,6
00 - - - - - - - - - - -
14,60
0 - -
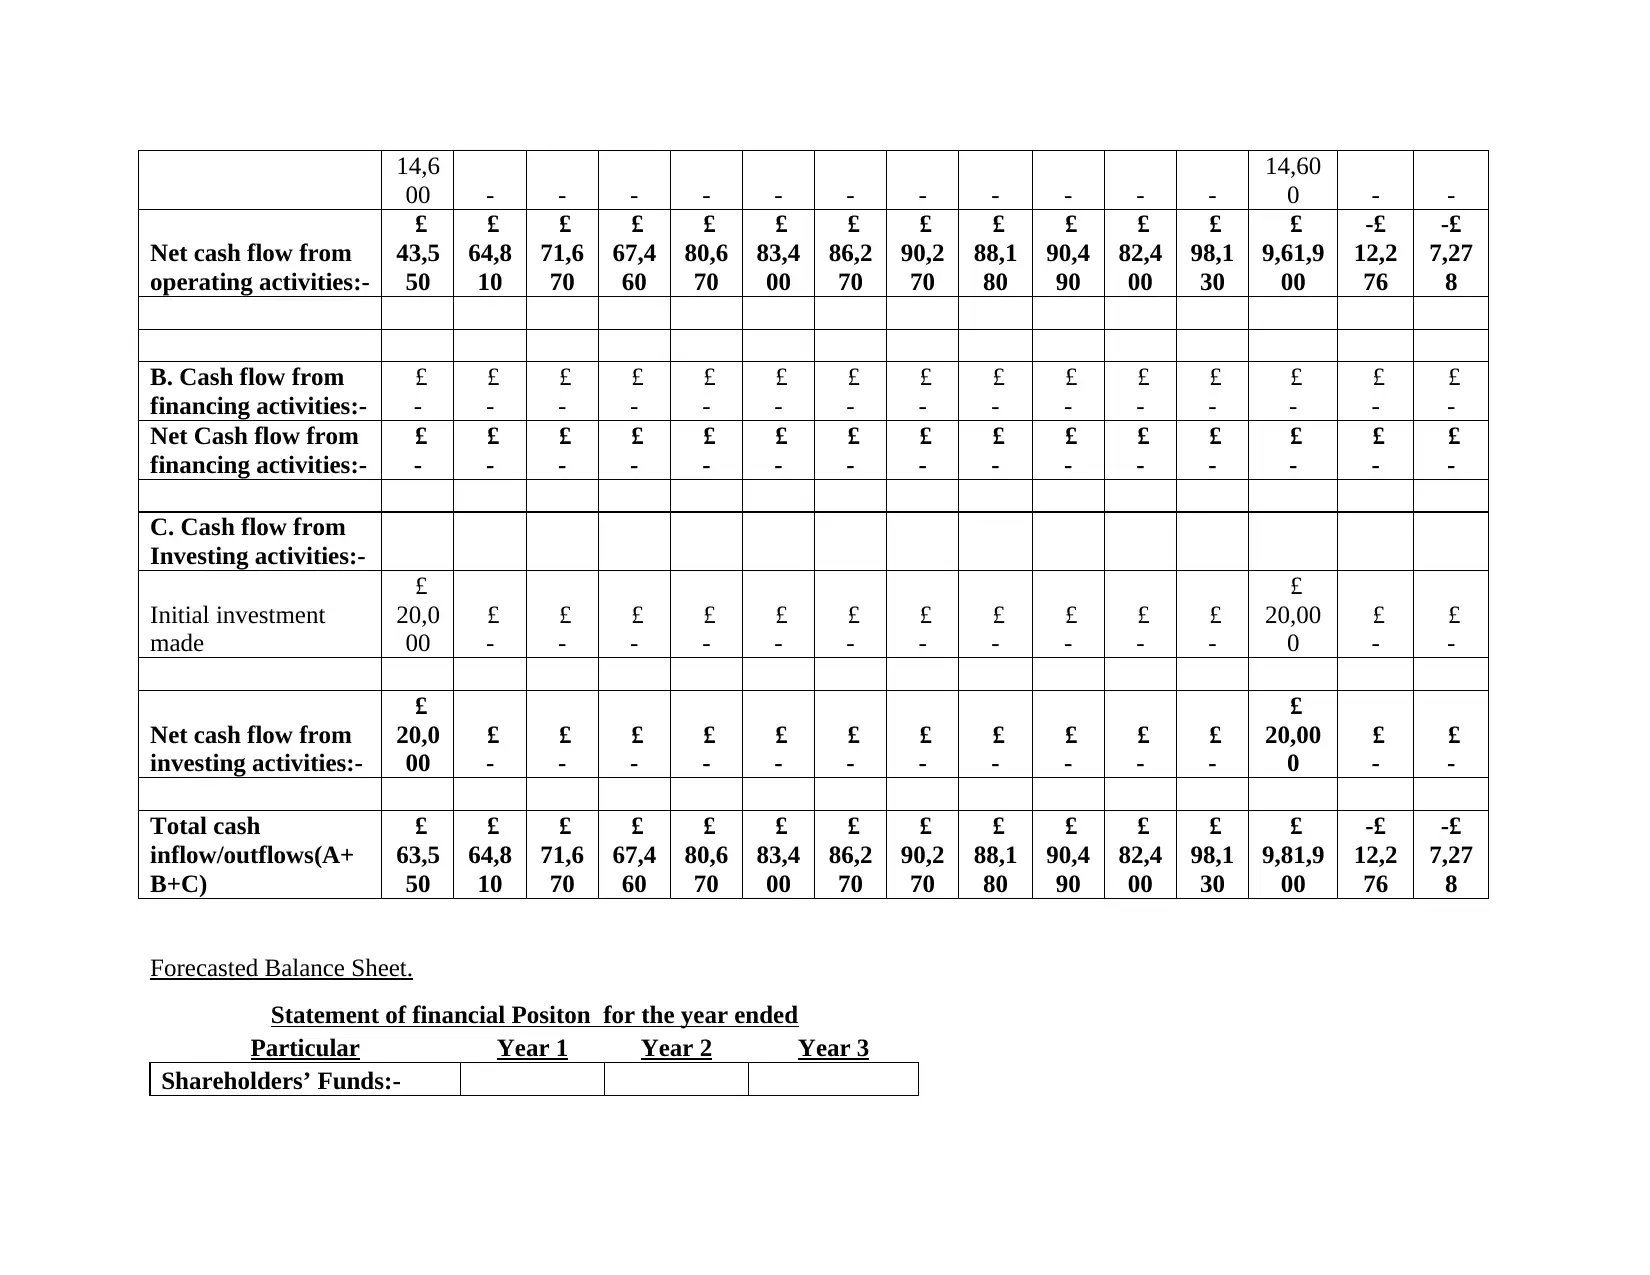
Net cash flow from
operating activities:-
£
43,5
50
£
64,8
10
£
71,6
70
£
67,4
60
£
80,6
70
£
83,4
00
£
86,2
70
£
90,2
70
£
88,1
80
£
90,4
90
£
82,4
00
£
98,1
30
£
9,61,9
00
-£
12,2
76
-£
7,27
8
B. Cash flow from
financing activities:-
£
-
£
-
£
-
£
-
£
-
£
-
£
-
£
-
£
-
£
-
£
-
£
-
£
-
£
-
£
-
Net Cash flow from
financing activities:-
£
-
£
-
£
-
£
-
£
-
£
-
£
-
£
-
£
-
£
-
£
-
£
-
£
-
£
-
£
-
C. Cash flow from
Investing activities:-
Initial investment
made
£
20,0
00
£
-
£
-
£
-
£
-
£
-
£
-
£
-
£
-
£
-
£
-
£
-
£
20,00
0
£
-
£
-
Net cash flow from
investing activities:-
£
20,0
00
£
-
£
-
£
-
£
-
£
-
£
-
£
-
£
-
£
-
£
-
£
-
£
20,00
0
£
-
£
-
Total cash
inflow/outflows(A+
B+C)
£
63,5
50
£
64,8
10
£
71,6
70
£
67,4
60
£
80,6
70
£
83,4
00
£
86,2
70
£
90,2
70
£
88,1
80
£
90,4
90
£
82,4
00
£
98,1
30
£
9,81,9
00
-£
12,2
76
-£
7,27
8
Forecasted Balance Sheet.
Statement of financial Positon for the year ended
Particular Year 1 Year 2 Year 3
Shareholders’ Funds:-
00 - - - - - - - - - - -
14,60
0 - -
Net cash flow from
operating activities:-
£
43,5
50
£
64,8
10
£
71,6
70
£
67,4
60
£
80,6
70
£
83,4
00
£
86,2
70
£
90,2
70
£
88,1
80
£
90,4
90
£
82,4
00
£
98,1
30
£
9,61,9
00
-£
12,2
76
-£
7,27
8
B. Cash flow from
financing activities:-
£
-
£
-
£
-
£
-
£
-
£
-
£
-
£
-
£
-
£
-
£
-
£
-
£
-
£
-
£
-
Net Cash flow from
financing activities:-
£
-
£
-
£
-
£
-
£
-
£
-
£
-
£
-
£
-
£
-
£
-
£
-
£
-
£
-
£
-
C. Cash flow from
Investing activities:-
Initial investment
made
£
20,0
00
£
-
£
-
£
-
£
-
£
-
£
-
£
-
£
-
£
-
£
-
£
-
£
20,00
0
£
-
£
-
Net cash flow from
investing activities:-
£
20,0
00
£
-
£
-
£
-
£
-
£
-
£
-
£
-
£
-
£
-
£
-
£
-
£
20,00
0
£
-
£
-
Total cash
inflow/outflows(A+
B+C)
£
63,5
50
£
64,8
10
£
71,6
70
£
67,4
60
£
80,6
70
£
83,4
00
£
86,2
70
£
90,2
70
£
88,1
80
£
90,4
90
£
82,4
00
£
98,1
30
£
9,81,9
00
-£
12,2
76
-£
7,27
8
Forecasted Balance Sheet.
Statement of financial Positon for the year ended
Particular Year 1 Year 2 Year 3
Shareholders’ Funds:-
Paraphrase This Document
Need a fresh take? Get an instant paraphrase of this document with our AI Paraphraser
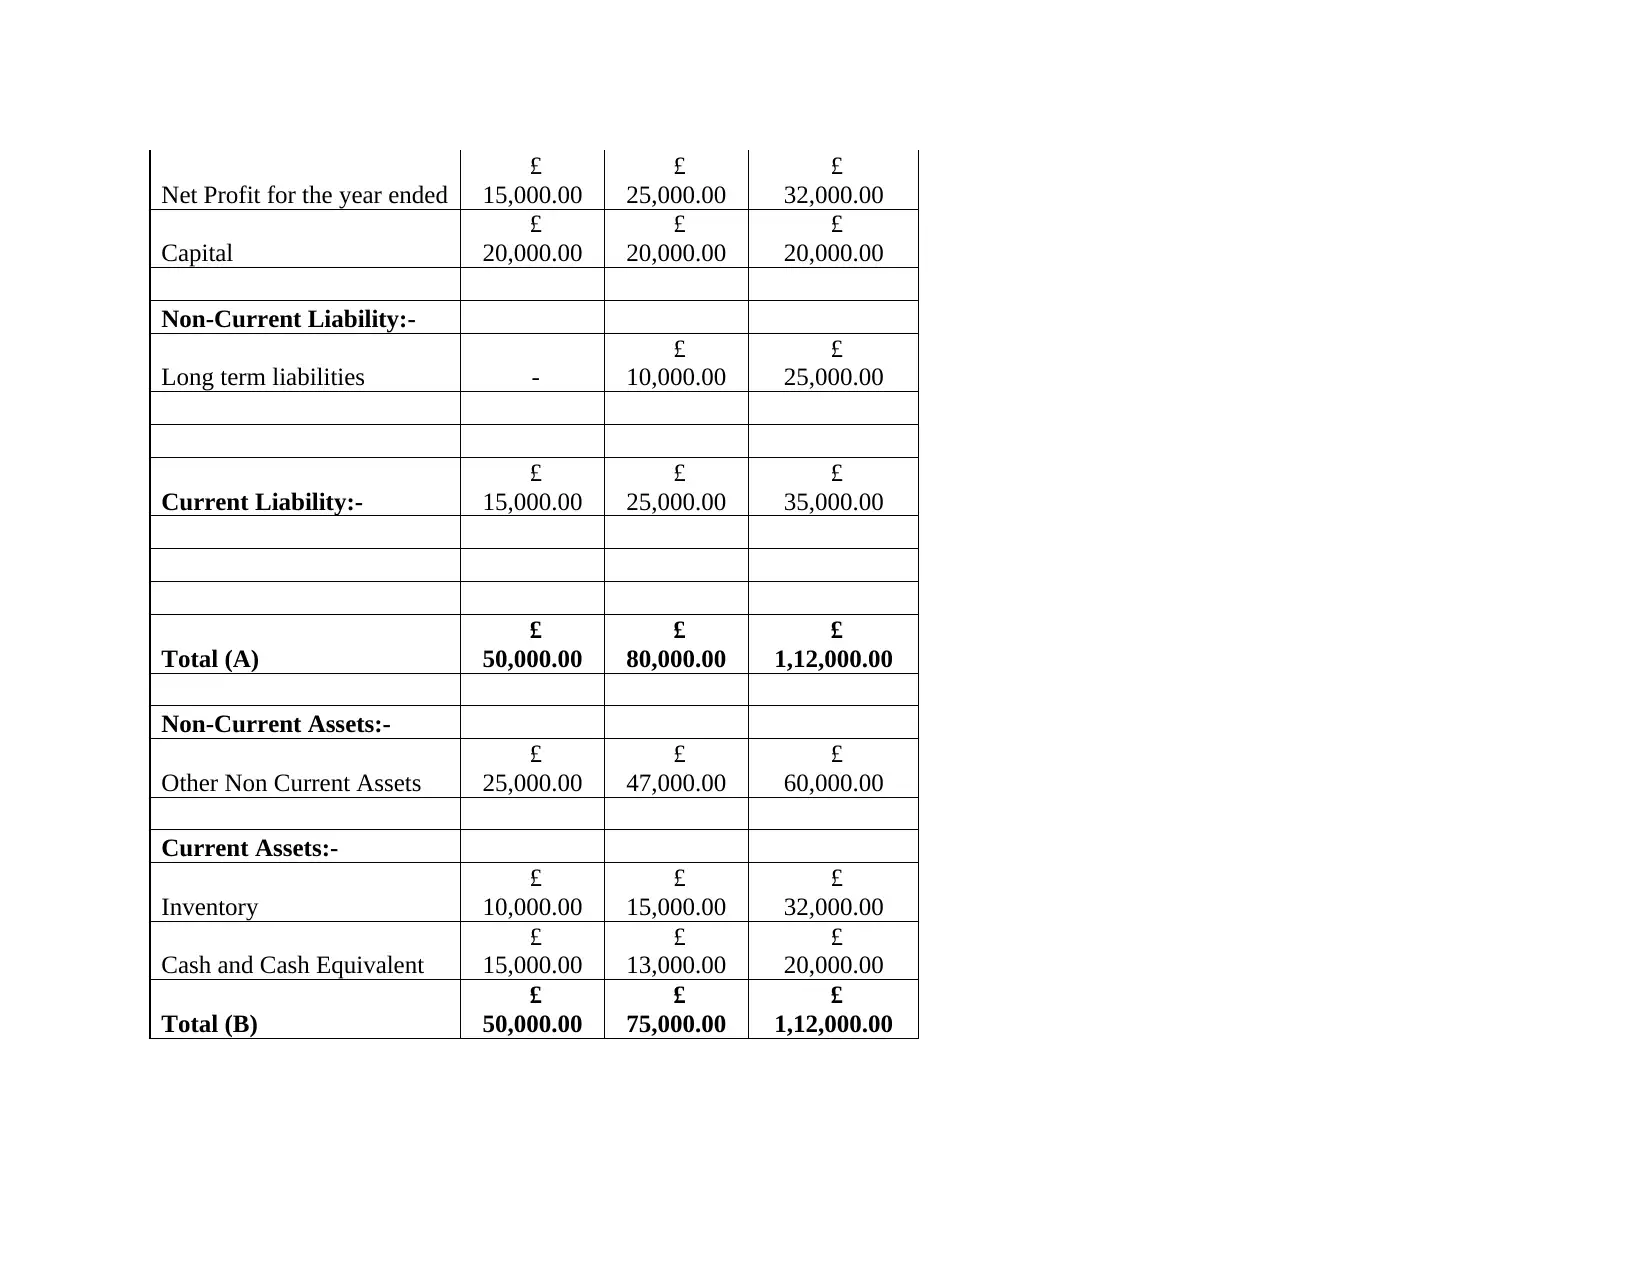
Net Profit for the year ended
£
15,000.00
£
25,000.00
£
32,000.00
Capital
£
20,000.00
£
20,000.00
£
20,000.00
Non-Current Liability:-
Long term liabilities -
£
10,000.00
£
25,000.00
Current Liability:-
£
15,000.00
£
25,000.00
£
35,000.00
Total (A)
£
50,000.00
£
80,000.00
£
1,12,000.00
Non-Current Assets:-
Other Non Current Assets
£
25,000.00
£
47,000.00
£
60,000.00
Current Assets:-
Inventory
£
10,000.00
£
15,000.00
£
32,000.00
Cash and Cash Equivalent
£
15,000.00
£
13,000.00
£
20,000.00
Total (B)
£
50,000.00
£
75,000.00
£
1,12,000.00
£
15,000.00
£
25,000.00
£
32,000.00
Capital
£
20,000.00
£
20,000.00
£
20,000.00
Non-Current Liability:-
Long term liabilities -
£
10,000.00
£
25,000.00
Current Liability:-
£
15,000.00
£
25,000.00
£
35,000.00
Total (A)
£
50,000.00
£
80,000.00
£
1,12,000.00
Non-Current Assets:-
Other Non Current Assets
£
25,000.00
£
47,000.00
£
60,000.00
Current Assets:-
Inventory
£
10,000.00
£
15,000.00
£
32,000.00
Cash and Cash Equivalent
£
15,000.00
£
13,000.00
£
20,000.00
Total (B)
£
50,000.00
£
75,000.00
£
1,12,000.00
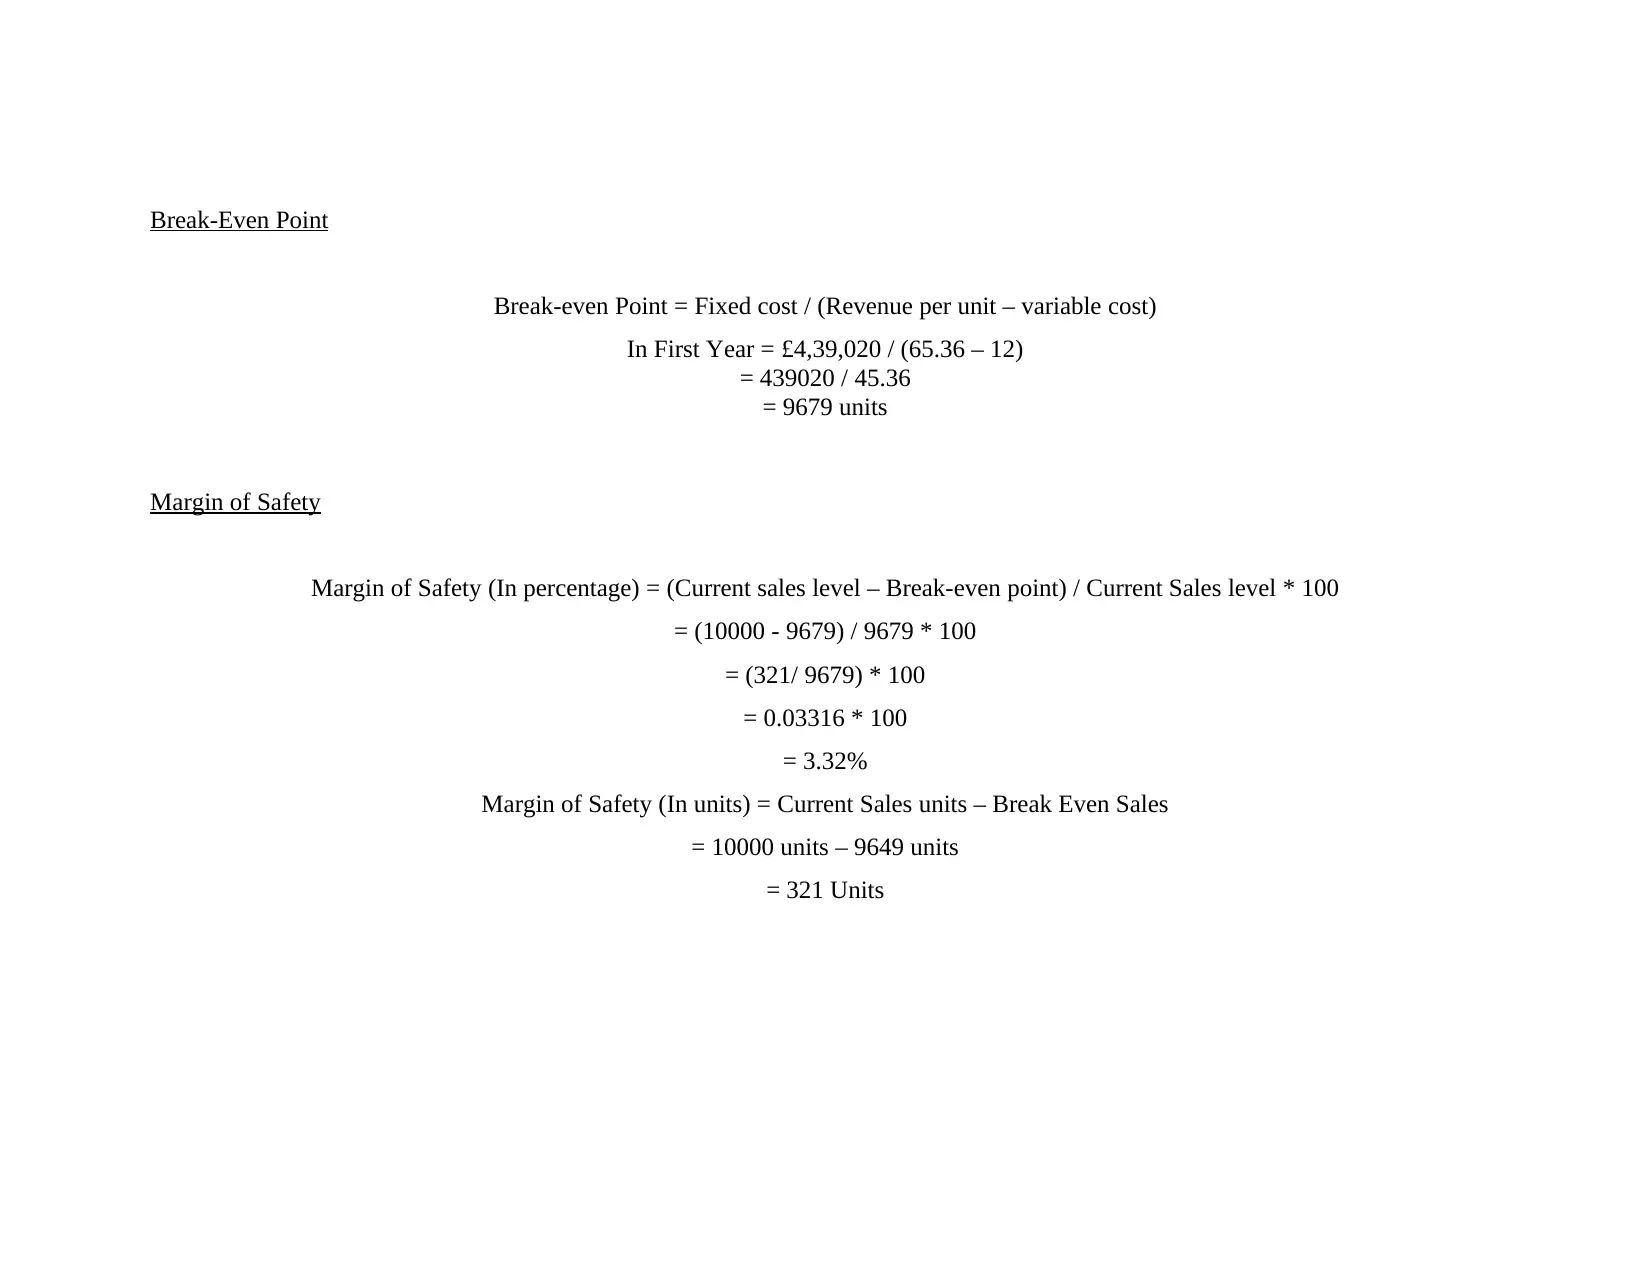
Break-Even Point
Break-even Point = Fixed cost / (Revenue per unit – variable cost)
In First Year = £4,39,020 / (65.36 – 12)
= 439020 / 45.36
= 9679 units
Margin of Safety
Margin of Safety (In percentage) = (Current sales level – Break-even point) / Current Sales level * 100
= (10000 - 9679) / 9679 * 100
= (321/ 9679) * 100
= 0.03316 * 100
= 3.32%
Margin of Safety (In units) = Current Sales units – Break Even Sales
= 10000 units – 9649 units
= 321 Units
⊘ This is a preview!⊘
Do you want full access?
Subscribe today to unlock all pages.
Trusted by 1+ million students worldwide
REFERENCES
Books and Journals
Bandelj, N., Sowers, E. and Morgan, P. J., 2019. All about profit? How economics and finance experts disseminate the instrumental
market logic to family businesses. Poetics. 76. p.101362.
Brush and et.al., 2019. A gendered look at entrepreneurship ecosystems. Small Business Economics. 53(2). pp.393-408.
Buzgurescu, O. L. P. and Elena, N., 2020. Bankruptcy risk prediction in assuring the financial performance of Romanian industrial
companies. In Contemporary Issues in Business Economics and Finance. Emerald Publishing Limited.
Cainelli, G., Giannini, V. and Iacobucci, D., 2020. Small firms and bank financing in bad times. Small Business Economics. 55(4).
pp.943-953.
Gundogdu, A.S., 2019. A modern perspective of Islamic economics and finance. Emerald Group Publishing.
Kaneda, N., 2019. What makes listed subsidiaries delist in Japan? A logistic analysis. In Advances in Pacific Basin Business,
Economics and Finance. Emerald Publishing Limited.
Li and et.al., 2019. The certification effect of government R&D subsidies on innovative entrepreneurial firms’ access to bank finance:
Evidence from China. Small Business Economics. 52(1). pp.241-259.
Moosa, I.A., 2020. Controversies in economics and finance: Puzzles and myths. Edward Elgar Publishing.
Mukhlisin, M. and Komalasari, R., 2018. Do You Capture Financial Crisis?. Journal of Islamic Monetary Economics and
Finance. 3(2). pp.1-48.
Pan, F. and Yang, B., 2019. Financial development and the geographies of startup cities: evidence from China. Small Business
Economics. 52(3). pp.743-758.
Stewart, A., 2018. Can family business loosen the grips of accounting, economics, and finance?. Journal of Family Business
Strategy. 9(3). pp.153-166.
Vogel, H. A., 2019. Foundations of airport economics and finance. Elsevier.
Yesilay, R. B. and Halac, U., 2020. An assessment of innovation efficiency in EECA countries using the DEA method.
In Contemporary Issues in Business Economics and Finance. Emerald Publishing Limited.
(Bandelj, Sowers and Morgan, 2019) (Brush and et.al., 2019) (Buzgurescu and Elena, 2020) (Cainelli, Giannini and Iacobucci, 2020)
(Gundogdu, 2019) (Kaneda, 2019) (Li and et.al., 2019) (Moosa, 2020) (Mukhlisin and Komalasari, 2018) (Pan and Yang,
2019) (Stewart, 2018) (Vogel, 2019) (Yesilay and Halac, 2020)
Paraphrase This Document
Need a fresh take? Get an instant paraphrase of this document with our AI Paraphraser
Davidson III, W., 2018. Financial forecasting and decision making. John Wiley & Sons.
Goel, S., 2019. Finance for non-finance people. Routledge India.
Kharitonova, E., Kharitonova, N. and Litvinov, I., 2022. Applied Methodology for the Formation of Predictive Financial Statements
of an Industrial Enterprise, Taking into Account the Influence of the COVID-19 Factor. In International Scientific and
Practical Conference Digital and Information Technologies in Economics and Management (pp. 256-268). Springer, Cham.
Lessambo, F. I., 2018. Financial Statements. Analysis and Reporting.
Lipson, M. L., 2019. Financial analytics toolkit: Financial statement forecasting. Darden Case No. UVA-F-1928.
Nitani, M., Riding, A. and He, B., 2019. On equity crowdfunding: investor rationality and success factors. Venture Capital. 21(2-3).
pp.243-272.
Njowa, G. and Musingwini, C., 2018. A framework for interfacing mineral asset valuation and financial reporting. Resources Policy.
56. pp.3-15.
Ong, S. Y., Moroney, R. and Xiao, X., 2022. How do key audit matter characteristics combine to impact financial statement
understandability?. Accounting & Finance. 62(1). pp.805-835.
Prasoona, J. and Reddy, R. G., 2021. Analysis of financial statements. Biotica Research Today. 3(5). pp.373-375.
Stuebs and et.al., 2022. Brittney’s Boutique: Tailoring financial statements for function as well as fashion. Journal of Accounting
Education. 58. p.100768.
1 out of 11
Your All-in-One AI-Powered Toolkit for Academic Success.
+13062052269
info@desklib.com
Available 24*7 on WhatsApp / Email
![[object Object]](/_next/static/media/star-bottom.7253800d.svg)
Unlock your academic potential
Copyright © 2020–2026 A2Z Services. All Rights Reserved. Developed and managed by ZUCOL.