ABC Restaurant Chain: Financial Analysis and Decision Making

Verified

Added on  2023/04/22

|12
|745
|453
Report
AI Summary
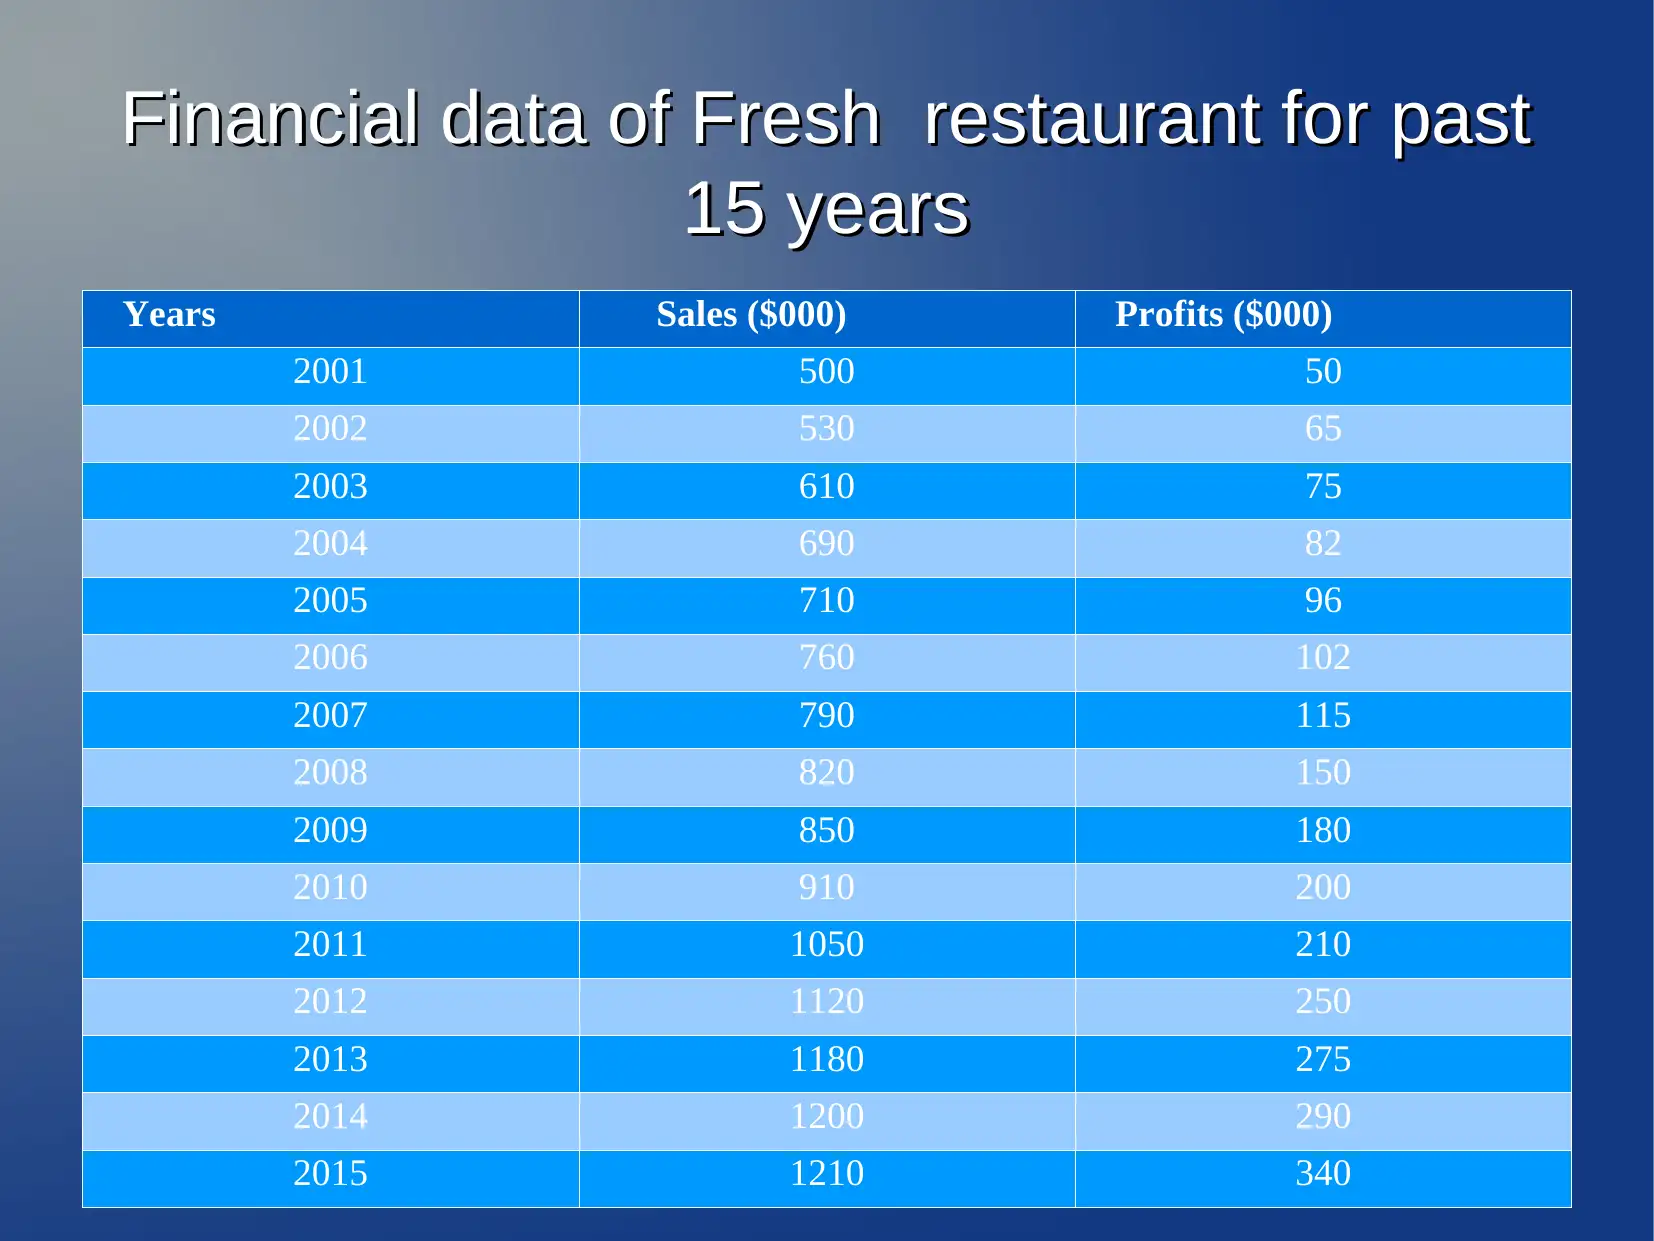
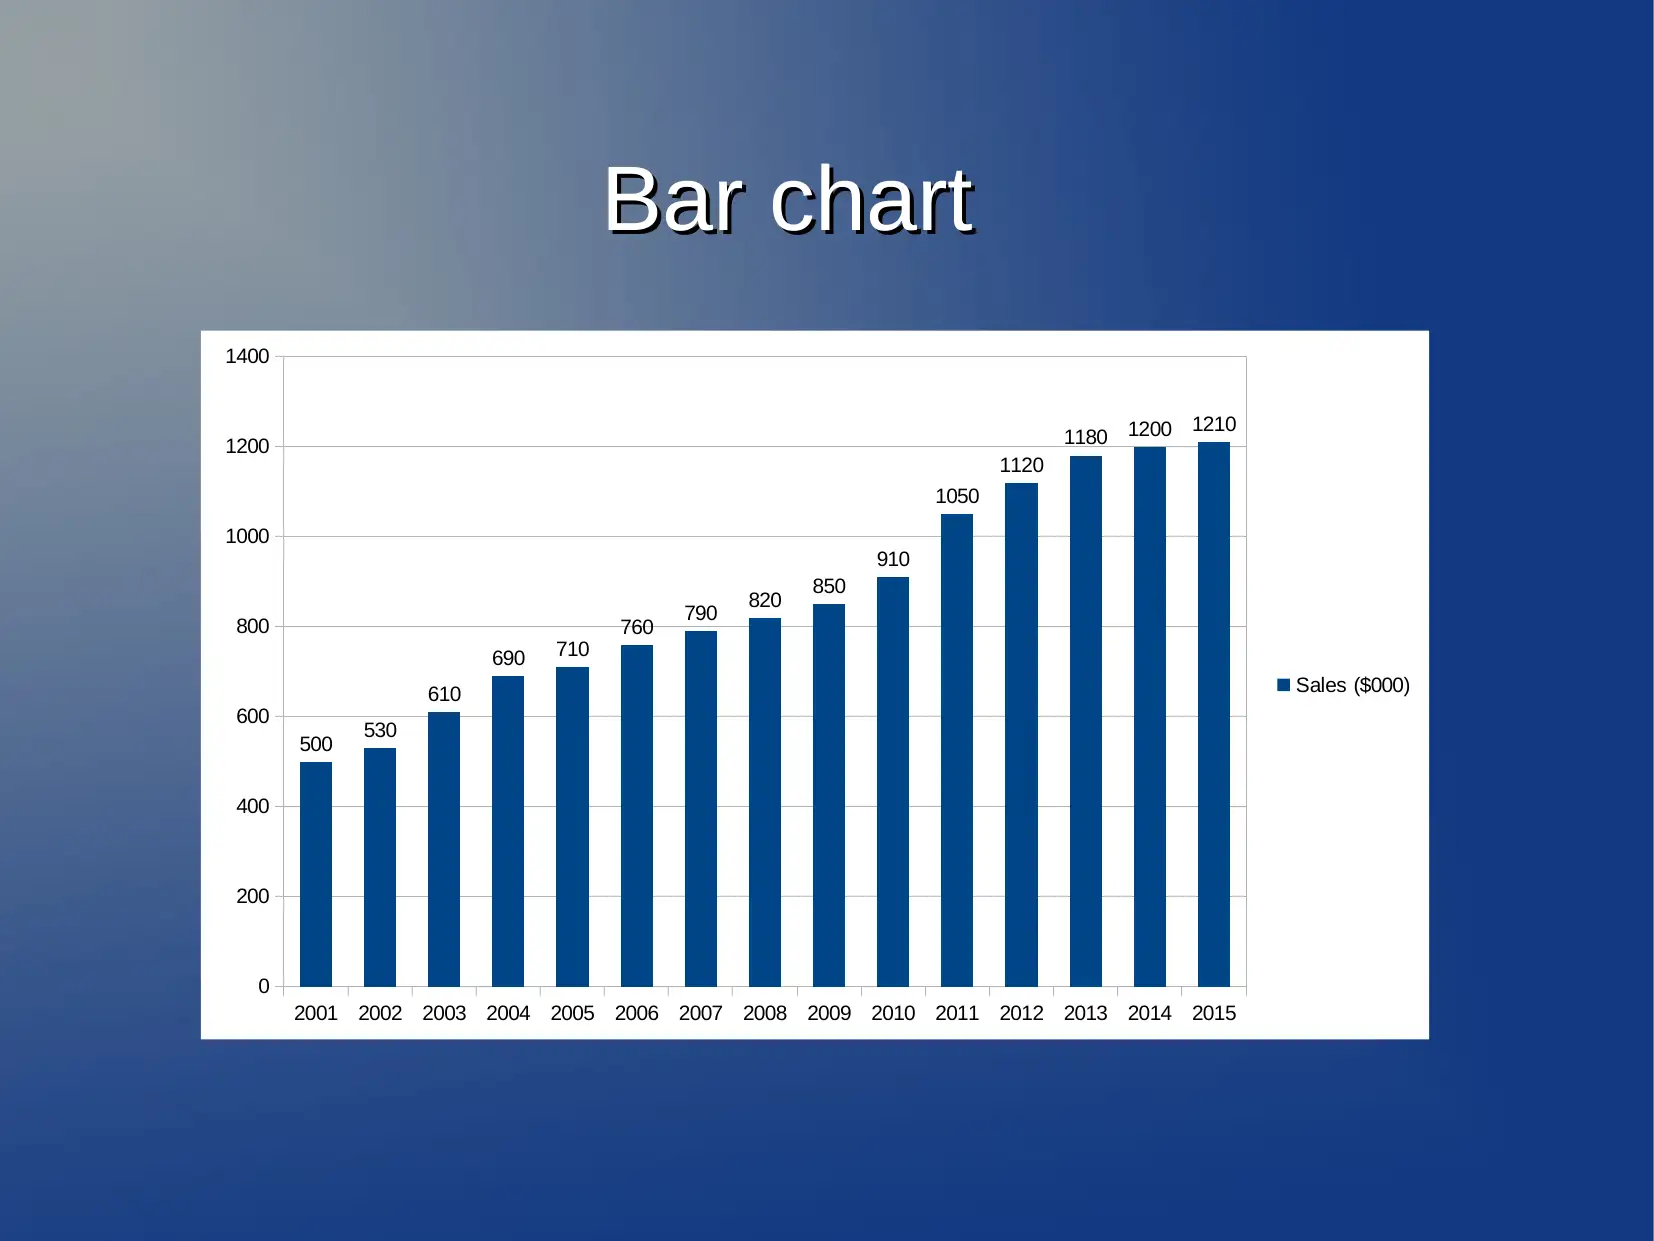
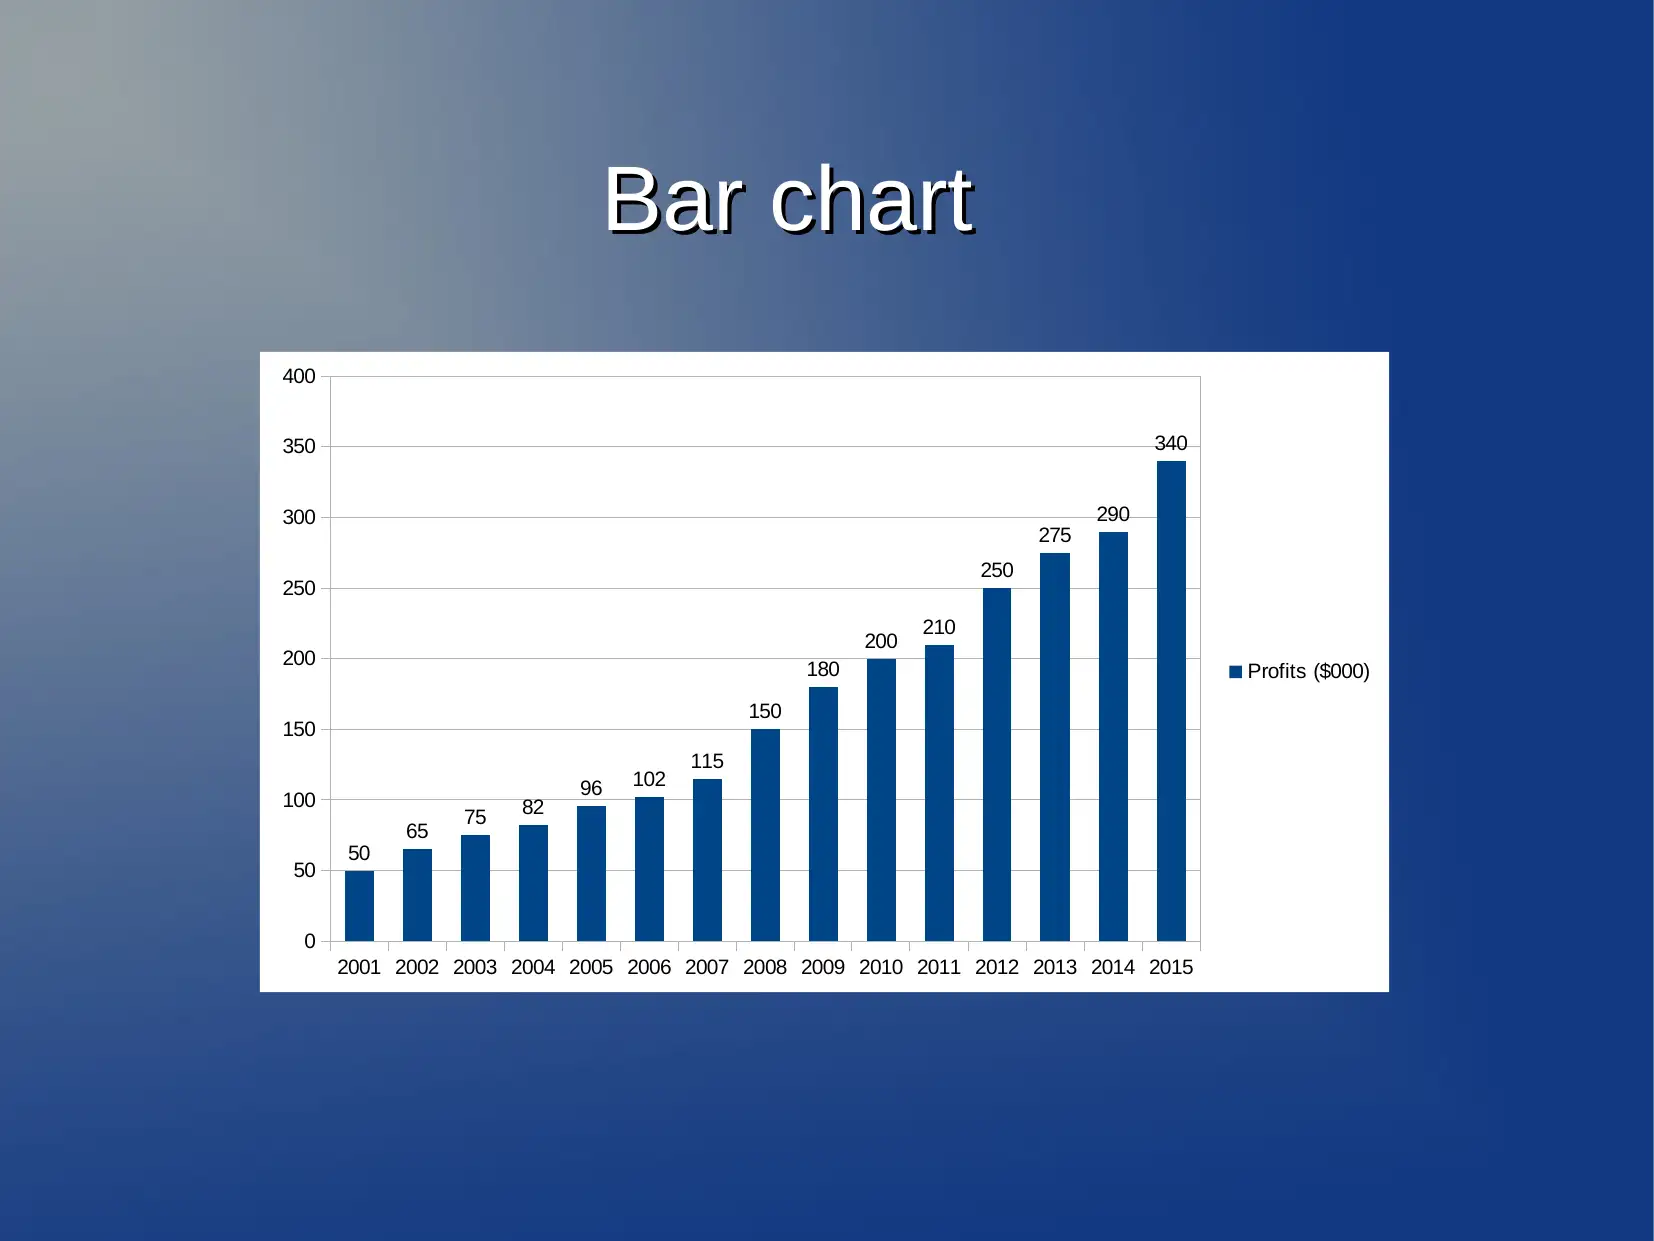
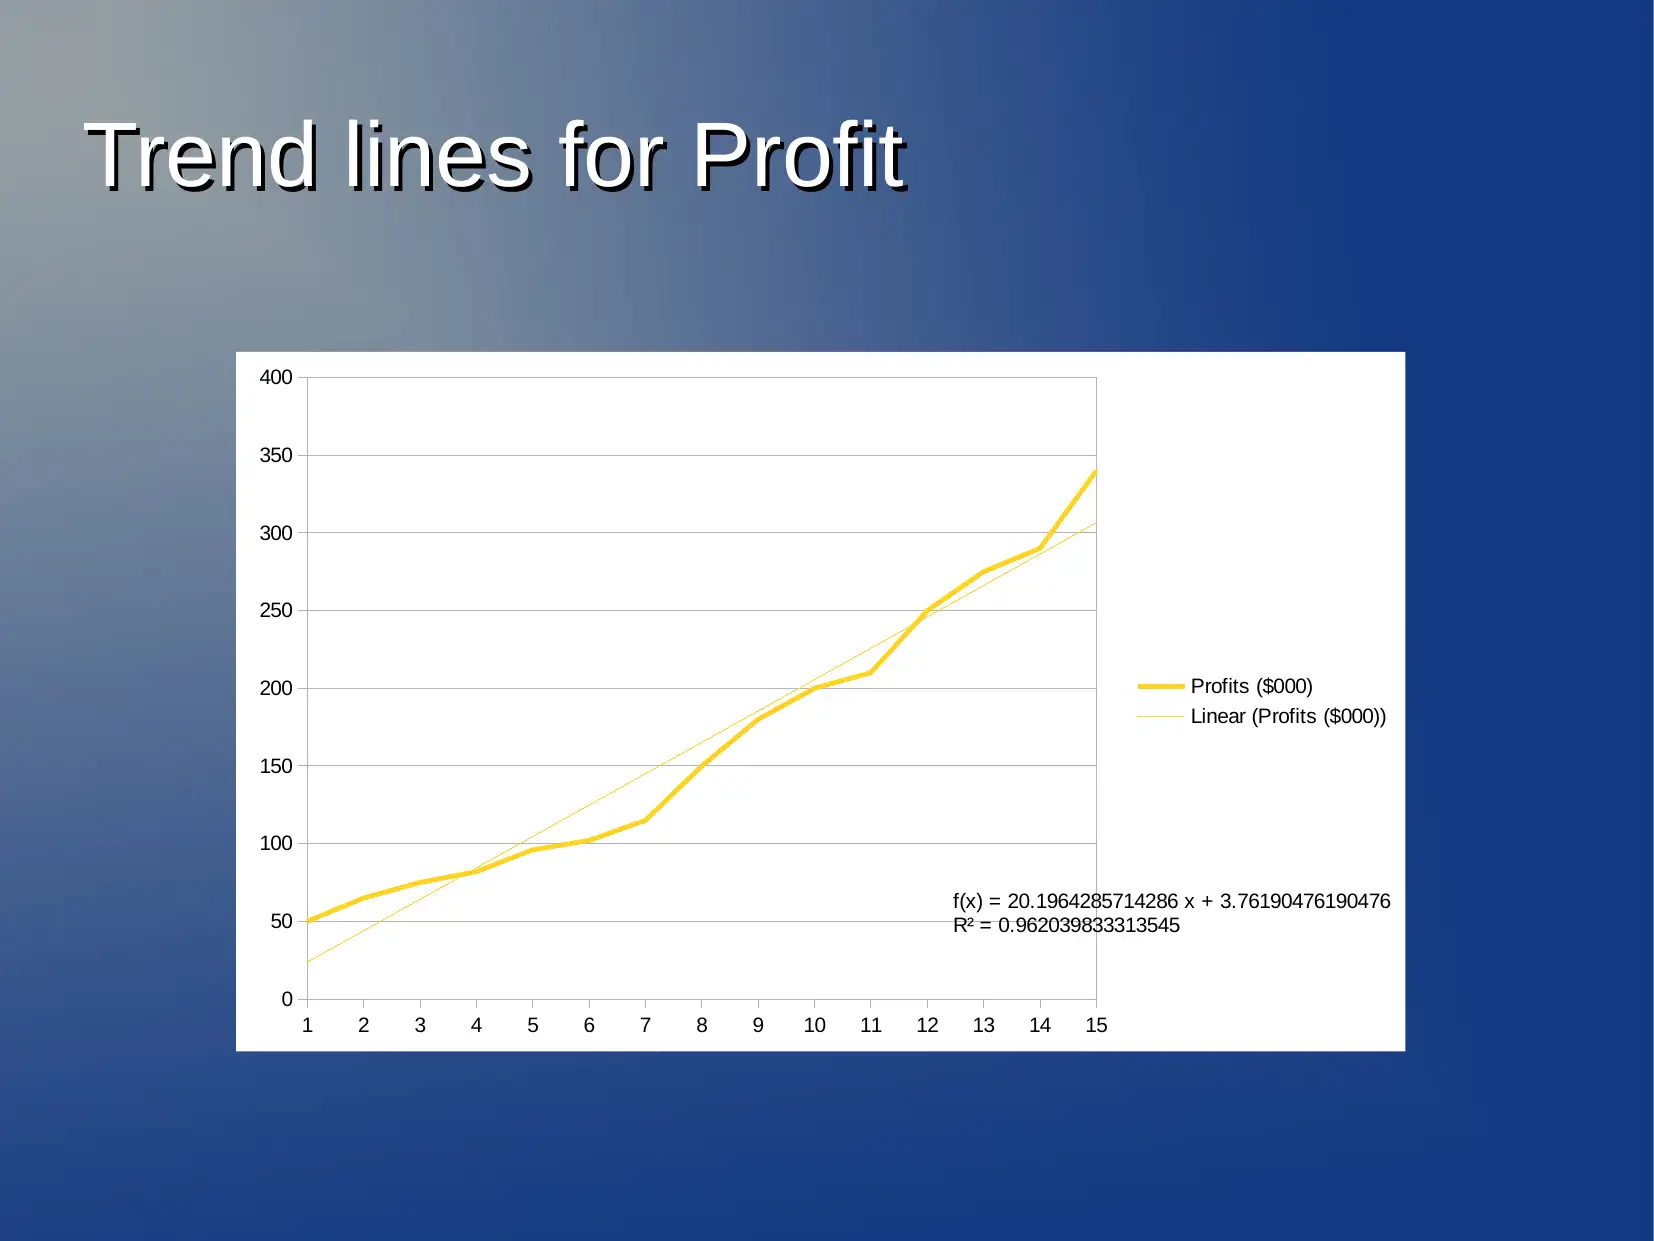
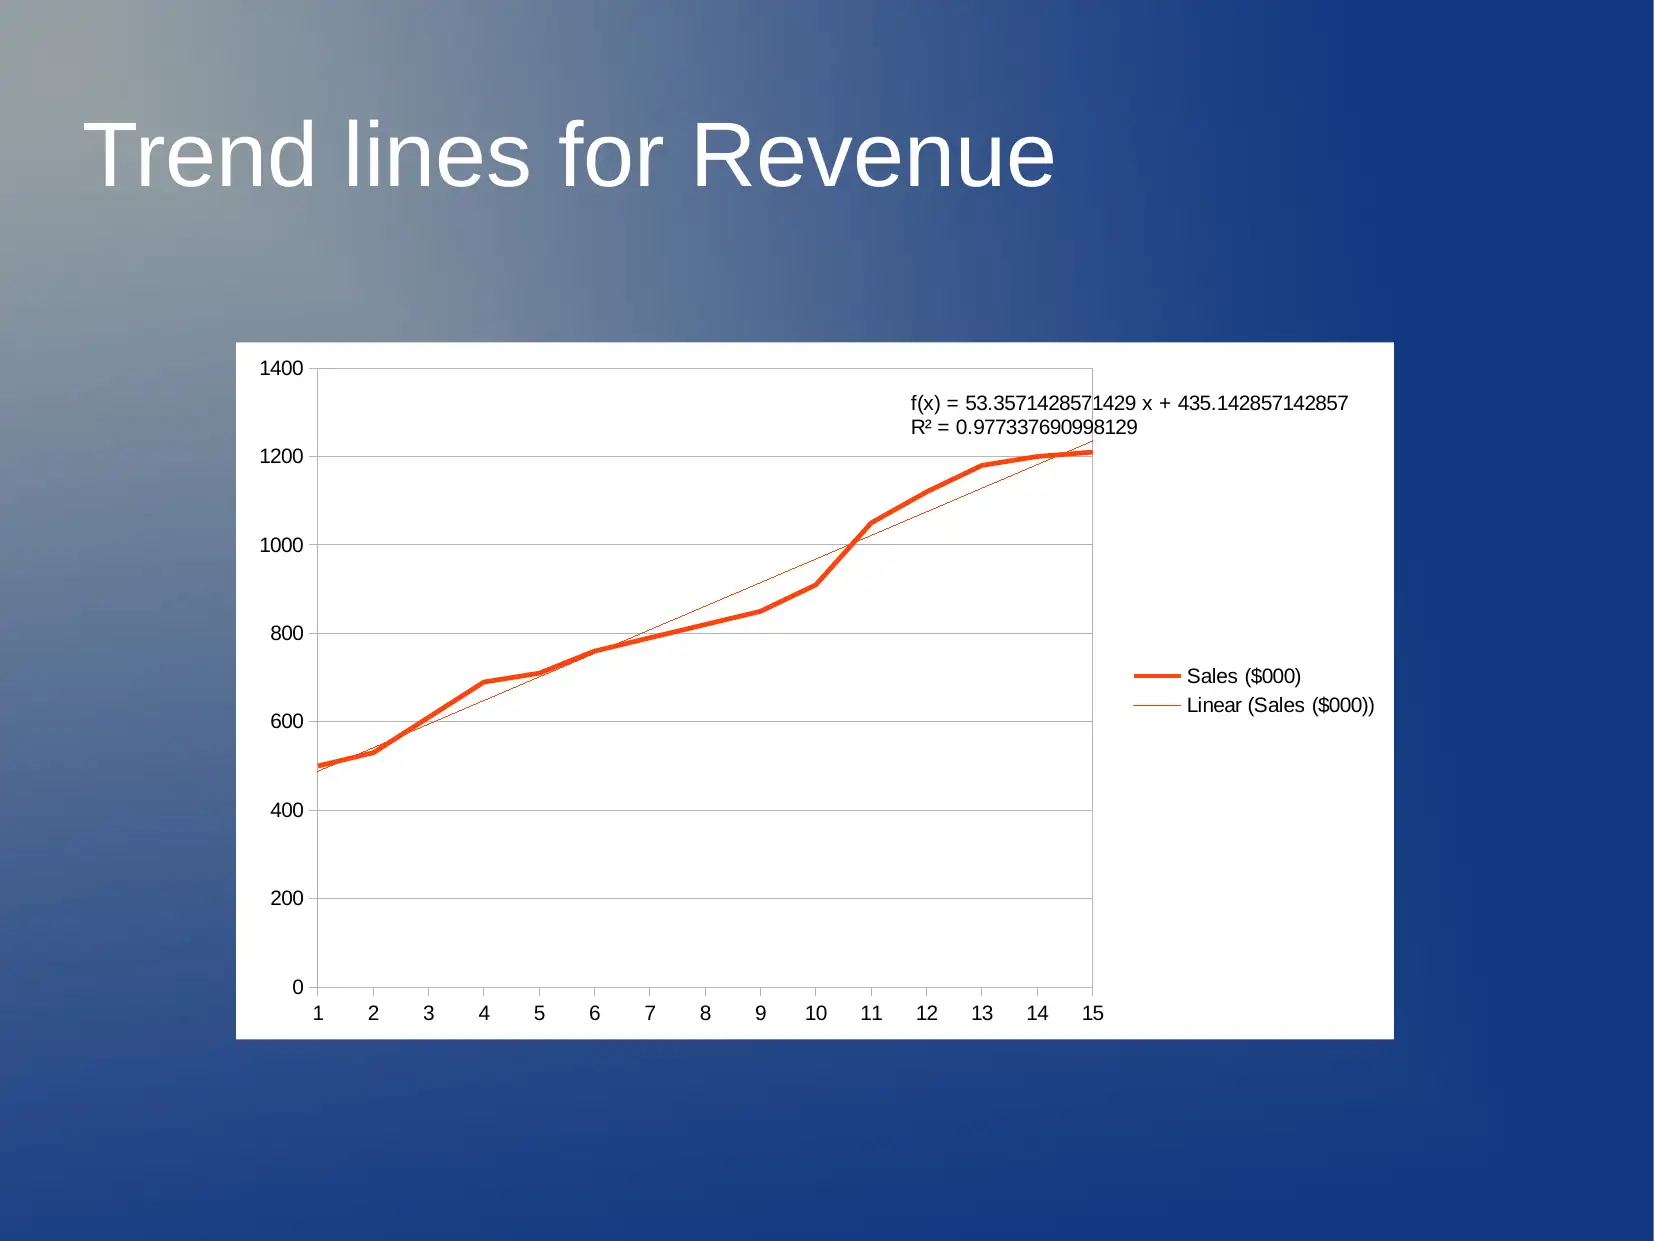
This report presents a financial analysis of the ABC restaurant chain, focusing on the performance of Fresh Restaurant over a 15-year period. The analysis includes sales and profit data, presented visually through bar charts and trend lines. The interpretation of the graphs highlights the upward trends in both sales and profits, indicating a positive outlook for future performance. The report uses R-squared values to demonstrate the strong linear relationship between sales and profits. The findings suggest favorable past performance and potential for future growth, supporting the viability of opening a new restaurant. The report concludes that the company's performance is expected to improve in the future. The report provides references to support the analysis.
Document Page
Business Decision MakingBusiness Decision Making
ABC restaurant chain
tabler-icon-diamond-filled.svg

Paraphrase This Document

Need a fresh take? Get an instant paraphrase of this document with our AI Paraphraser
Document Page
Financial data of Fresh restaurant for pastFinancial data of Fresh restaurant for past
15 years15 years
Years Sales ($000) Profits ($000)
2001 500 50
2002 530 65
2003 610 75
2004 690 82
2005 710 96
2006 760 102
2007 790 115
2008 820 150
2009 850 180
2010 910 200
2011 1050 210
2012 1120 250
2013 1180 275
2014 1200 290
2015 1210 340
Document Page
Bar chartBar chart
2001 2002 2003 2004 2005 2006 2007 2008 2009 2010 2011 2012 2013 2014 2015
0
200
400
600
800
1000
1200
1400
500 530
610
690 710
760 790 820 850
910
1050
1120
1180 1200 1210
Sales ($000)
Document Page
Bar chartBar chart
2001 2002 2003 2004 2005 2006 2007 2008 2009 2010 2011 2012 2013 2014 2015
0
50
100
150
200
250
300
350
400
50
65 75 82 96 102 115
150
180
200 210
250
275
290
340
Profits ($000)
tabler-icon-diamond-filled.svg

Paraphrase This Document

Need a fresh take? Get an instant paraphrase of this document with our AI Paraphraser
Document Page
Trend lines for ProfitTrend lines for Profit
1 2 3 4 5 6 7 8 9 10 11 12 13 14 15
0
50
100
150
200
250
300
350
400
f(x) = 20.1964285714286 x + 3.76190476190476
R² = 0.962039833313545
Profits ($000)
Linear (Profits ($000))
Document Page
InterpretationInterpretation
The line graph above represents trend of profits in future on the basis pf past
years performance/. Along with this the R2 value is also represented that shows
the linear relationship between profits and sales. The value is .96 for profits that
representing a positive and higher trend towards the future. It can also be said
that the trend line is moving in upward direction that is indicating that company
is going to earn improved profit in future as well. The forecasting says that the
company will earn profits, hence, it can go for opening a new restaurant.
Document Page
Trend lines for Revenue
1 2 3 4 5 6 7 8 9 10 11 12 13 14 15
0
200
400
600
800
1000
1200
1400
f(x) = 53.3571428571429 x + 435.142857142857
R² = 0.977337690998129
Sales ($000)
Linear (Sales ($000))
tabler-icon-diamond-filled.svg

Paraphrase This Document

Need a fresh take? Get an instant paraphrase of this document with our AI Paraphraser
Document Page
InterpretationInterpretation
The graph above is showing that the sales of exiting restaurant chain is
continuously increasing as the line graph is moving upwards direction. The trend
line is also moving to the upwards direction with the line graph that representing
that company has earned improved and higher sales in all the years. However , it
can be said that the marketing and advertising strategy have played significant
role. The customers are also happy with the service and product quality of
company as sales of company is continuously increasing. The value of R2 is .98
that is showing a positive tread for future, in future the restaurant will earn high
profits. Hence, it can be said that the new business will earn good profits in future,
hence the business proposal is viable.
Document Page
FindingsFindings
From the whole analysis, identified that the past performance of
restaurant in terms of profits and sales was favorable as both
the variable are highly correlated that represent the
opportunities of earning higher profits and sales in future.
Document Page
ConclusionConclusion
The above report represented a systematic plan for primary
and secondary data collection and use of financial and
statistical tools to assess the viability of project. Overall , it
can be said that performance of company is going to be
improved in future in respect of sales and profits.
tabler-icon-diamond-filled.svg

Paraphrase This Document

Need a fresh take? Get an instant paraphrase of this document with our AI Paraphraser
Document Page
REFERENCESREFERENCES
Chan, S. T. F. and et.al., 2001. Investment appraisal techniques for advanced
manufacturing technology (AMT): a literature review. Integrated Manufacturing
Systems. 12(1). pp.35 – 47
.Kimmel, P. D., Weygandt, J. and Kieso, D. E., 2010. Financial Accounting:
Tools for Business Decision Making. John Wiley & Sons.
Theoharakis and et. al., 2007. Insights into factors affecting production and
operations management (POM) journal evaluation. Journal of operations
management. 25(4). pp.932-955.
Wiley J. and Sons, 2007. Commercial Awareness and Business Decision Making
Skills: How to understand and analyse company financial information.
Butterworth-Heinemann.
Document Page
Thank You
chevron_up_icon
1 out of 12
circle_padding
hide_on_mobile
zoom_out_icon
[object Object]