BMGT1101 - Investment Decision: Analyzing Restaurant Financial Ratios
VerifiedAdded on 2023/06/12
|8
|949
|407
Report
AI Summary
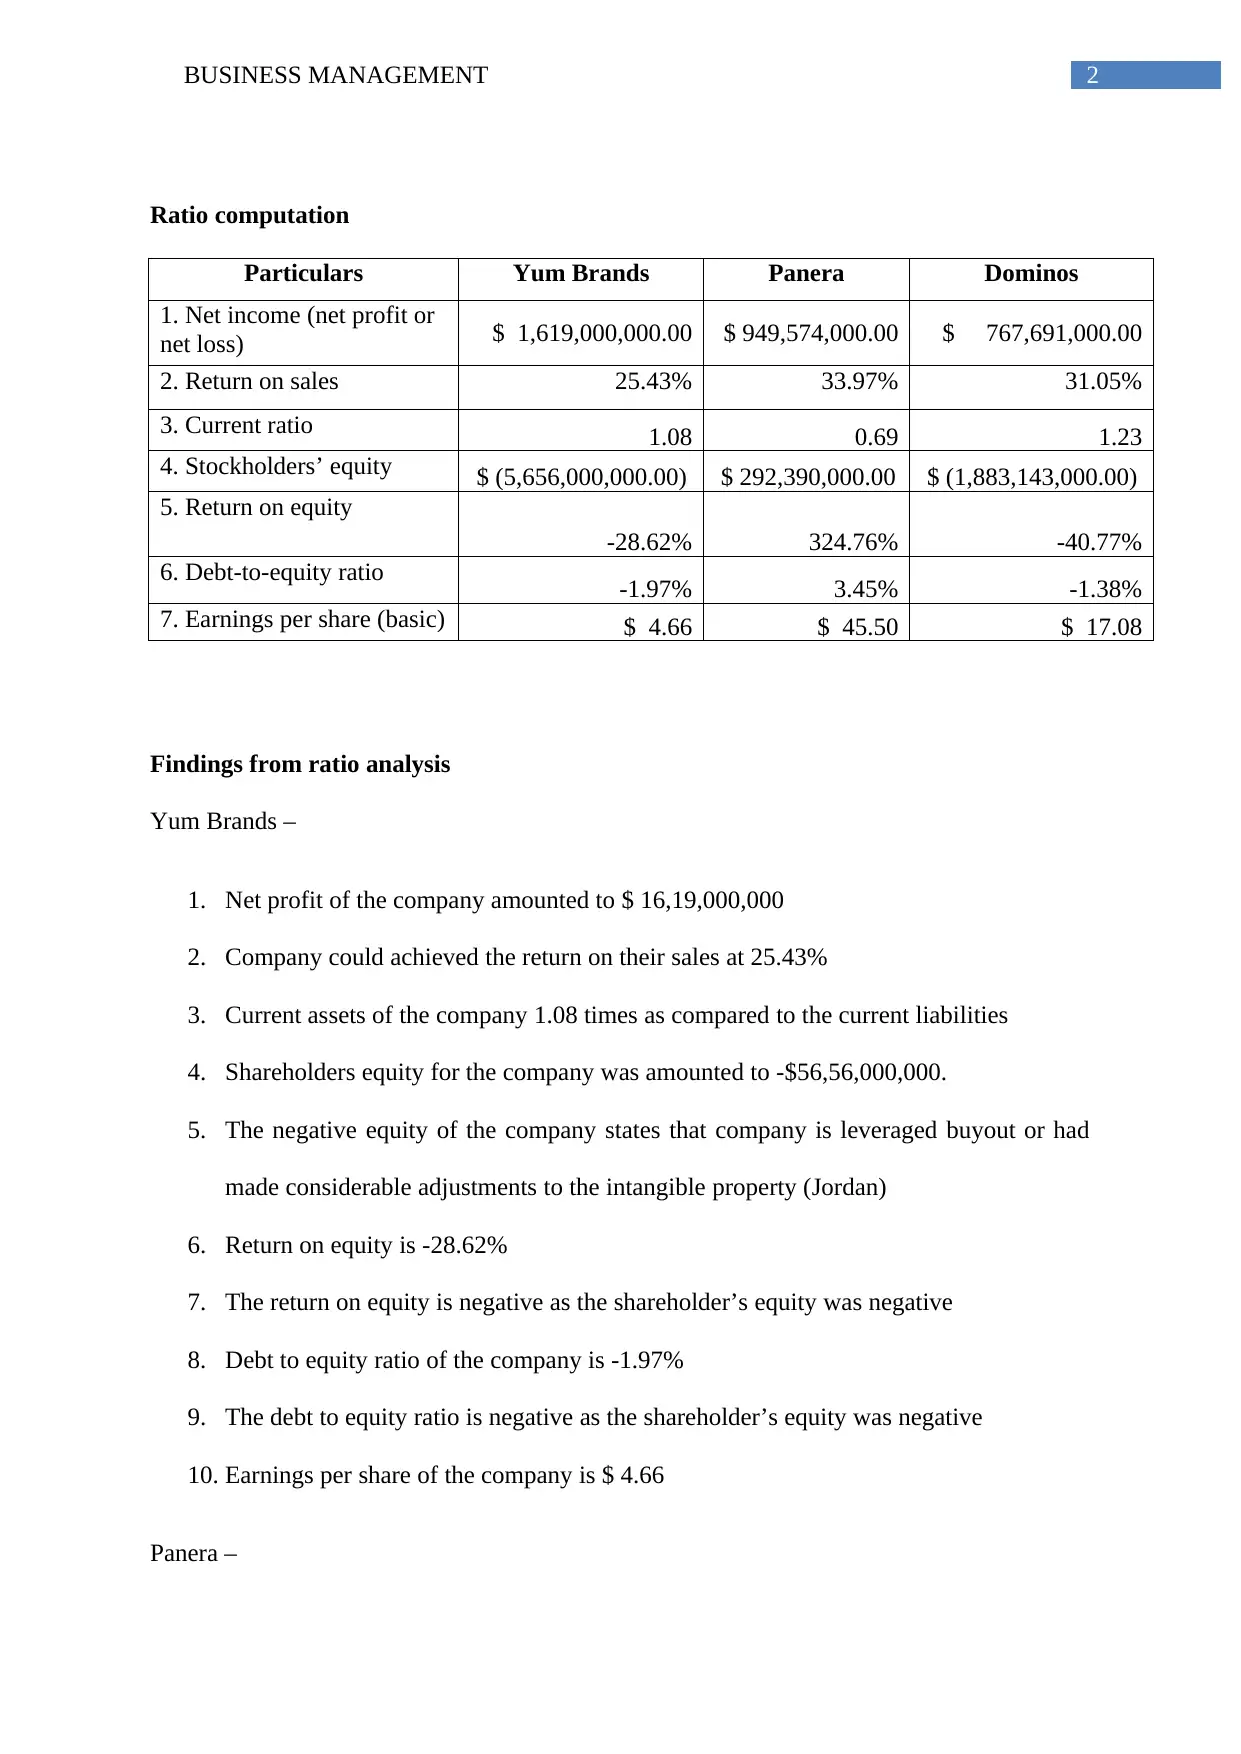
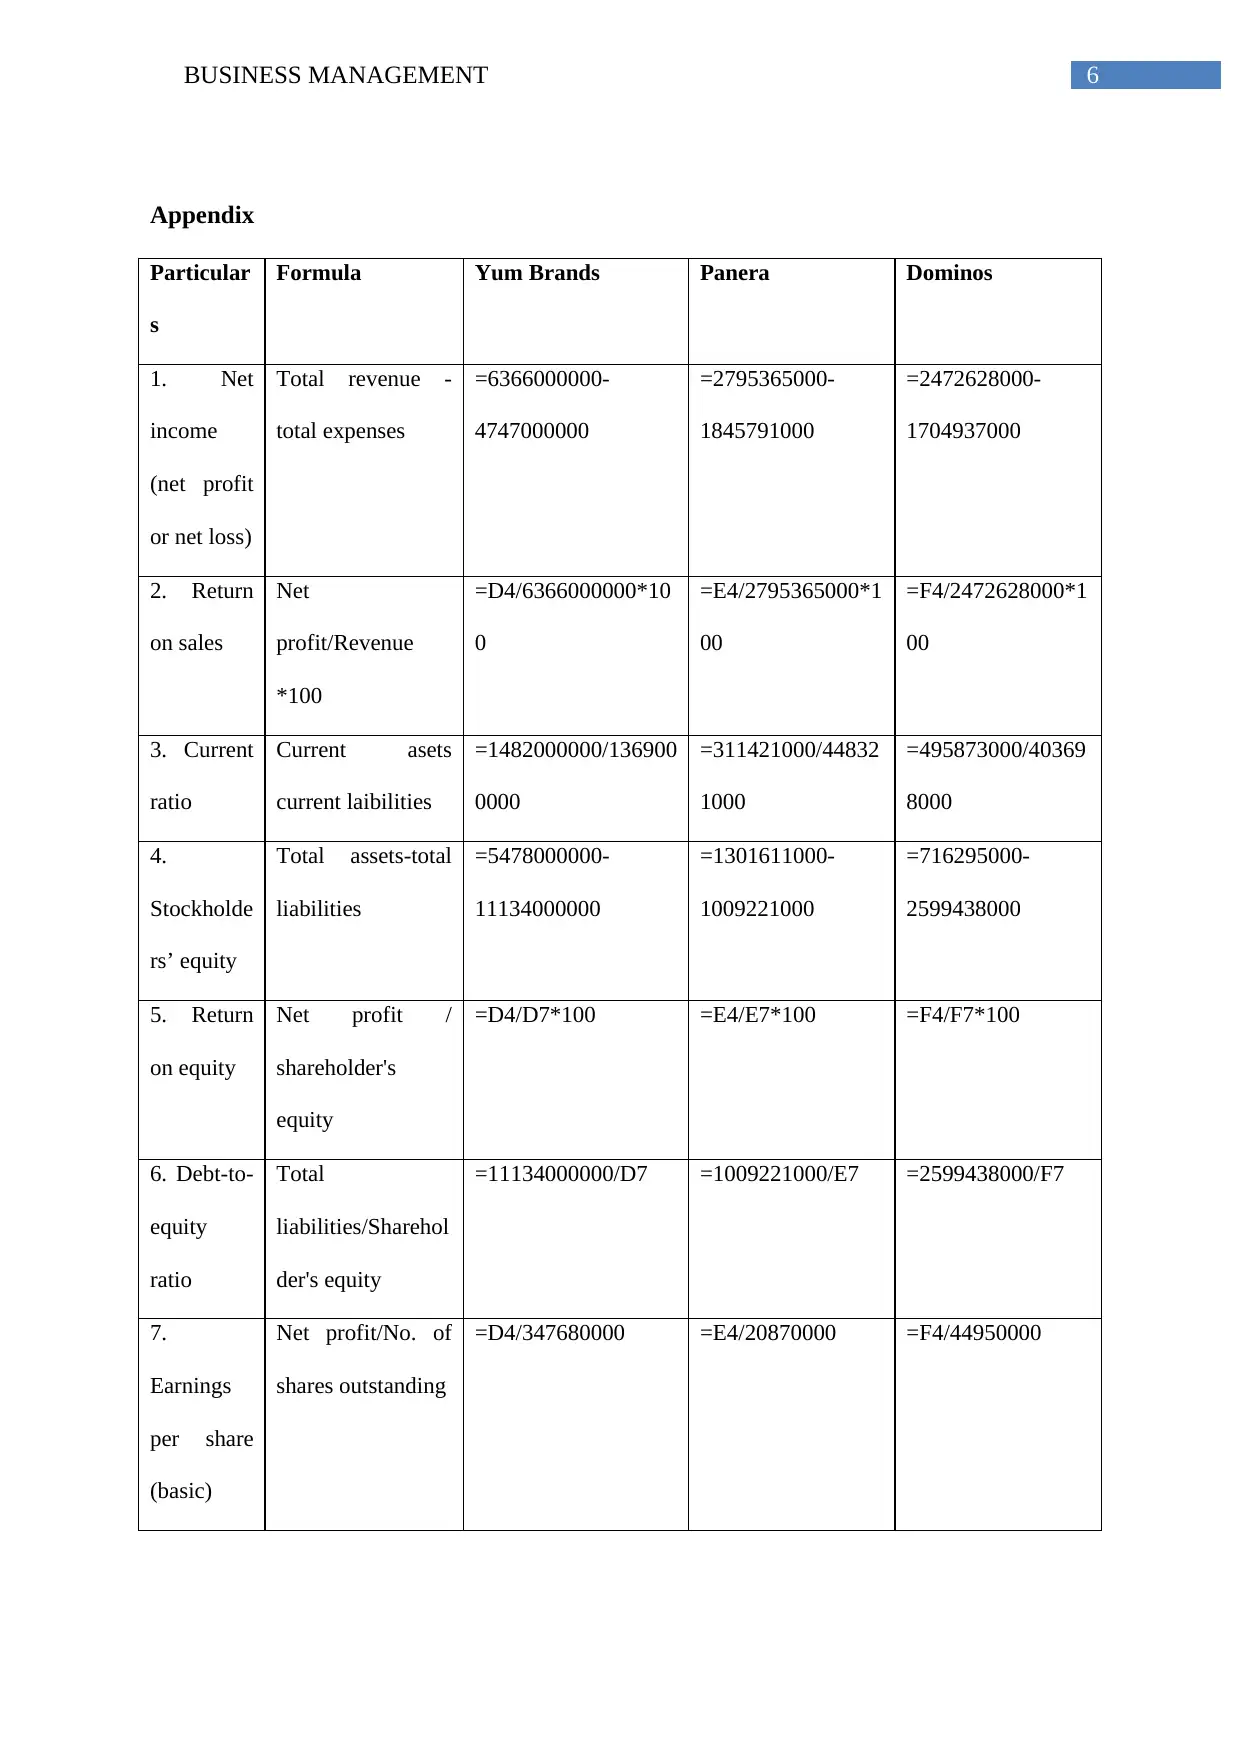
This report provides a financial analysis of three restaurant chains—Yum Brands, Panera, and Dominos—using key financial ratios to determine the best investment opportunity. The analysis includes calculations of net income, return on sales, current ratio, stockholders' equity, return on equity, debt-to-equity ratio, and earnings per share. Findings indicate that while Yum Brands and Dominos have negative shareholders' equity, Panera demonstrates a more stable financial position with positive equity and high return on equity. Qualitative information, including trade tensions with China, further supports the recommendation to invest in Panera. The report concludes that based on the ratio analysis and available information, Panera is the most suitable investment choice due to its positive shareholders' equity and overall financial stability. Desklib provides a platform for students to access this and other solved assignments for academic support.

Running head: BUSINESS MANAGEMENT
Business management
Name of the student
Name of the university
Student ID
Author note
Business management
Name of the student
Name of the university
Student ID
Author note
Paraphrase This Document
Need a fresh take? Get an instant paraphrase of this document with our AI Paraphraser

1BUSINESS MANAGEMENT
Table of Contents
Ratio computation......................................................................................................................2
Findings from ratio analysis.......................................................................................................2
Qualitative information..............................................................................................................4
Choice for investment................................................................................................................4
References..................................................................................................................................5
Appendix....................................................................................................................................6

2BUSINESS MANAGEMENT
Ratio computation
Particulars Yum Brands Panera Dominos
1. Net income (net profit or
net loss) $ 1,619,000,000.00 $ 949,574,000.00 $ 767,691,000.00
2. Return on sales 25.43% 33.97% 31.05%
3. Current ratio 1.08 0.69 1.23
4. Stockholders’ equity $ (5,656,000,000.00) $ 292,390,000.00 $ (1,883,143,000.00)
5. Return on equity
-28.62% 324.76% -40.77%
6. Debt-to-equity ratio -1.97% 3.45% -1.38%
7. Earnings per share (basic) $ 4.66 $ 45.50 $ 17.08
Findings from ratio analysis
Yum Brands –
1. Net profit of the company amounted to $ 16,19,000,000
2. Company could achieved the return on their sales at 25.43%
3. Current assets of the company 1.08 times as compared to the current liabilities
4. Shareholders equity for the company was amounted to -$56,56,000,000.
5. The negative equity of the company states that company is leveraged buyout or had
made considerable adjustments to the intangible property (Jordan)
6. Return on equity is -28.62%
7. The return on equity is negative as the shareholder’s equity was negative
8. Debt to equity ratio of the company is -1.97%
9. The debt to equity ratio is negative as the shareholder’s equity was negative
10. Earnings per share of the company is $ 4.66
Panera –
⊘ This is a preview!⊘
Do you want full access?
Subscribe today to unlock all pages.

Trusted by 1+ million students worldwide

3BUSINESS MANAGEMENT
1. Net profit of the company amounted to $ 949,574,000
2. Company could achieved the return on their sales at 33.97%
3. Current assets of the company 0.69 times as compared to the current liabilities
4. Current ratio states that the short - term assets are not sufficient to pay off the short-
term liabilities (Lundholm, Russell and Richard)
5. Shareholders equity for the company was amounted to $ 292,390,000.
6. Return on equity is 324.76%
7. The return on equity of the company is significantly high as the return of the company
was 33.97%
8. Debt to equity ratio of the company is 3.45%
9. The debt to equity ratio of the company signifying that the company is highly
leveraged
10. Earnings per share of the company is $ 45.50
Dominos –
1. Net profit of the company amounted to $ 767,691,000
2. Company could achieved the return on their sales at 31.05%
3. Current assets of the company 1.23 times as compared to the current liabilities
4. Shareholders equity for the company was amounted to -$18,83,143,000.
5. The negative equity of the company states that company is leveraged buyout or had
made considerable adjustments to the intangible property (Mayo)
6. Return on equity is -40.77%
7. The return on equity is negative as the shareholder’s equity was negative
8. Debt to equity ratio of the company is -1.38%
9. The debt to equity ratio is negative as the shareholder’s equity was negative
10. Earnings per share of the company is $ 17.08
Paraphrase This Document
Need a fresh take? Get an instant paraphrase of this document with our AI Paraphraser

4BUSINESS MANAGEMENT
Qualitative information
As per the Telsey Advisory Group senior analyst and Managing Director, Bob
Derrington, due to trade tensions with China, the restaurant business for US companies may
be affected significantly. Therefore, the investor shall not invest in Yum Brands or Dominos
as their shareholders equity is negative. However, as Panera is still in stable position, the
investor can choose this company for investment (Finance.yahoo.com).
Choice for investment
Based on the ratio analysis and other information Panera is best investment as only
Panera is having positive shareholders equity that is its total assets was more as compared to
total liabilities. On the other hand, the total liabilities of Yum Brands and Dominos were
more as compared to total assets.

5BUSINESS MANAGEMENT
References
Bradford. Fundamentals of investments. McGraw-Hill Higher Education, 2014.
Lundholm, Russell James, and Richard G. Sloan. Equity valuation and analysis with eVal.
McGraw-Hill Irwin, 2013.
Mayo, Herbert B. Investments: an introduction. Cengage Learning, 2013.
YUM : Summary for Yum! Brands, Inc. - Yahoo Finance. Finance.yahoo.com, 2018. Online.
Internet. 24 Apr. 2018. . Available: https://finance.yahoo.com/quote/YUM/.Jordan,
⊘ This is a preview!⊘
Do you want full access?
Subscribe today to unlock all pages.

Trusted by 1+ million students worldwide

6BUSINESS MANAGEMENT
Appendix
Particular
s
Formula Yum Brands Panera Dominos
1. Net
income
(net profit
or net loss)
Total revenue -
total expenses
=6366000000-
4747000000
=2795365000-
1845791000
=2472628000-
1704937000
2. Return
on sales
Net
profit/Revenue
*100
=D4/6366000000*10
0
=E4/2795365000*1
00
=F4/2472628000*1
00
3. Current
ratio
Current asets
current laibilities
=1482000000/136900
0000
=311421000/44832
1000
=495873000/40369
8000
4.
Stockholde
rs’ equity
Total assets-total
liabilities
=5478000000-
11134000000
=1301611000-
1009221000
=716295000-
2599438000
5. Return
on equity
Net profit /
shareholder's
equity
=D4/D7*100 =E4/E7*100 =F4/F7*100
6. Debt-to-
equity
ratio
Total
liabilities/Sharehol
der's equity
=11134000000/D7 =1009221000/E7 =2599438000/F7
7.
Earnings
per share
(basic)
Net profit/No. of
shares outstanding
=D4/347680000 =E4/20870000 =F4/44950000
Paraphrase This Document
Need a fresh take? Get an instant paraphrase of this document with our AI Paraphraser

7BUSINESS MANAGEMENT
1 out of 8

Your All-in-One AI-Powered Toolkit for Academic Success.
+13062052269
info@desklib.com
Available 24*7 on WhatsApp / Email
Unlock your academic potential
Copyright © 2020–2025 A2Z Services. All Rights Reserved. Developed and managed by ZUCOL.