Feasibility Study: Expanding ABC Restaurant Chain in the London Market
VerifiedAdded on 2019/12/03
|20
|4156
|124
Report
AI Summary
This report examines the feasibility of a restaurant chain expanding into London. It begins with a market study, detailing the collection of primary and secondary data to understand customer preferences and industry trends. The report outlines survey methodologies, sampling frames, and a sample questionnaire used to gather customer insights. It then analyzes financial data, including sales and profit figures over a 15-year period, using descriptive statistics such as mean, mode, median, and standard deviation. The analysis provides valid conclusions in a business context, interpreting the data to assess the restaurant's financial performance. Measures of dispersion, including quartiles, percentiles, and range, are used to inform the business scenario. The report also explores the correlation coefficient between sales and profits. Finally, the report presents the data visually through graphs and tables, facilitating future forecasting and decision-making related to the proposed expansion.

BUSINESS DECISION
MAKING
1
MAKING
1
Paraphrase This Document
Need a fresh take? Get an instant paraphrase of this document with our AI Paraphraser
INTRODUCTION
Business decision making is the most crucial aspect of business that allows organization
to have a optimal solution for business problem. The success of business depends upon effective
decision making. The report here deals with the case of existing restaurant chain which is
planning to open its second restaurant in London. This report is aiming at conducting a market
study of customer preferences, financial viability assumptions as well as development of project
scheduling so as to understand the feasibility business proposal. Furthermore, critical path is
designed along with presenting information through graphs and charts.
TASK 1
1.1 Plan for collection primary and secondary data
According to the case scenario, a restaurant chain is willing to open a new restaurant in
London, therefore, it requires information which pertains to internal and external environment of
business. For collecting information, primary as well as secondary data collection methods are
used :
Primary data collection: The major aim of collecting primary information is to assess
the preference of customer for existing services provided by restaurant (Bryde, 2003). In order to
collect the information of customers questionnaire will be prepared and distributed among the
customers. In order to collect primary data, a questionnaire is going to be designed so that
information can be collected from the customers.
Secondary data collection : The sources of collecting secondary data are annual reports
of restaurant chain, books, journals and online articles which include the information of
restaurant industry in UK and London. For conducting effective planning various sales records as
well as other annual reports of restaurant are going to be used (Chan and et.al., 2001).
The collection of primary and secondary information will be helpful in identify the
market opportunities for the new business.
2
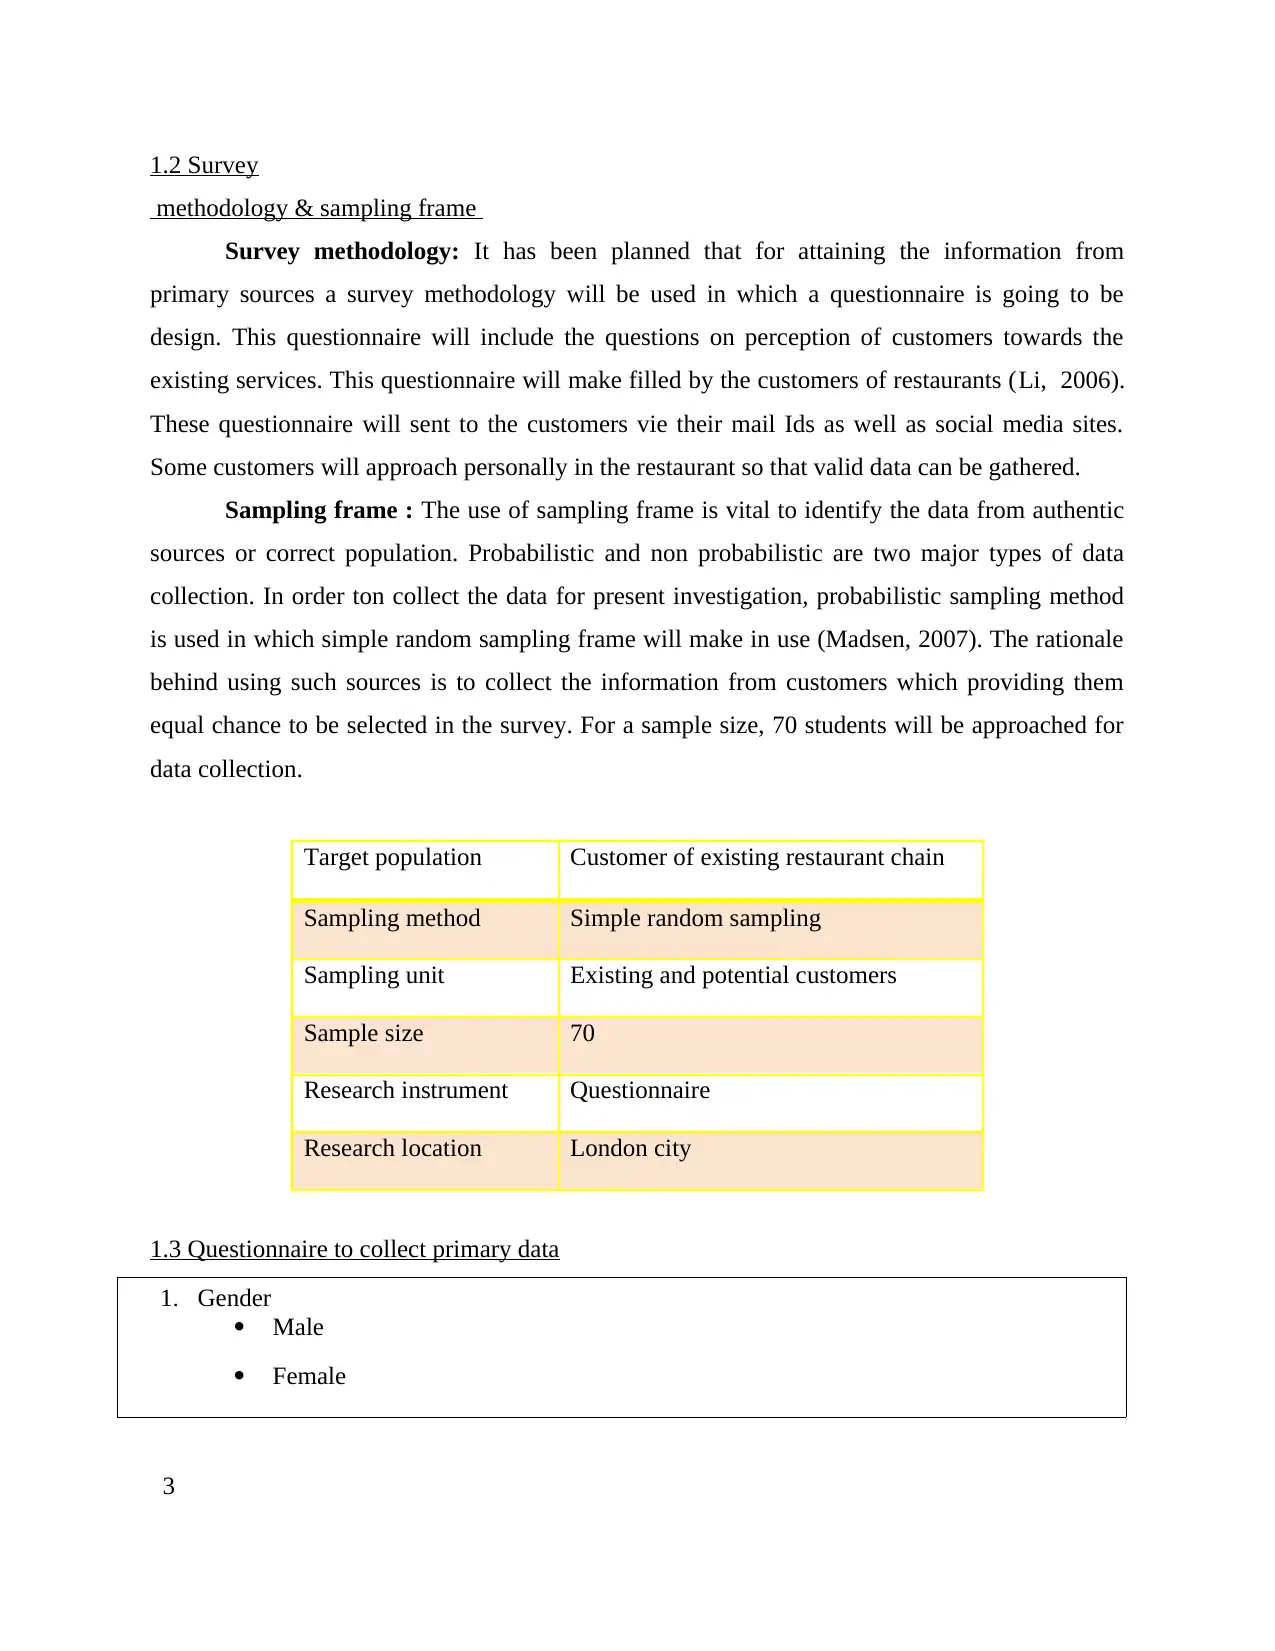
1.2 Survey
methodology & sampling frame
Survey methodology: It has been planned that for attaining the information from
primary sources a survey methodology will be used in which a questionnaire is going to be
design. This questionnaire will include the questions on perception of customers towards the
existing services. This questionnaire will make filled by the customers of restaurants (Li, 2006).
These questionnaire will sent to the customers vie their mail Ids as well as social media sites.
Some customers will approach personally in the restaurant so that valid data can be gathered.
Sampling frame : The use of sampling frame is vital to identify the data from authentic
sources or correct population. Probabilistic and non probabilistic are two major types of data
collection. In order ton collect the data for present investigation, probabilistic sampling method
is used in which simple random sampling frame will make in use (Madsen, 2007). The rationale
behind using such sources is to collect the information from customers which providing them
equal chance to be selected in the survey. For a sample size, 70 students will be approached for
data collection.
Target population Customer of existing restaurant chain
Sampling method Simple random sampling
Sampling unit Existing and potential customers
Sample size 70
Research instrument Questionnaire
Research location London city
1.3 Questionnaire to collect primary data
1. Gender
Male
Female
3
⊘ This is a preview!⊘
Do you want full access?
Subscribe today to unlock all pages.
Trusted by 1+ million students worldwide
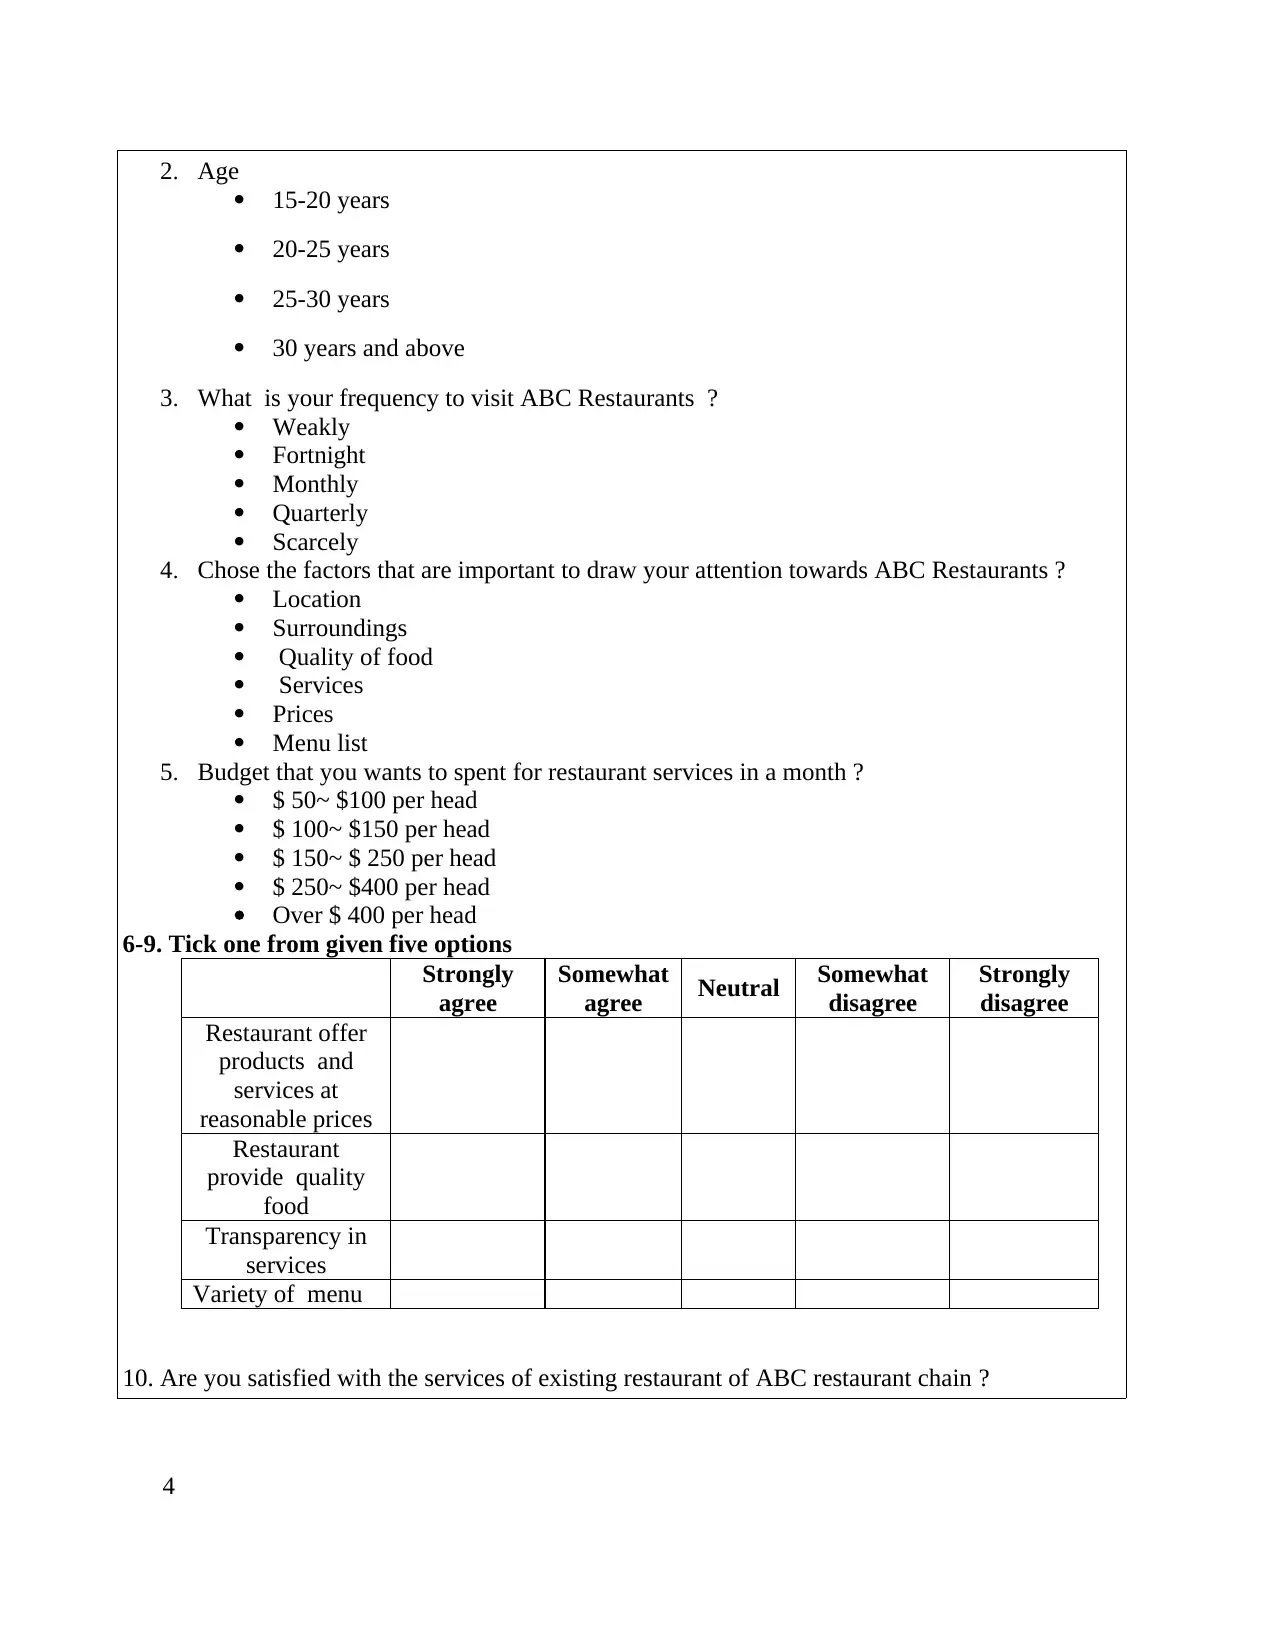
2. Age
15-20 years
20-25 years
25-30 years
30 years and above
3. What is your frequency to visit ABC Restaurants ?
Weakly
Fortnight
Monthly
Quarterly
Scarcely
4. Chose the factors that are important to draw your attention towards ABC Restaurants ?
Location
Surroundings
Quality of food
Services
Prices
Menu list
5. Budget that you wants to spent for restaurant services in a month ?
$ 50~ $100 per head
$ 100~ $150 per head
$ 150~ $ 250 per head
$ 250~ $400 per head
Over $ 400 per head
6-9. Tick one from given five options
Strongly
agree
Somewhat
agree Neutral Somewhat
disagree
Strongly
disagree
Restaurant offer
products and
services at
reasonable prices
Restaurant
provide quality
food
Transparency in
services
Variety of menu
10. Are you satisfied with the services of existing restaurant of ABC restaurant chain ?
4
Paraphrase This Document
Need a fresh take? Get an instant paraphrase of this document with our AI Paraphraser
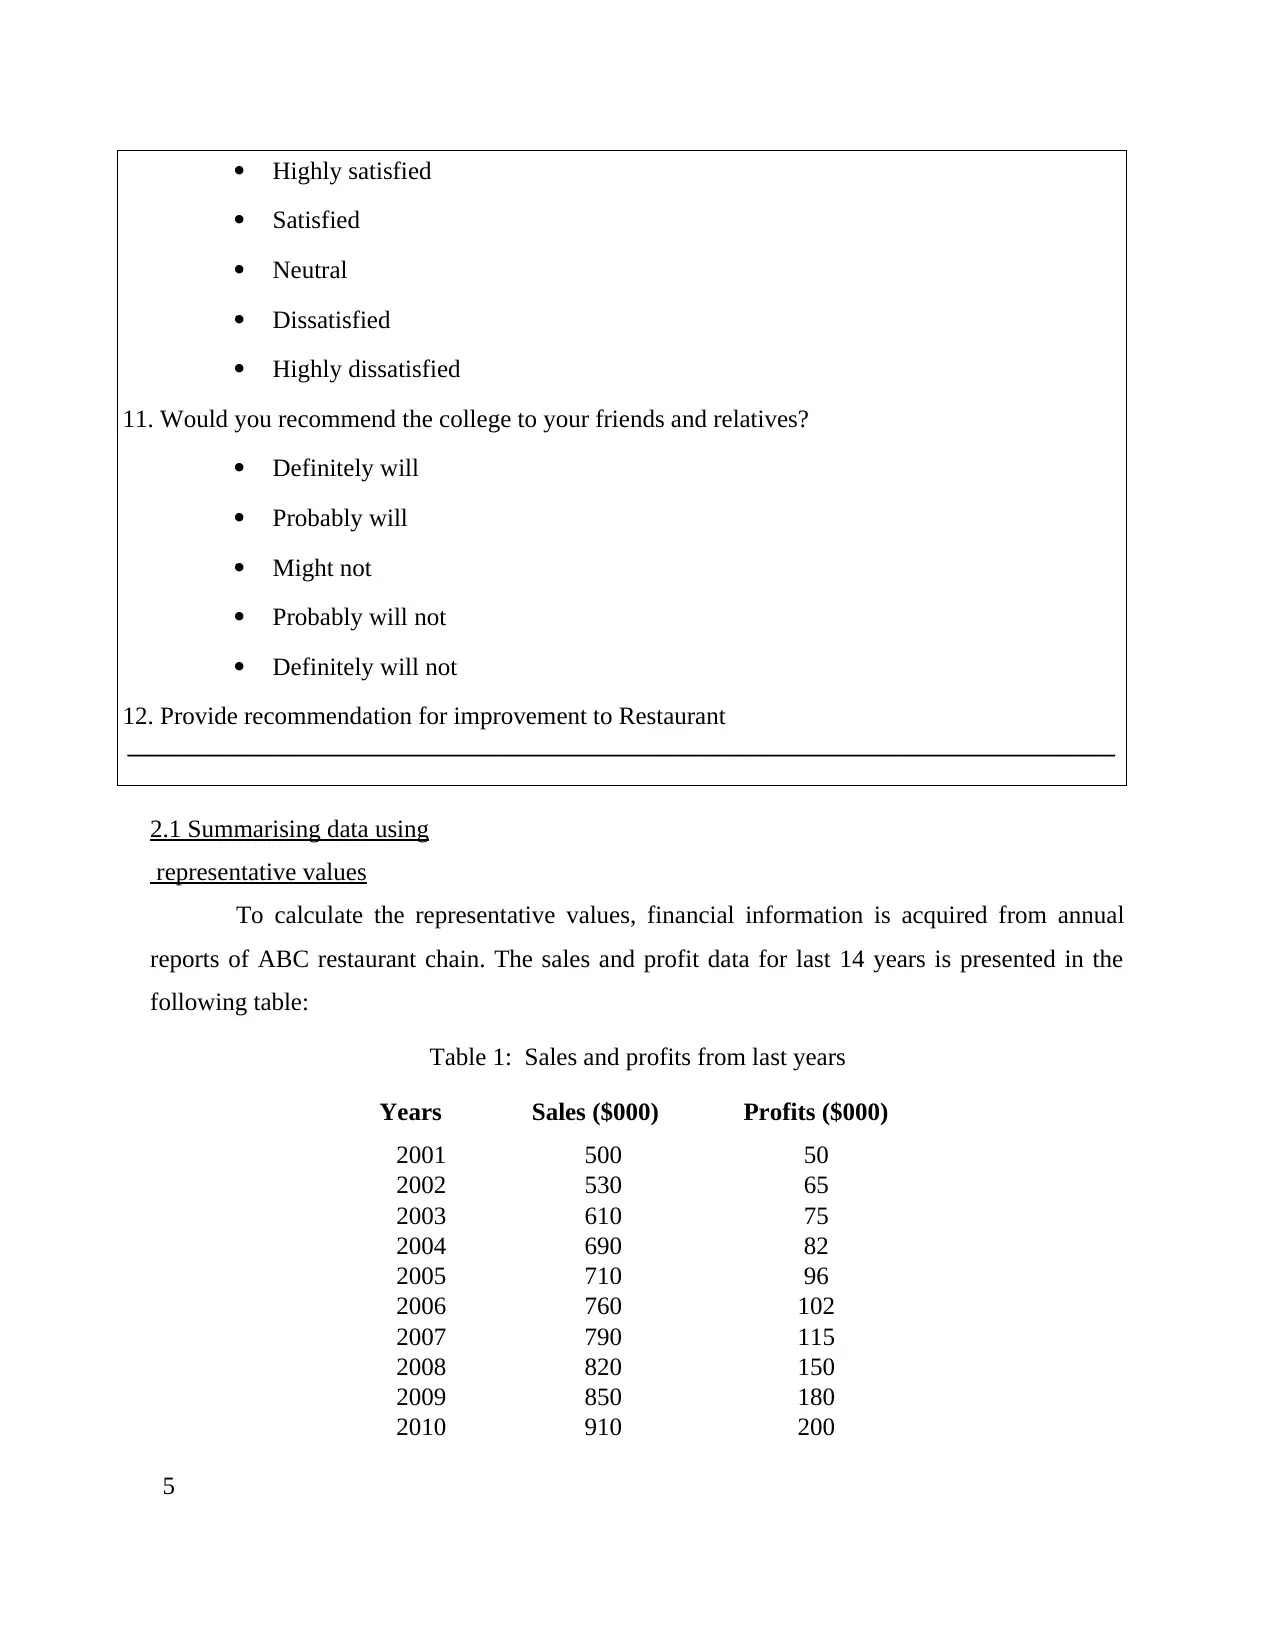
Highly satisfied
Satisfied
Neutral
Dissatisfied
Highly dissatisfied
11. Would you recommend the college to your friends and relatives?
Definitely will
Probably will
Might not
Probably will not
Definitely will not
12. Provide recommendation for improvement to Restaurant
_______________________________________________________________________________
2.1 Summarising data using
representative values
To calculate the representative values, financial information is acquired from annual
reports of ABC restaurant chain. The sales and profit data for last 14 years is presented in the
following table:
Table 1: Sales and profits from last years
Years Sales ($000) Profits ($000)
2001 500 50
2002 530 65
2003 610 75
2004 690 82
2005 710 96
2006 760 102
2007 790 115
2008 820 150
2009 850 180
2010 910 200
5
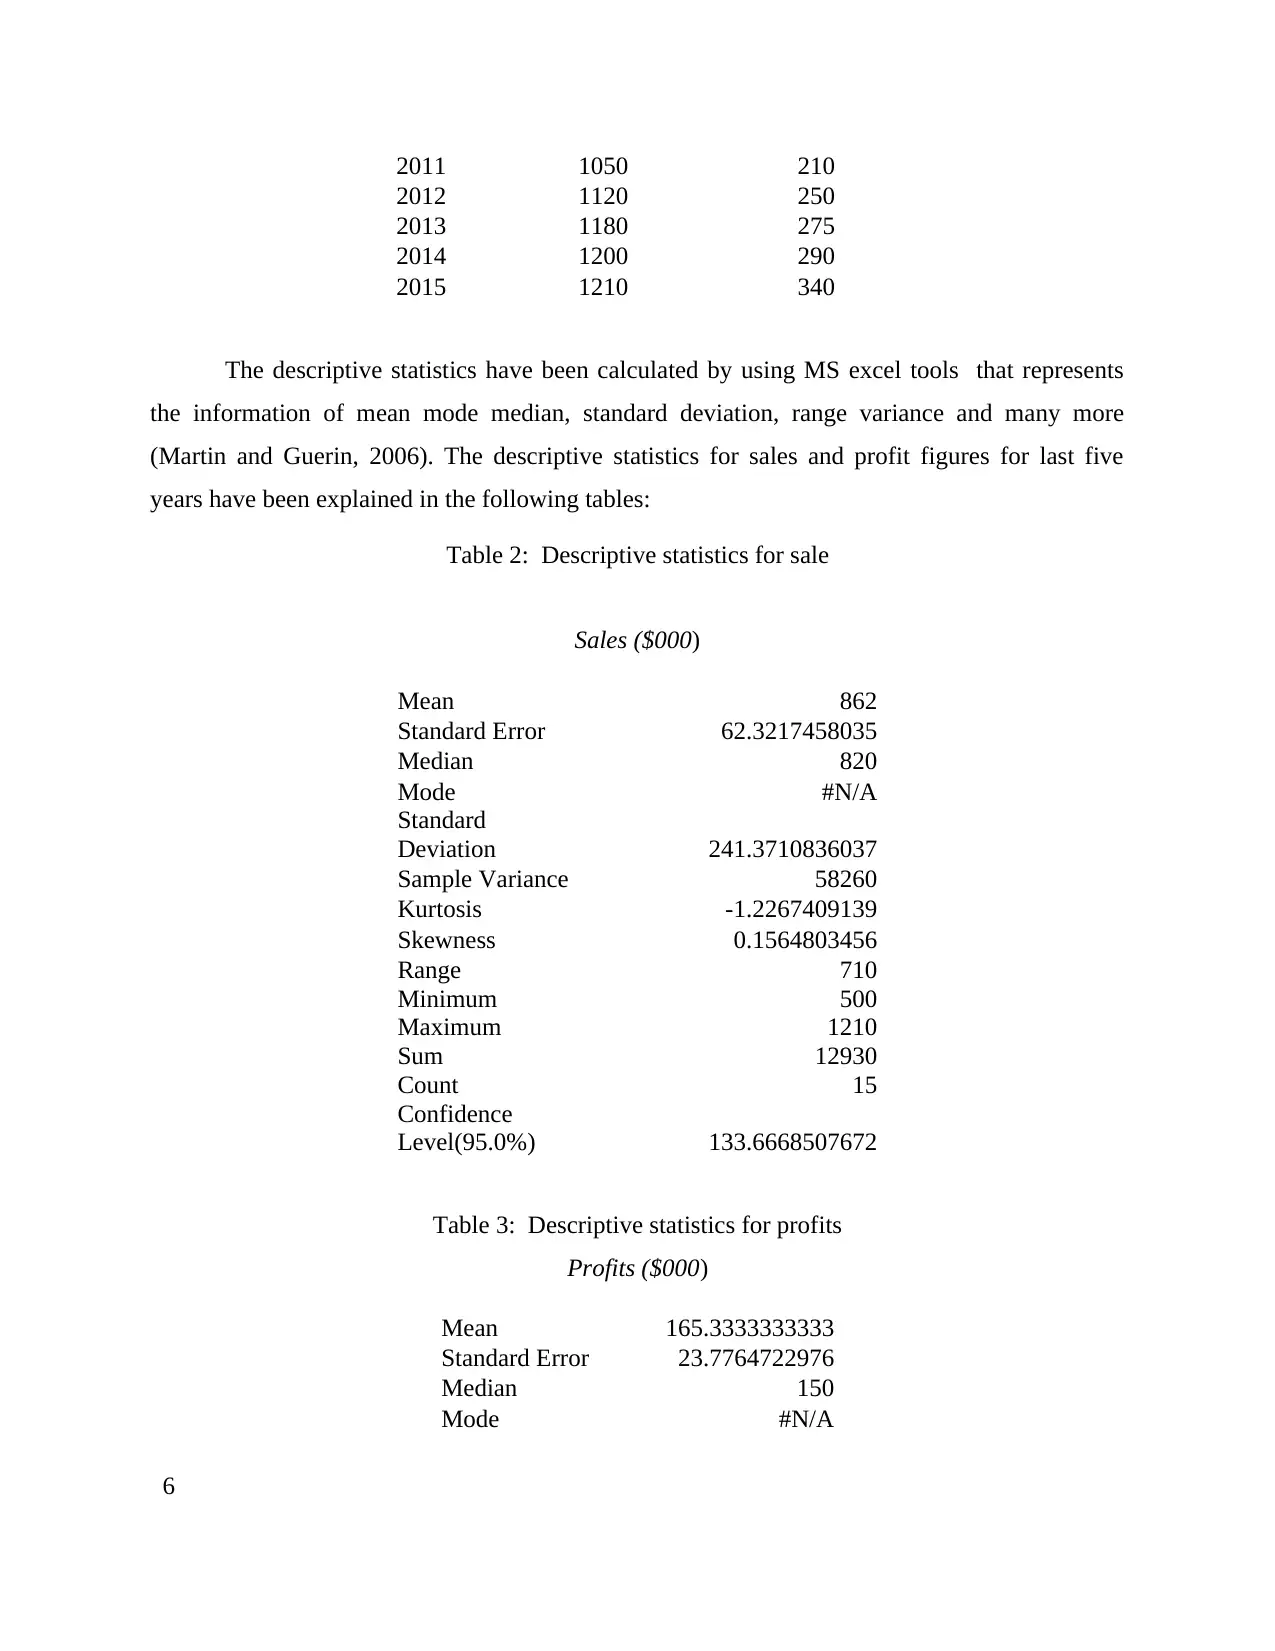
2011 1050 210
2012 1120 250
2013 1180 275
2014 1200 290
2015 1210 340
The descriptive statistics have been calculated by using MS excel tools that represents
the information of mean mode median, standard deviation, range variance and many more
(Martin and Guerin, 2006). The descriptive statistics for sales and profit figures for last five
years have been explained in the following tables:
Table 2: Descriptive statistics for sale
Sales ($000)
Mean 862
Standard Error 62.3217458035
Median 820
Mode #N/A
Standard
Deviation 241.3710836037
Sample Variance 58260
Kurtosis -1.2267409139
Skewness 0.1564803456
Range 710
Minimum 500
Maximum 1210
Sum 12930
Count 15
Confidence
Level(95.0%) 133.6668507672
Table 3: Descriptive statistics for profits
Profits ($000)
Mean 165.3333333333
Standard Error 23.7764722976
Median 150
Mode #N/A
6
⊘ This is a preview!⊘
Do you want full access?
Subscribe today to unlock all pages.
Trusted by 1+ million students worldwide
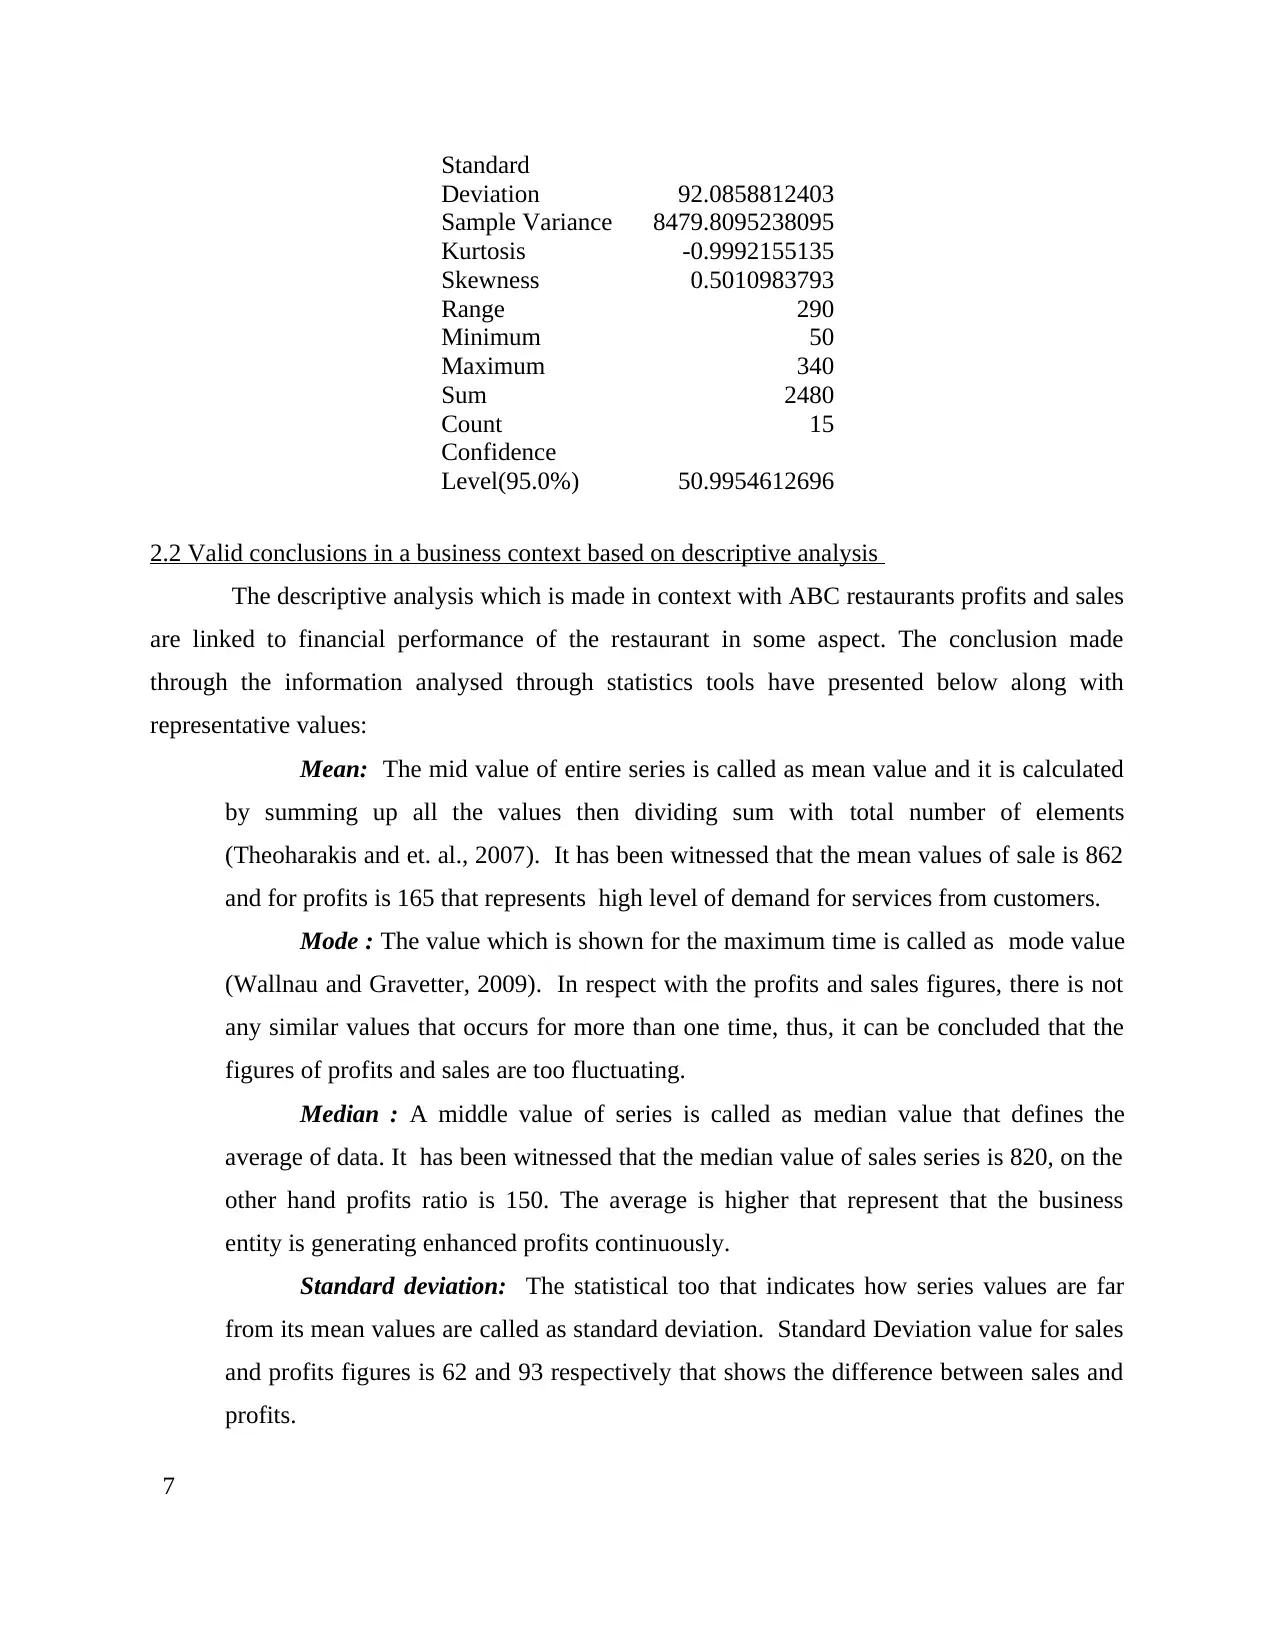
Standard
Deviation 92.0858812403
Sample Variance 8479.8095238095
Kurtosis -0.9992155135
Skewness 0.5010983793
Range 290
Minimum 50
Maximum 340
Sum 2480
Count 15
Confidence
Level(95.0%) 50.9954612696
2.2 Valid conclusions in a business context based on descriptive analysis
The descriptive analysis which is made in context with ABC restaurants profits and sales
are linked to financial performance of the restaurant in some aspect. The conclusion made
through the information analysed through statistics tools have presented below along with
representative values:
Mean: The mid value of entire series is called as mean value and it is calculated
by summing up all the values then dividing sum with total number of elements
(Theoharakis and et. al., 2007). It has been witnessed that the mean values of sale is 862
and for profits is 165 that represents high level of demand for services from customers.
Mode : The value which is shown for the maximum time is called as mode value
(Wallnau and Gravetter, 2009). In respect with the profits and sales figures, there is not
any similar values that occurs for more than one time, thus, it can be concluded that the
figures of profits and sales are too fluctuating.
Median : A middle value of series is called as median value that defines the
average of data. It has been witnessed that the median value of sales series is 820, on the
other hand profits ratio is 150. The average is higher that represent that the business
entity is generating enhanced profits continuously.
Standard deviation: The statistical too that indicates how series values are far
from its mean values are called as standard deviation. Standard Deviation value for sales
and profits figures is 62 and 93 respectively that shows the difference between sales and
profits.
7
Paraphrase This Document
Need a fresh take? Get an instant paraphrase of this document with our AI Paraphraser
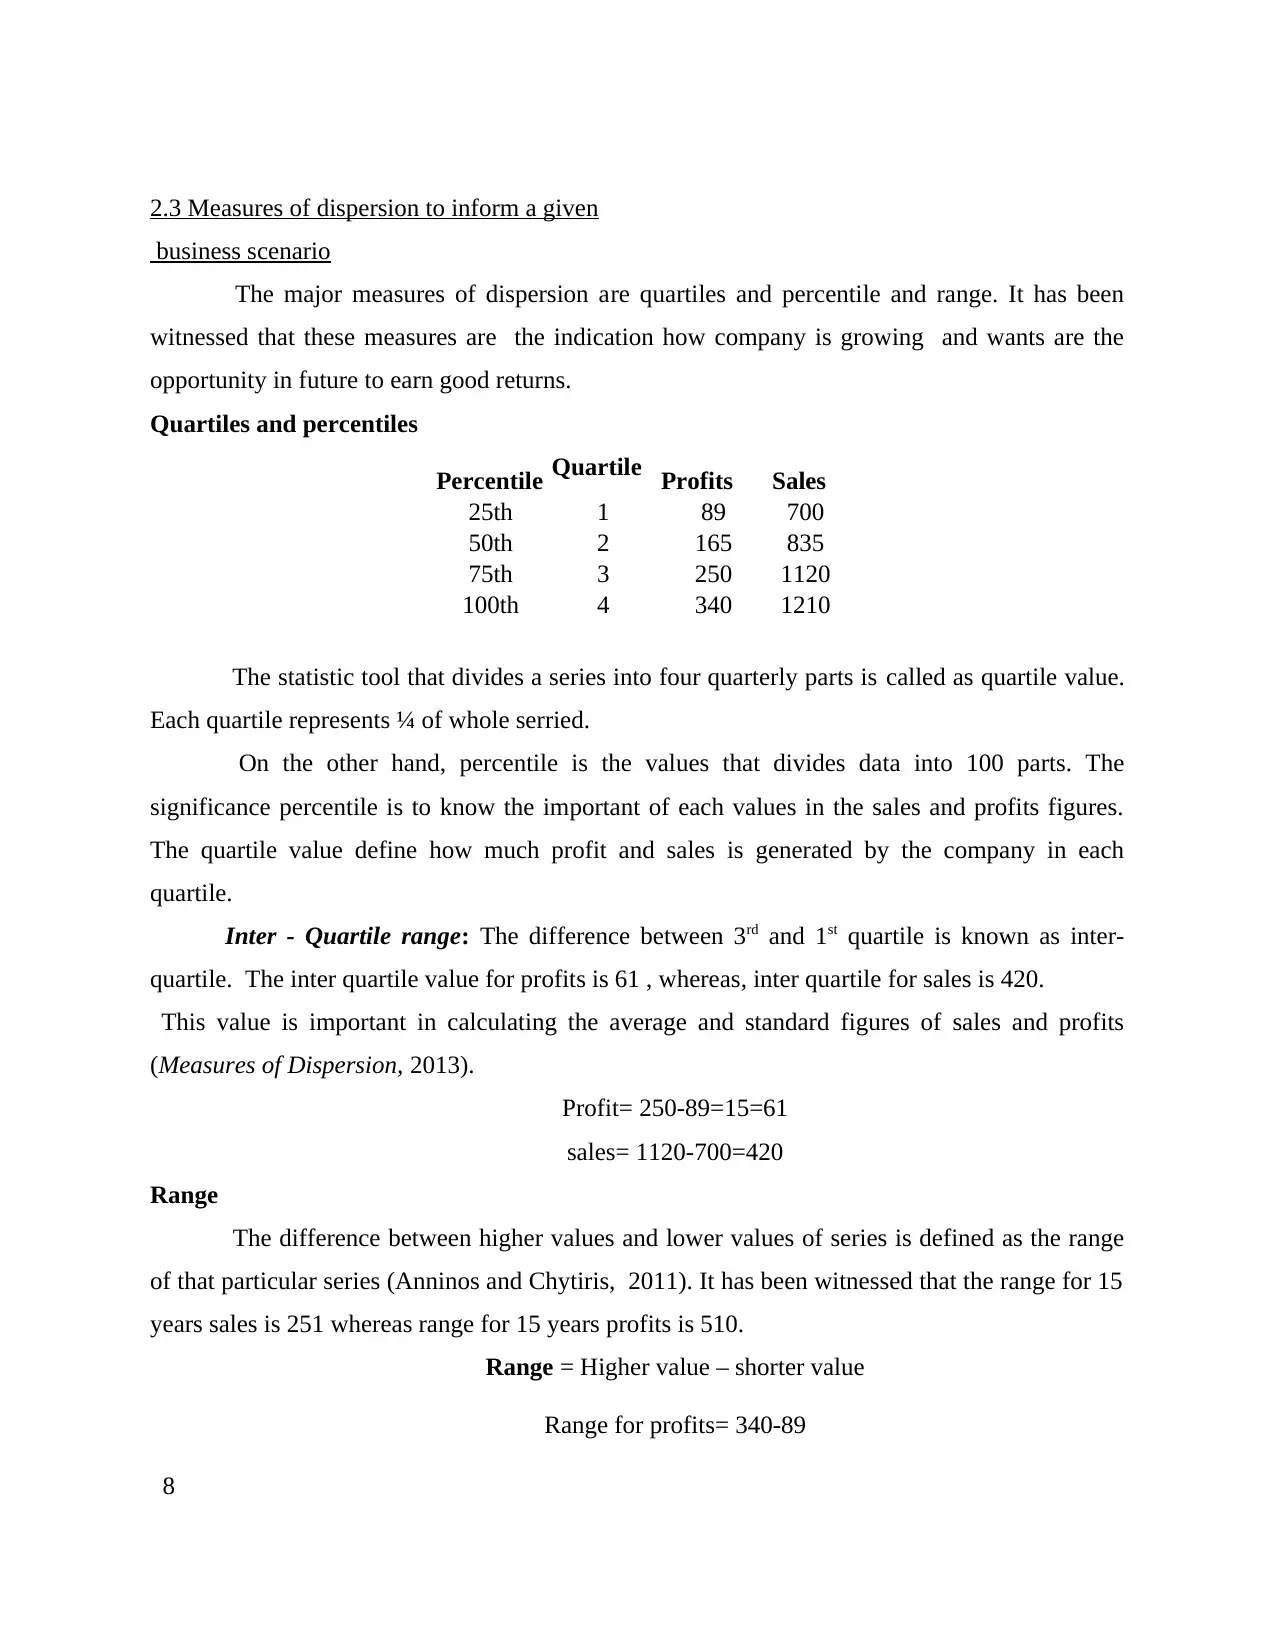
2.3 Measures of dispersion to inform a given
business scenario
The major measures of dispersion are quartiles and percentile and range. It has been
witnessed that these measures are the indication how company is growing and wants are the
opportunity in future to earn good returns.
Quartiles and percentiles
Percentile Quartile Profits Sales
25th 1 89 700
50th 2 165 835
75th 3 250 1120
100th 4 340 1210
The statistic tool that divides a series into four quarterly parts is called as quartile value.
Each quartile represents ¼ of whole serried.
On the other hand, percentile is the values that divides data into 100 parts. The
significance percentile is to know the important of each values in the sales and profits figures.
The quartile value define how much profit and sales is generated by the company in each
quartile.
Inter - Quartile range: The difference between 3rd and 1st quartile is known as inter-
quartile. The inter quartile value for profits is 61 , whereas, inter quartile for sales is 420.
This value is important in calculating the average and standard figures of sales and profits
(Measures of Dispersion, 2013).
Profit= 250-89=15=61
sales= 1120-700=420
Range
The difference between higher values and lower values of series is defined as the range
of that particular series (Anninos and Chytiris, 2011). It has been witnessed that the range for 15
years sales is 251 whereas range for 15 years profits is 510.
Range = Higher value – shorter value
Range for profits= 340-89
8
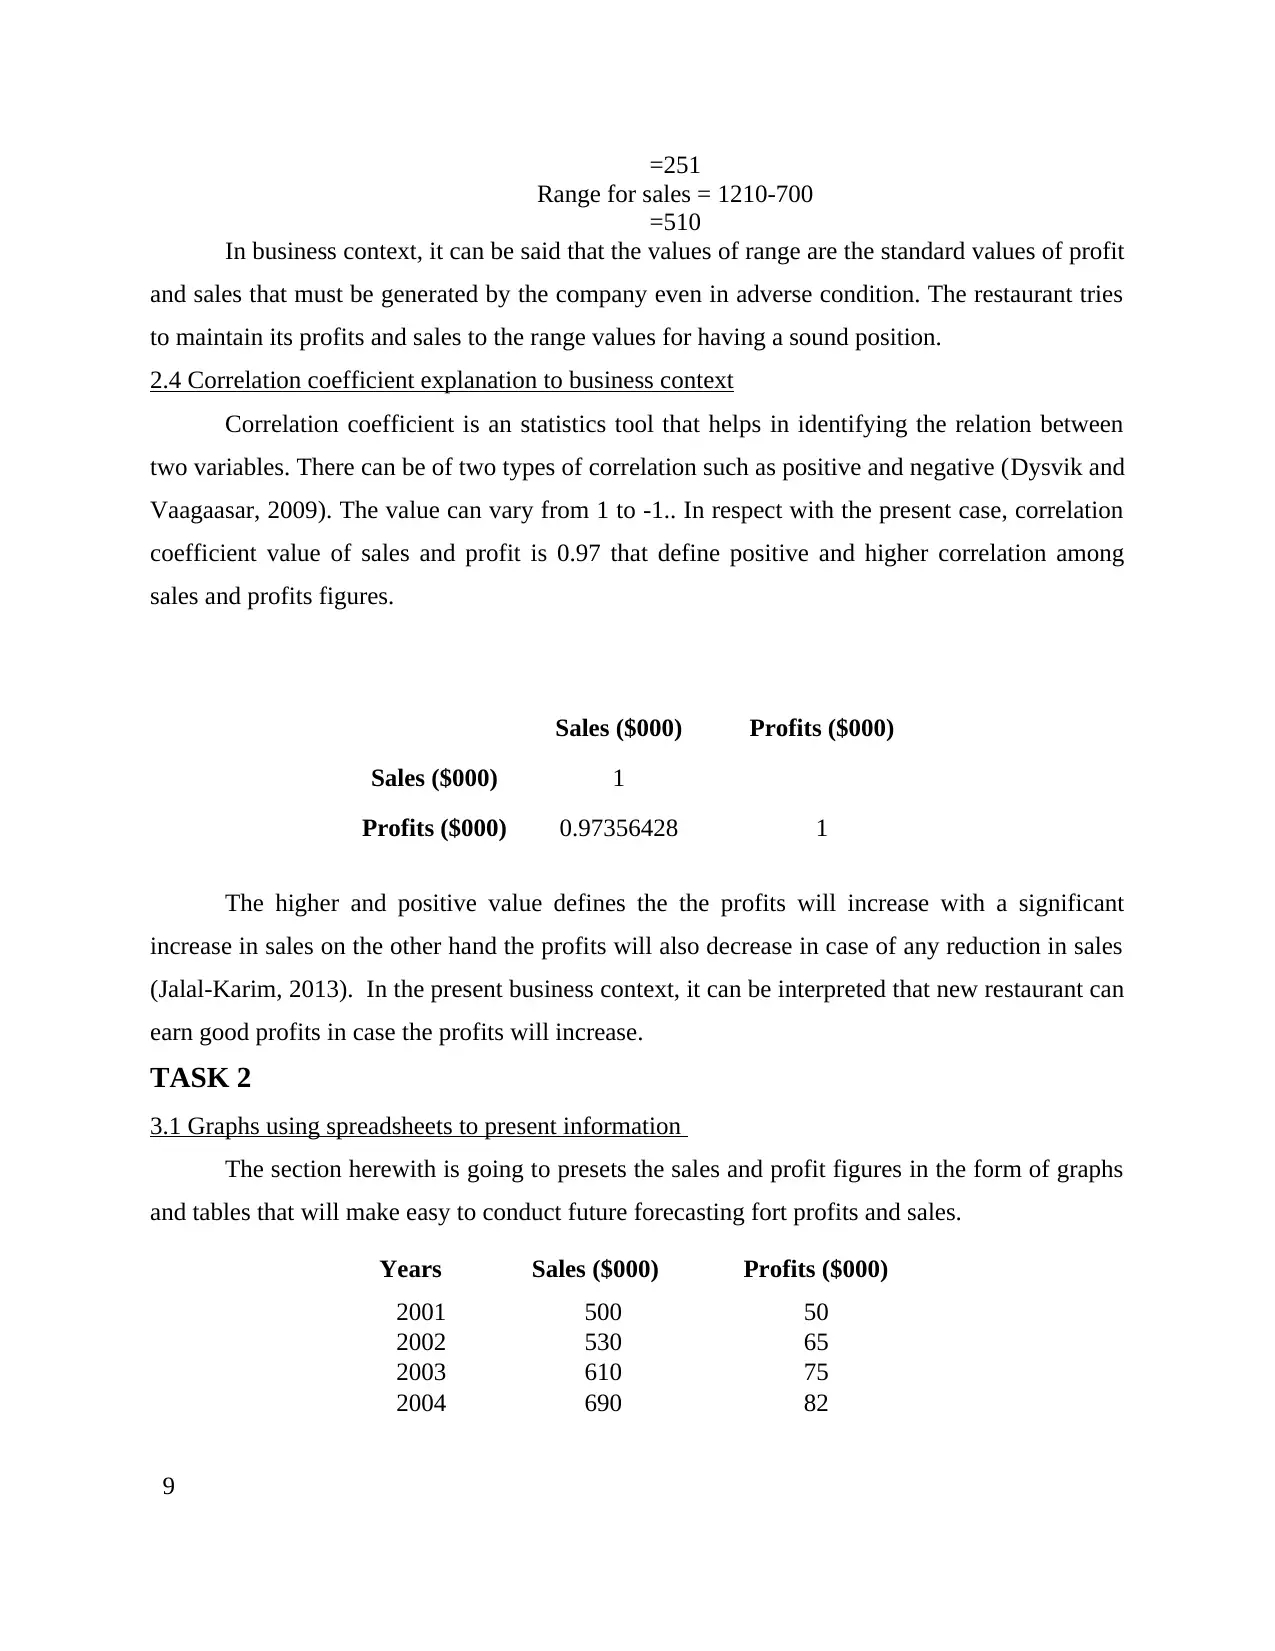
=251
Range for sales = 1210-700
=510
In business context, it can be said that the values of range are the standard values of profit
and sales that must be generated by the company even in adverse condition. The restaurant tries
to maintain its profits and sales to the range values for having a sound position.
2.4 Correlation coefficient explanation to business context
Correlation coefficient is an statistics tool that helps in identifying the relation between
two variables. There can be of two types of correlation such as positive and negative (Dysvik and
Vaagaasar, 2009). The value can vary from 1 to -1.. In respect with the present case, correlation
coefficient value of sales and profit is 0.97 that define positive and higher correlation among
sales and profits figures.
Sales ($000) Profits ($000)
Sales ($000) 1
Profits ($000) 0.97356428 1
The higher and positive value defines the the profits will increase with a significant
increase in sales on the other hand the profits will also decrease in case of any reduction in sales
(Jalal-Karim, 2013). In the present business context, it can be interpreted that new restaurant can
earn good profits in case the profits will increase.
TASK 2
3.1 Graphs using spreadsheets to present information
The section herewith is going to presets the sales and profit figures in the form of graphs
and tables that will make easy to conduct future forecasting fort profits and sales.
Years Sales ($000) Profits ($000)
2001 500 50
2002 530 65
2003 610 75
2004 690 82
9
⊘ This is a preview!⊘
Do you want full access?
Subscribe today to unlock all pages.
Trusted by 1+ million students worldwide
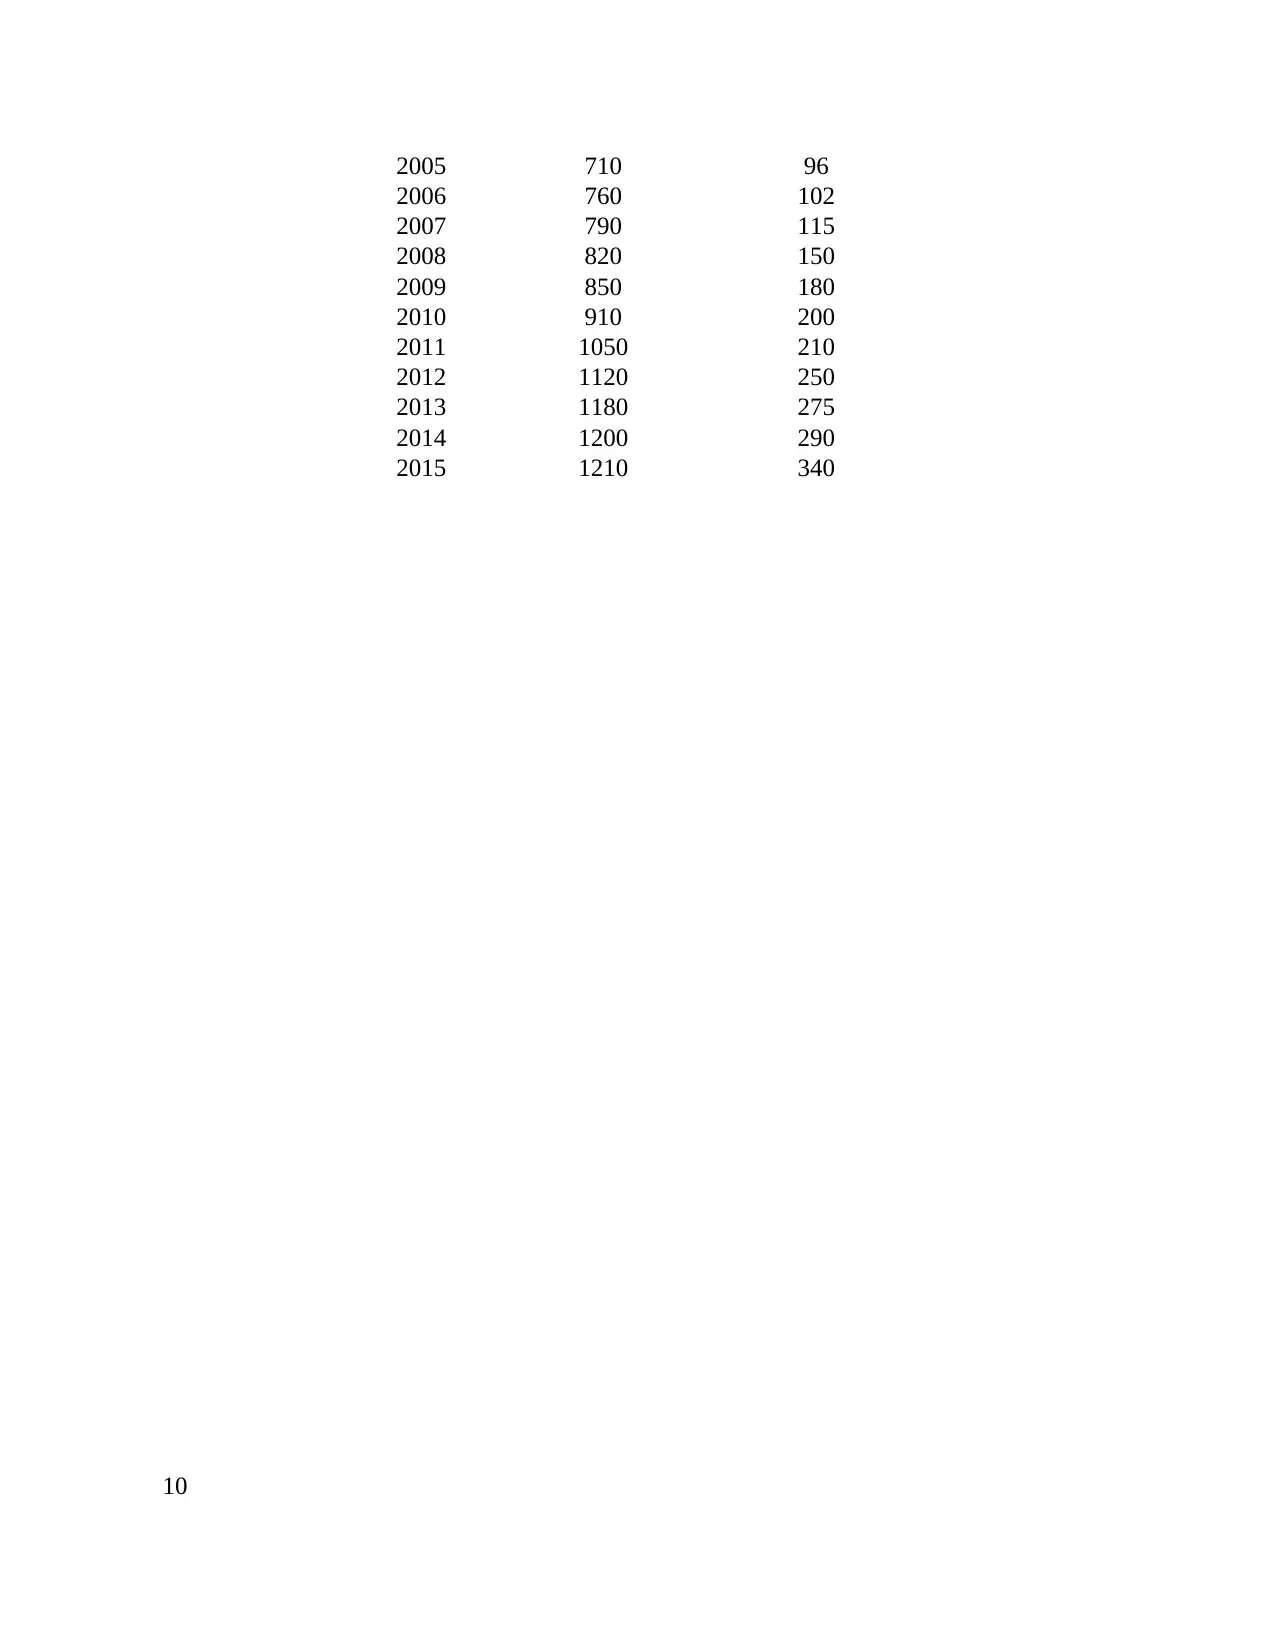
2005 710 96
2006 760 102
2007 790 115
2008 820 150
2009 850 180
2010 910 200
2011 1050 210
2012 1120 250
2013 1180 275
2014 1200 290
2015 1210 340
10
2006 760 102
2007 790 115
2008 820 150
2009 850 180
2010 910 200
2011 1050 210
2012 1120 250
2013 1180 275
2014 1200 290
2015 1210 340
10
Paraphrase This Document
Need a fresh take? Get an instant paraphrase of this document with our AI Paraphraser
11
2001 2002 2003 2004 2005 2006 2007 2008 2009 2010 2011 2012 2013 2014 2015
0
200
400
600
800
1000
1200
1400
500 530
610
690 710 760 790 820 850 910
1050
1120 1180 1200 1210
Sales ($000)
2001 2002 2003 2004 2005 2006 2007 2008 2009 2010 2011 2012 2013 2014 2015
0
50
100
150
200
250
300
350
400
50 65 75 82 96 102 115
150
180
200 210
250
275 290
340
Profits ($000)
2001 2002 2003 2004 2005 2006 2007 2008 2009 2010 2011 2012 2013 2014 2015
0
200
400
600
800
1000
1200
1400
500 530
610
690 710 760 790 820 850 910
1050
1120 1180 1200 1210
Sales ($000)
2001 2002 2003 2004 2005 2006 2007 2008 2009 2010 2011 2012 2013 2014 2015
0
50
100
150
200
250
300
350
400
50 65 75 82 96 102 115
150
180
200 210
250
275 290
340
Profits ($000)
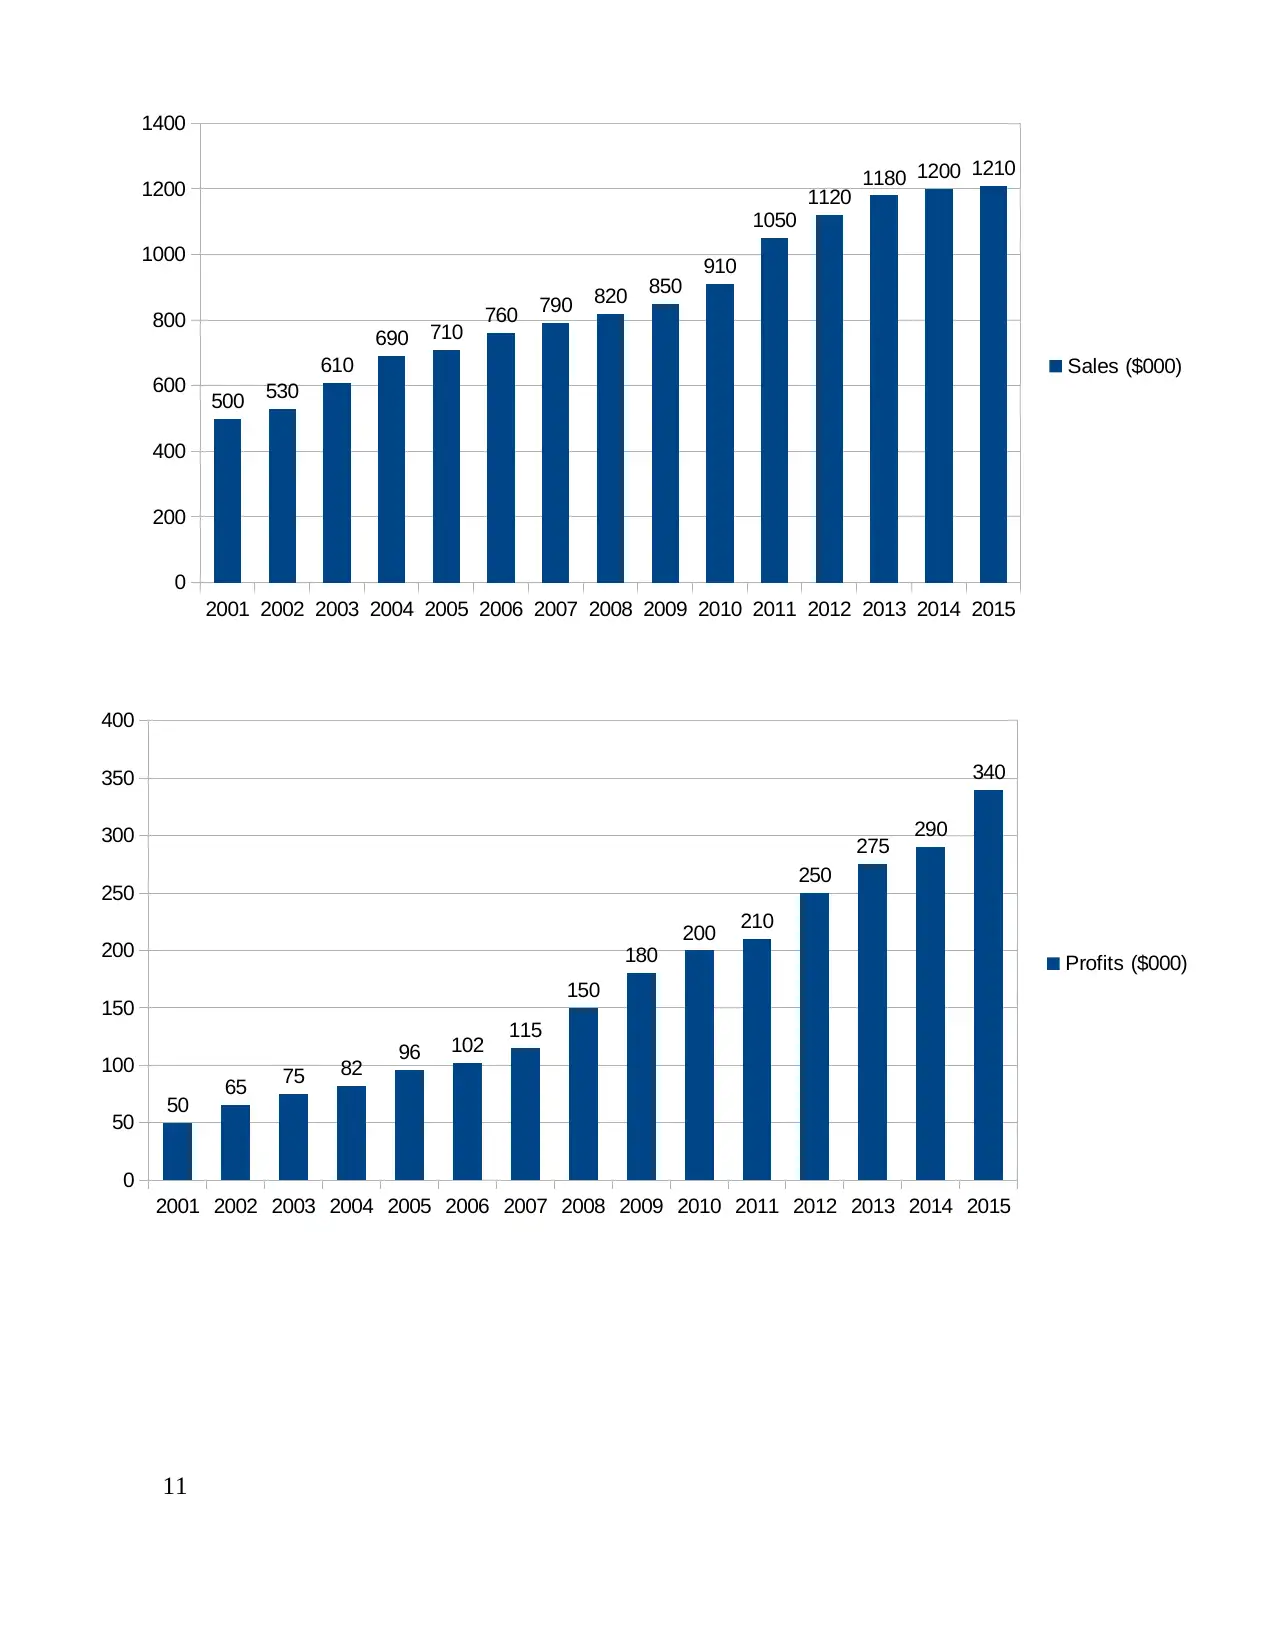
The graphs above present the sales and profits figures for last 15 year for ABC restaurant
chain. It can be said that the profits and sales earned by the company is last years is going to be
increased in the positive sense for all all the year. The information of sales and profits is acquired
from the annual report of the restaurant. is The restaurant chain has earned maximum profits is
2015 and well as the sales of last years has also been increased in past years. The continual
growing figures are showing a positive trend in future. In the beginning it can be seen that the
profits were low it was just due to low sales and high cost earned by the company.
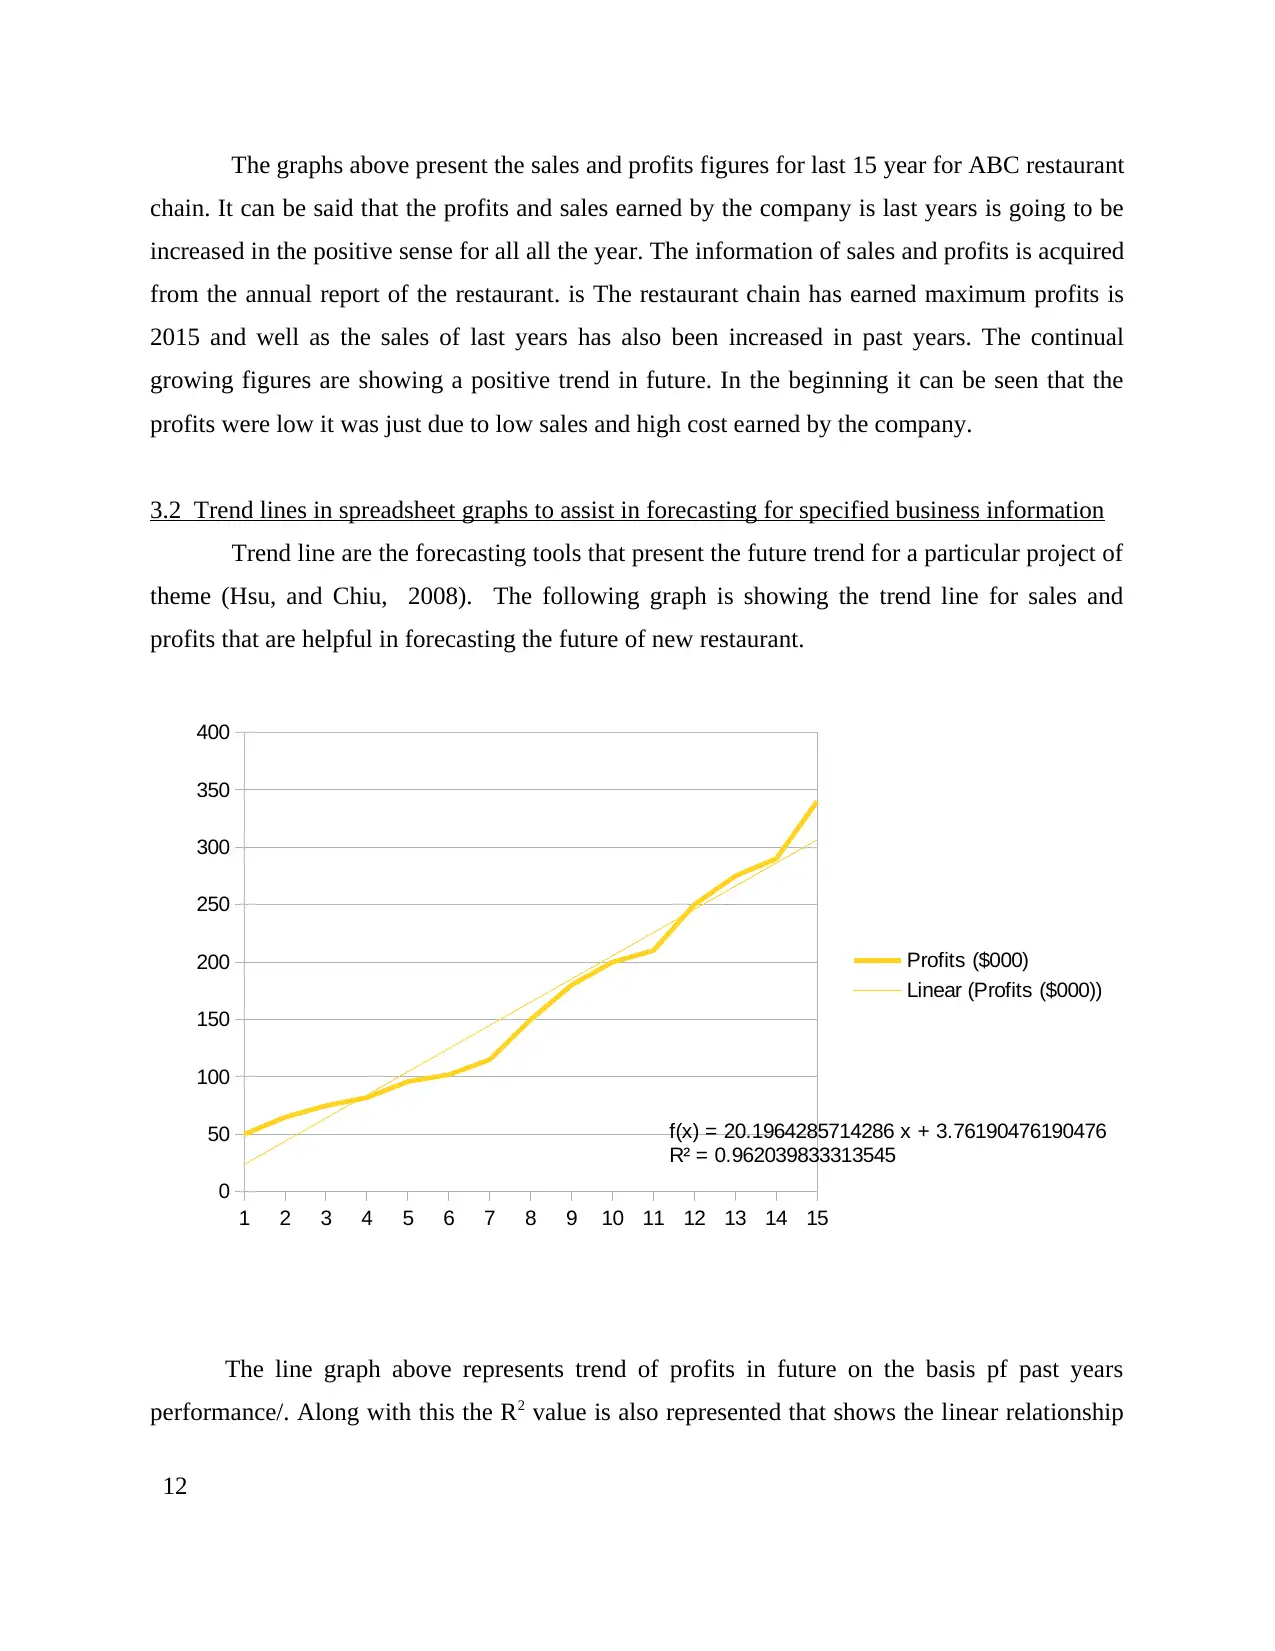
3.2 Trend lines in spreadsheet graphs to assist in forecasting for specified business information
Trend line are the forecasting tools that present the future trend for a particular project of
theme (Hsu, and Chiu, 2008). The following graph is showing the trend line for sales and
profits that are helpful in forecasting the future of new restaurant.
The line graph above represents trend of profits in future on the basis pf past years
performance/. Along with this the R2 value is also represented that shows the linear relationship
12
1 2 3 4 5 6 7 8 9 10 11 12 13 14 15
0
50
100
150
200
250
300
350
400
f(x) = 20.1964285714286 x + 3.76190476190476
R² = 0.962039833313545
Profits ($000)
Linear (Profits ($000))
chain. It can be said that the profits and sales earned by the company is last years is going to be
increased in the positive sense for all all the year. The information of sales and profits is acquired
from the annual report of the restaurant. is The restaurant chain has earned maximum profits is
2015 and well as the sales of last years has also been increased in past years. The continual
growing figures are showing a positive trend in future. In the beginning it can be seen that the
profits were low it was just due to low sales and high cost earned by the company.
3.2 Trend lines in spreadsheet graphs to assist in forecasting for specified business information
Trend line are the forecasting tools that present the future trend for a particular project of
theme (Hsu, and Chiu, 2008). The following graph is showing the trend line for sales and
profits that are helpful in forecasting the future of new restaurant.
The line graph above represents trend of profits in future on the basis pf past years
performance/. Along with this the R2 value is also represented that shows the linear relationship
12
1 2 3 4 5 6 7 8 9 10 11 12 13 14 15
0
50
100
150
200
250
300
350
400
f(x) = 20.1964285714286 x + 3.76190476190476
R² = 0.962039833313545
Profits ($000)
Linear (Profits ($000))
⊘ This is a preview!⊘
Do you want full access?
Subscribe today to unlock all pages.
Trusted by 1+ million students worldwide
1 out of 20
Related Documents


Your All-in-One AI-Powered Toolkit for Academic Success.
+13062052269
info@desklib.com
Available 24*7 on WhatsApp / Email
![[object Object]](/_next/static/media/star-bottom.7253800d.svg)
Unlock your academic potential
Copyright © 2020–2026 A2Z Services. All Rights Reserved. Developed and managed by ZUCOL.