Restaurant Preference Analysis: Business Decision Making Insights

Verified

Added on  2023/04/21

|13
|697
|347
Homework Assignment
AI Summary
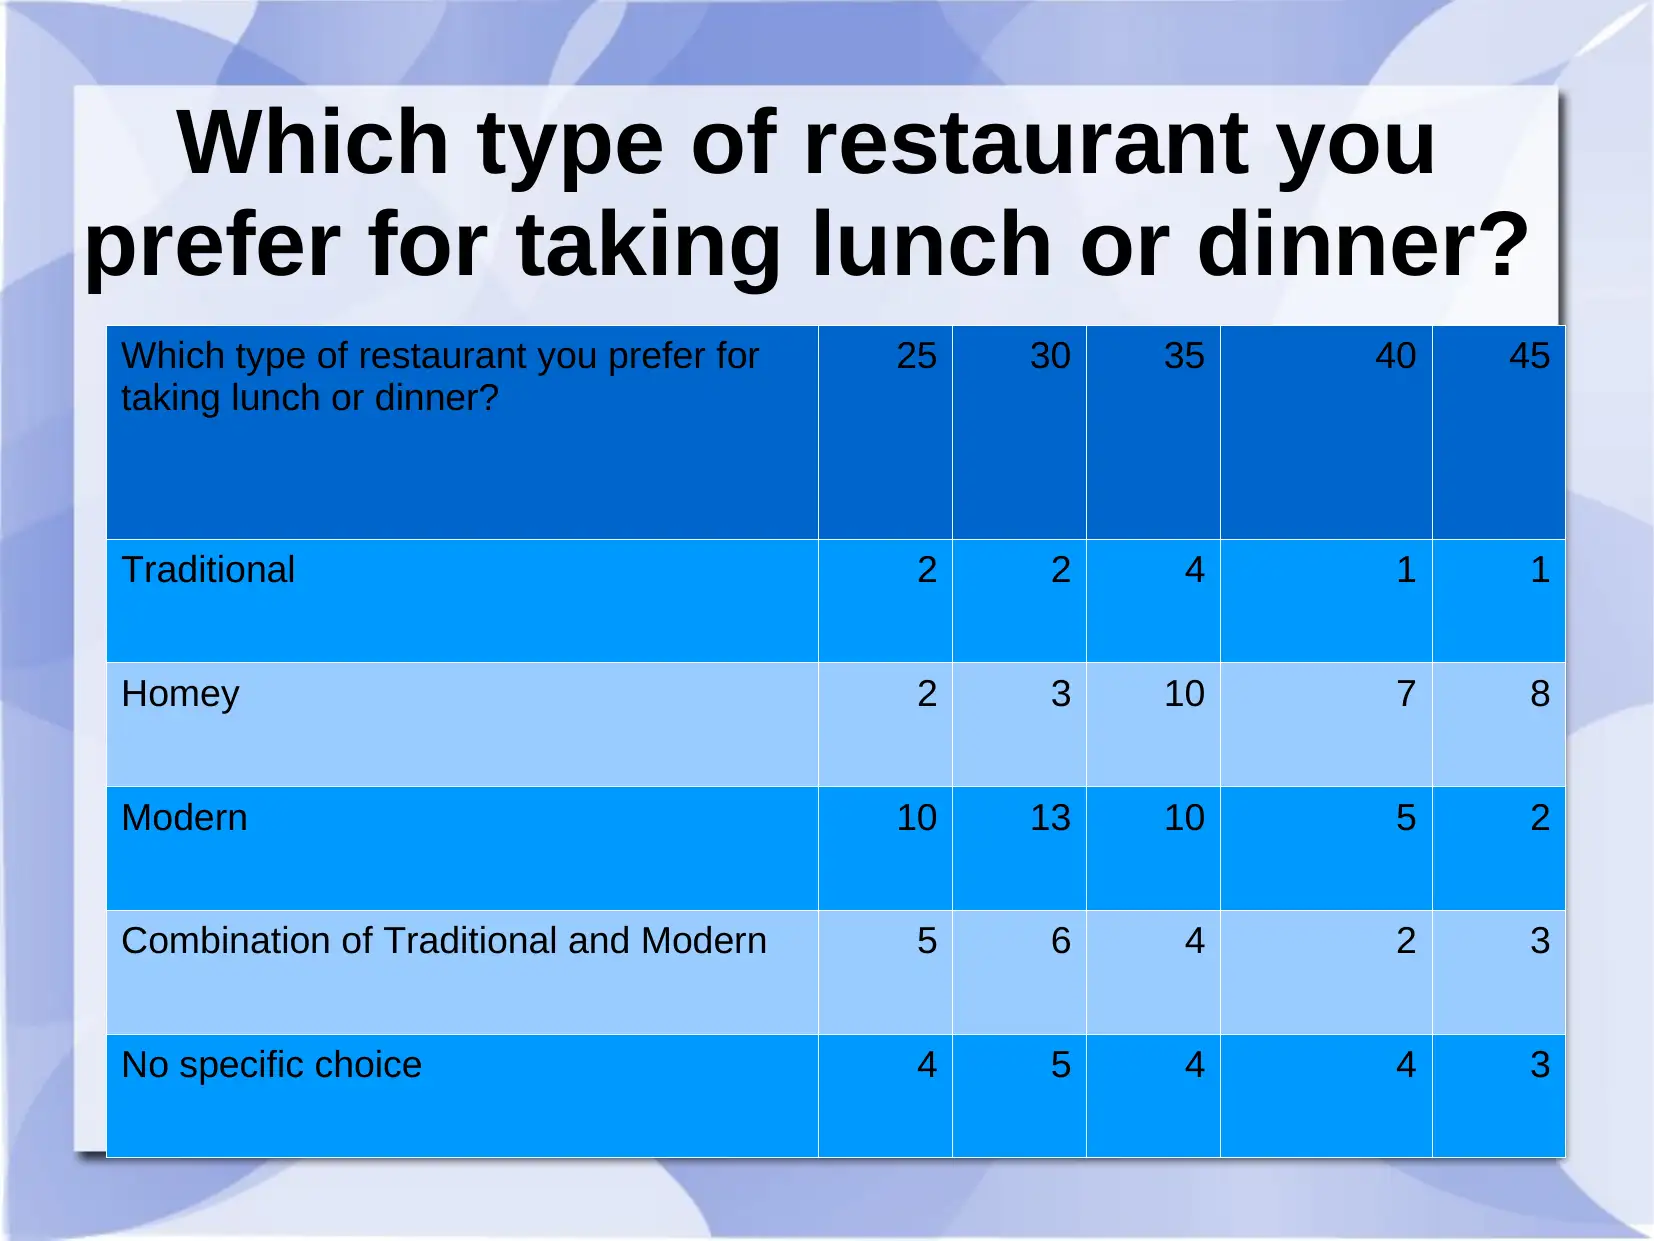
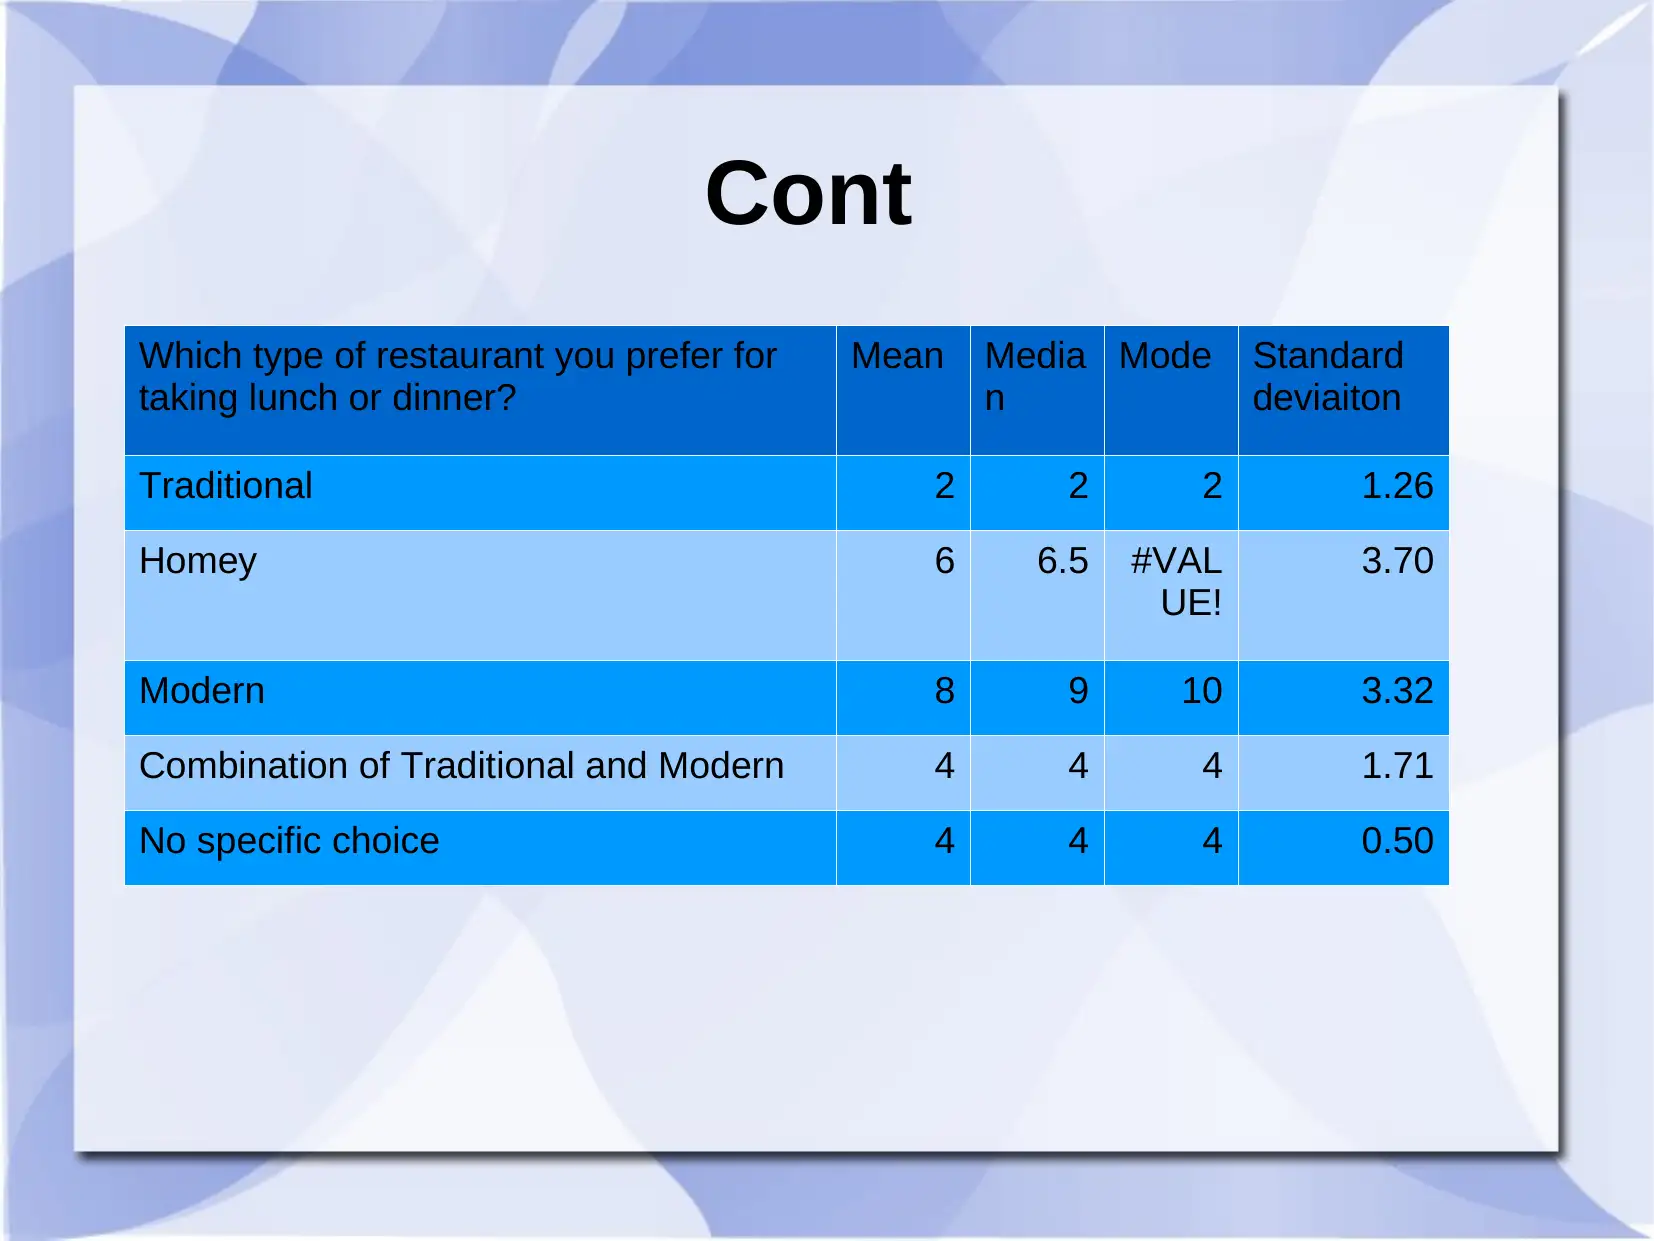
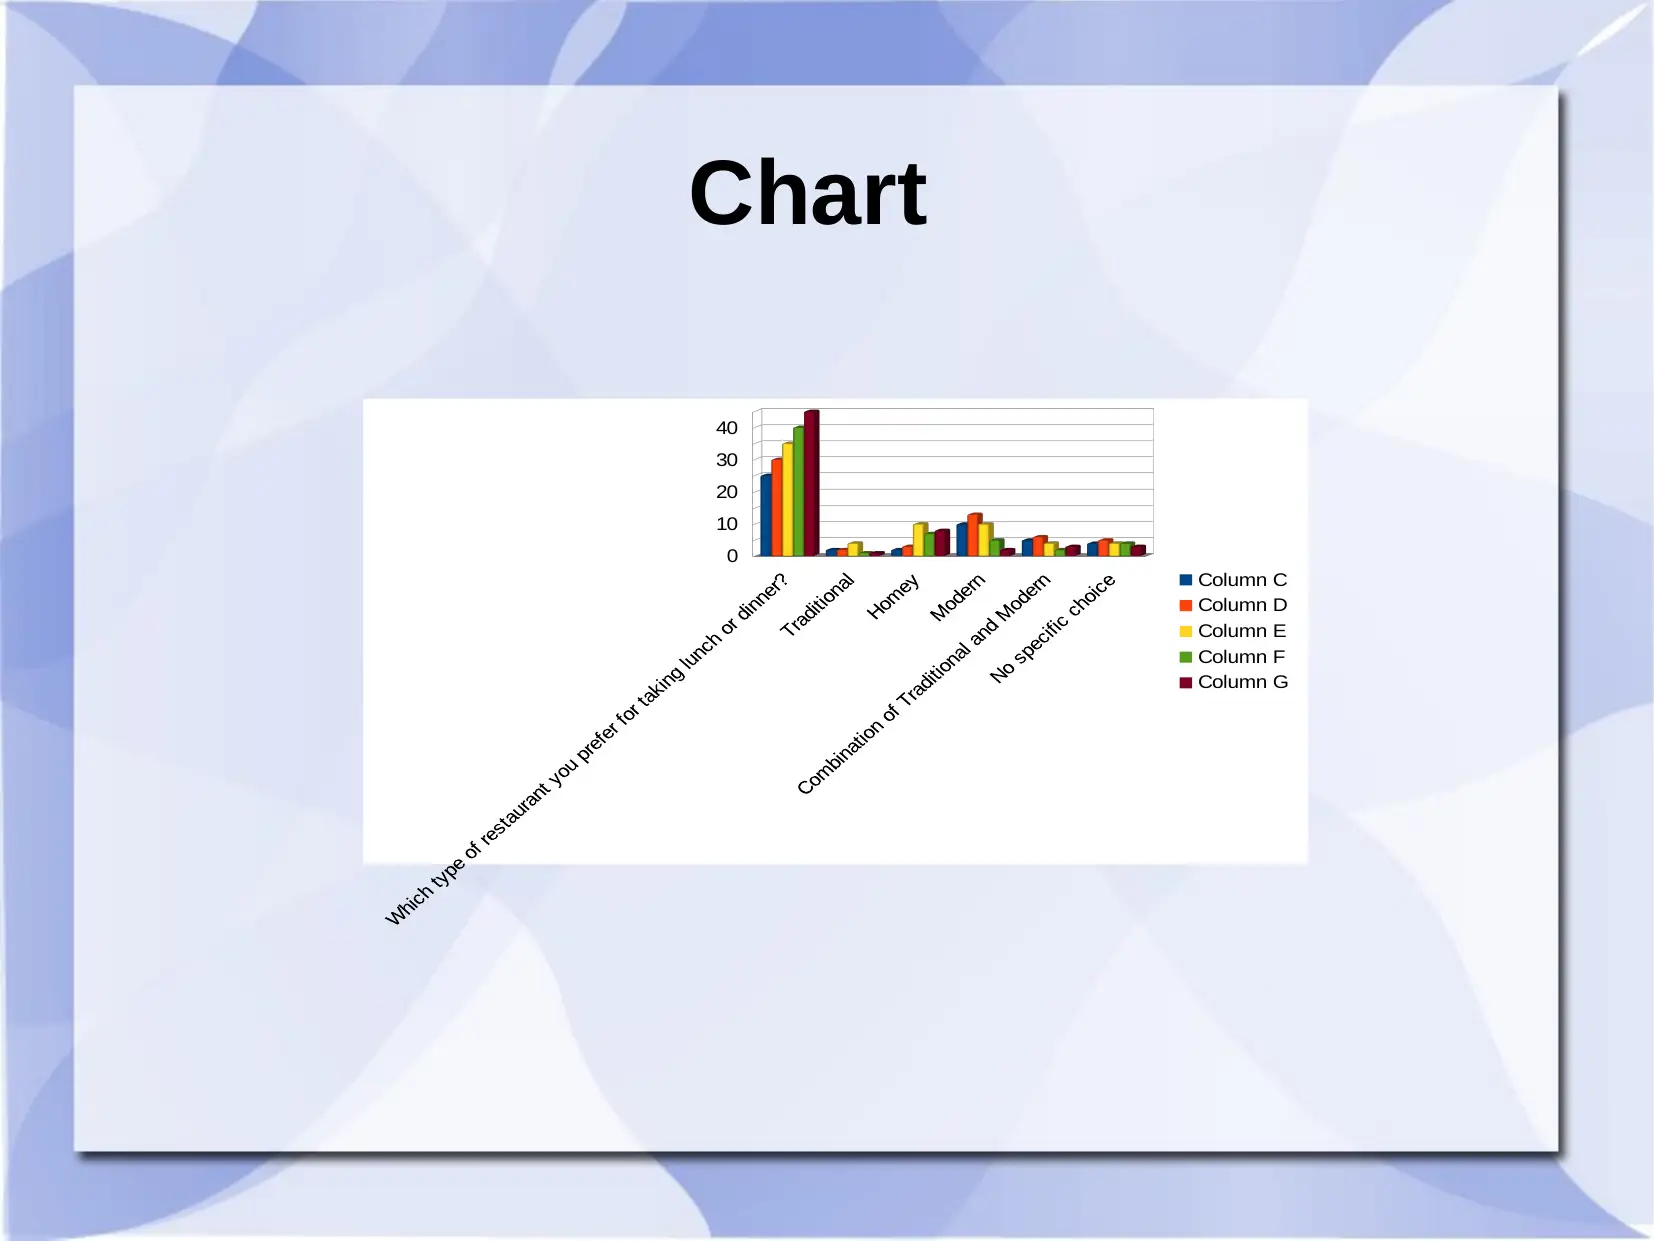
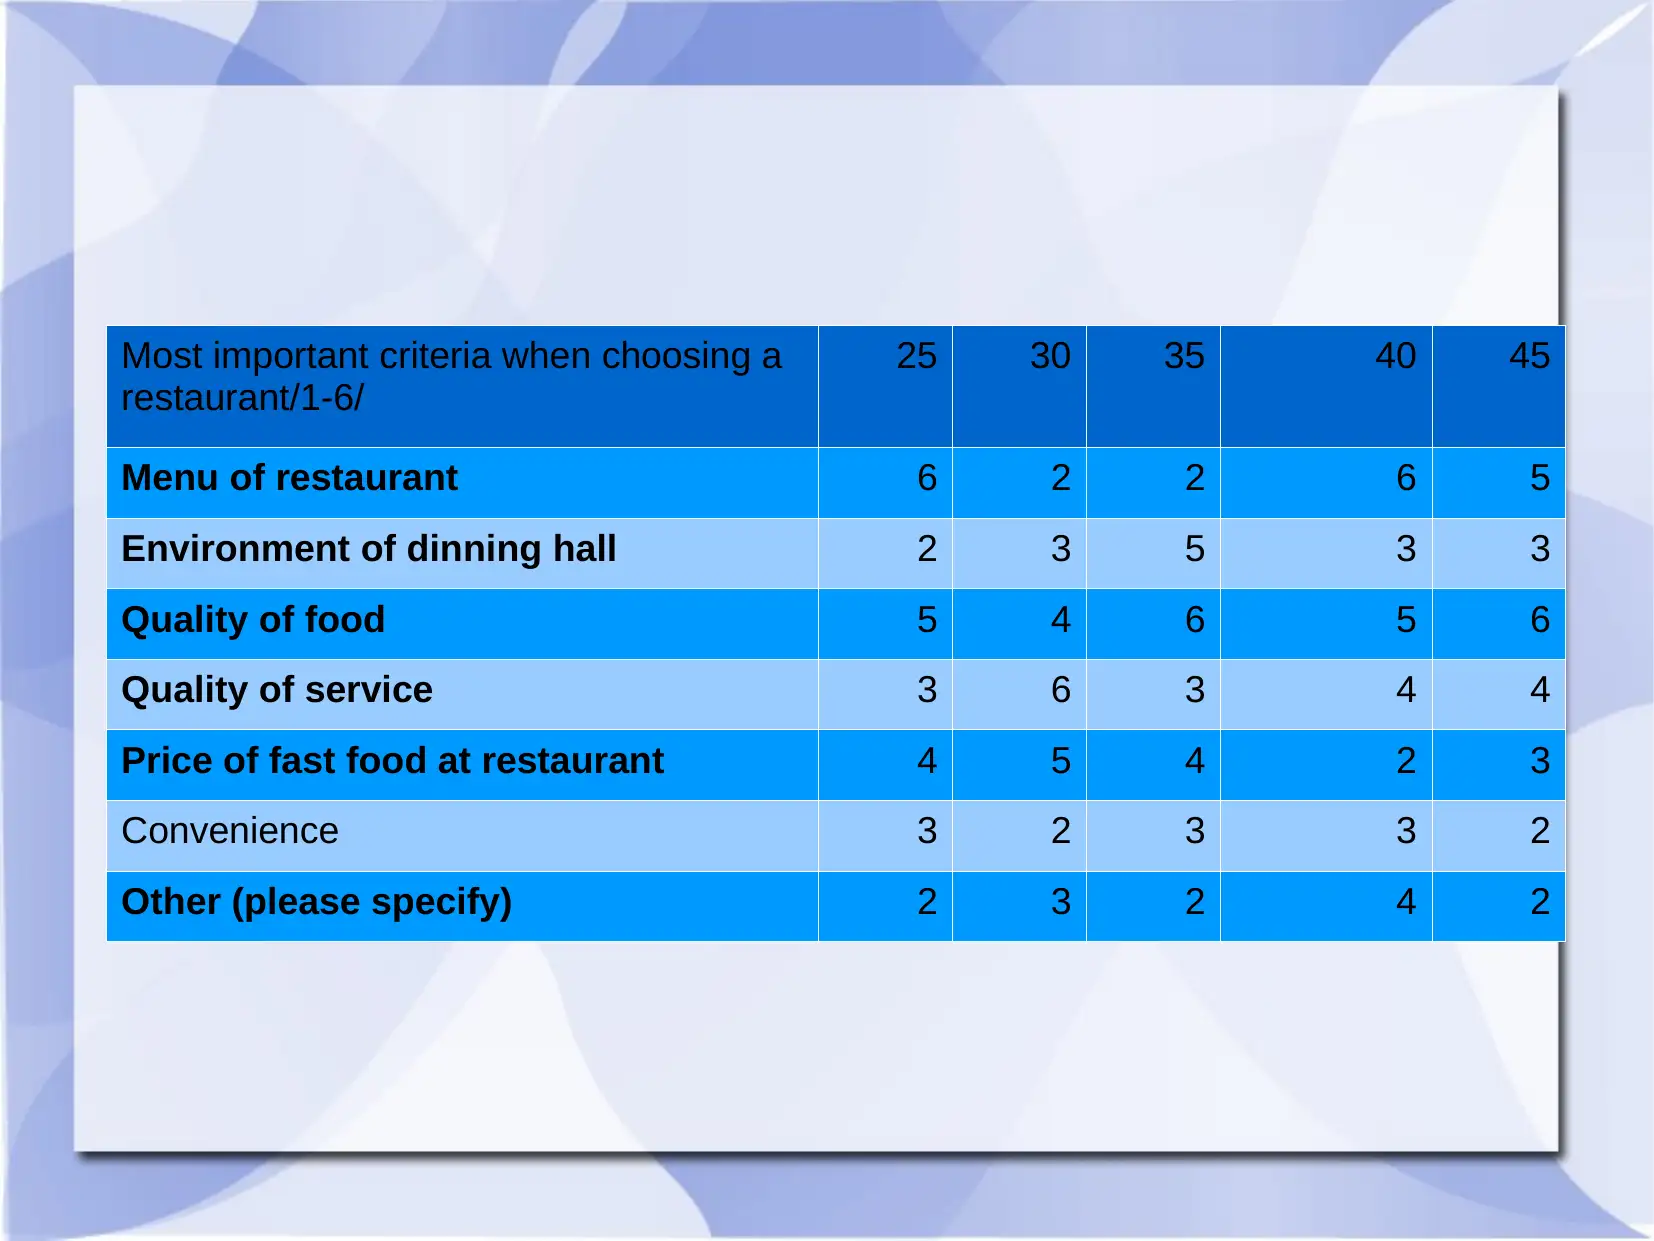
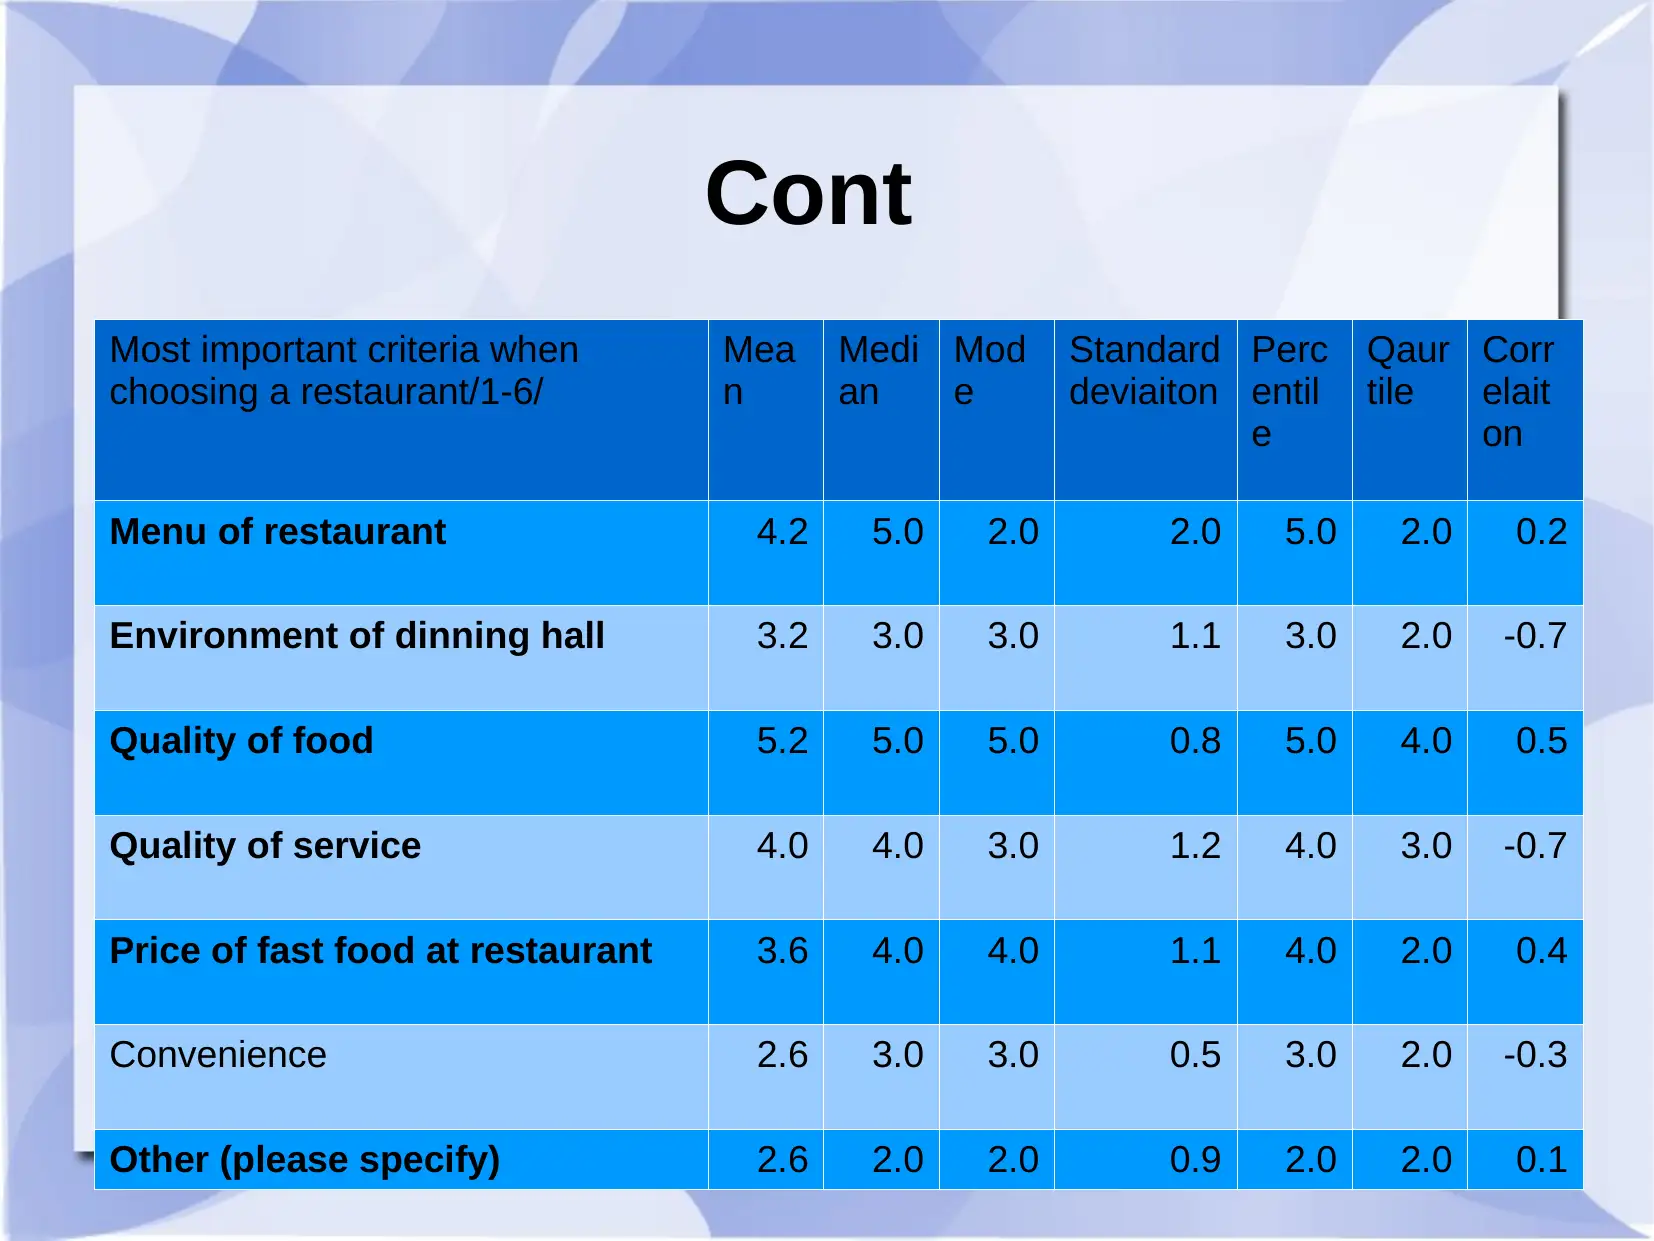
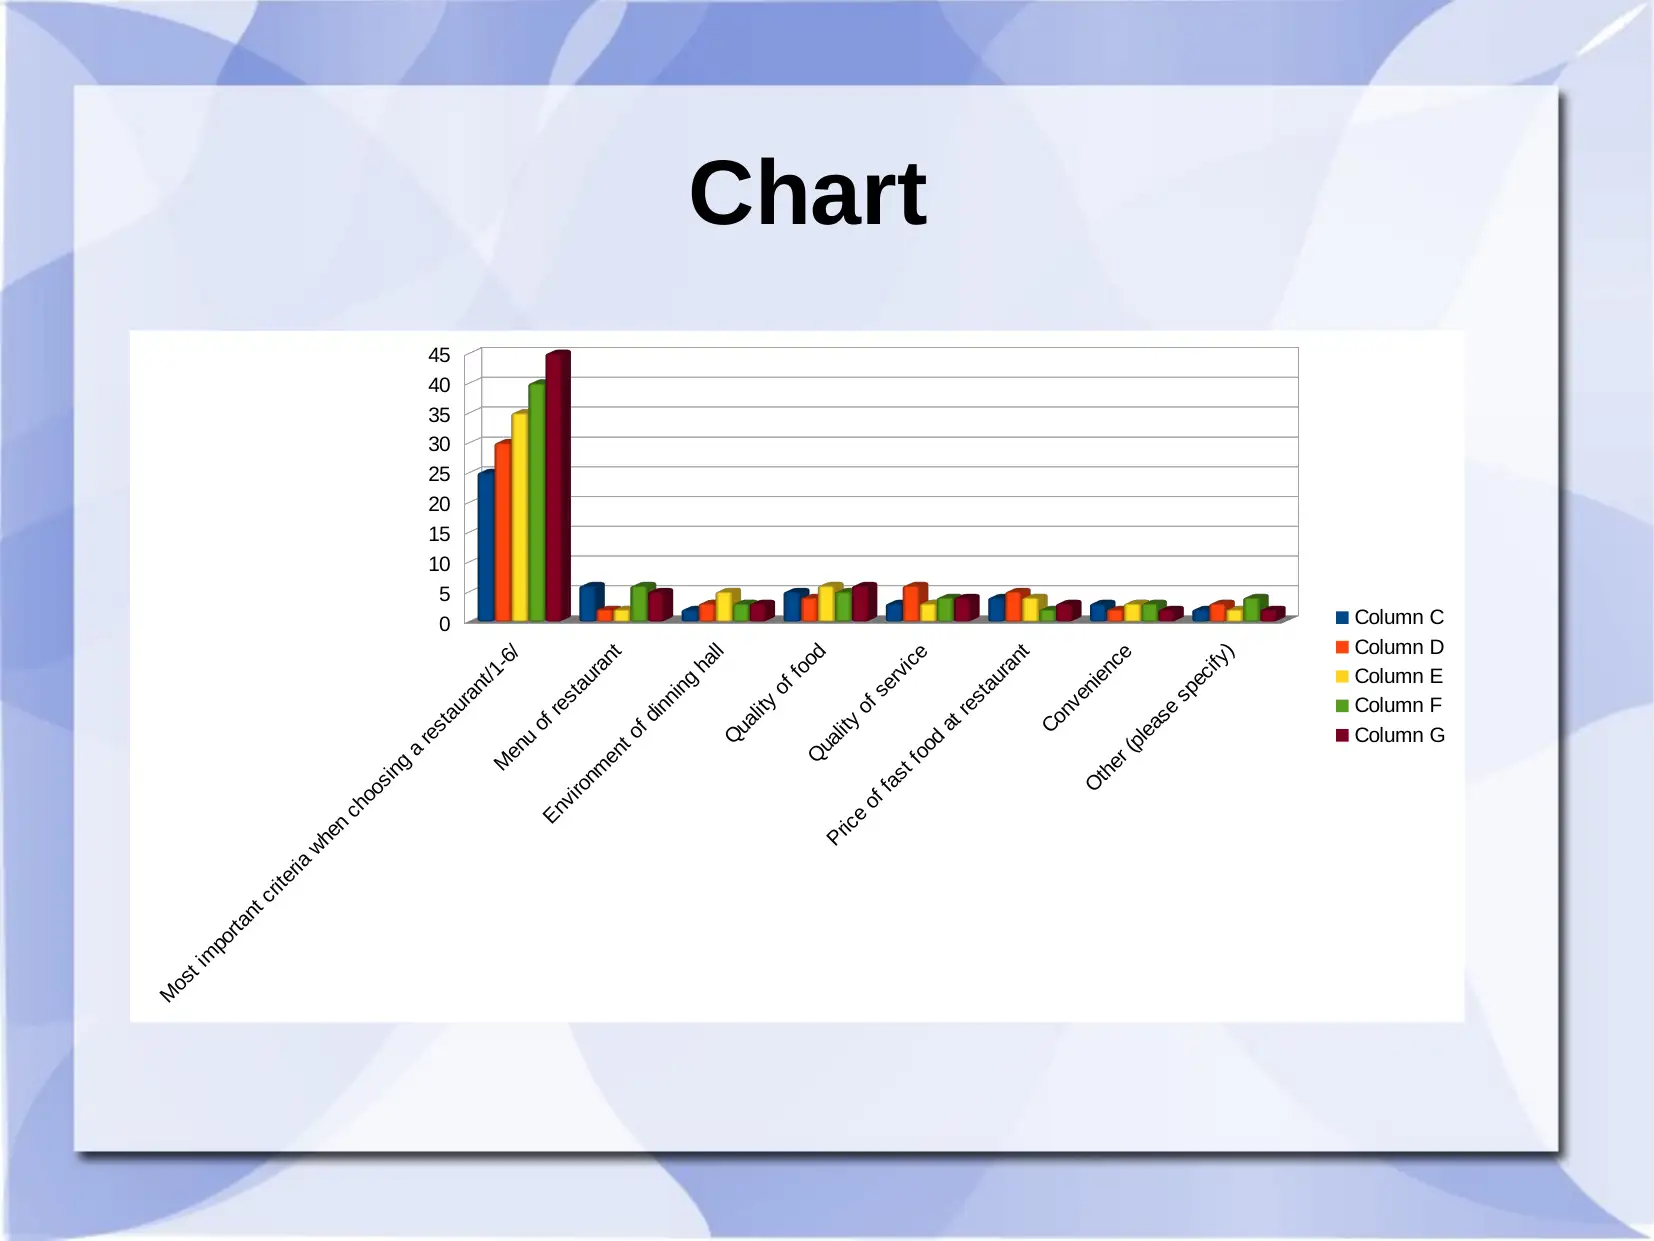
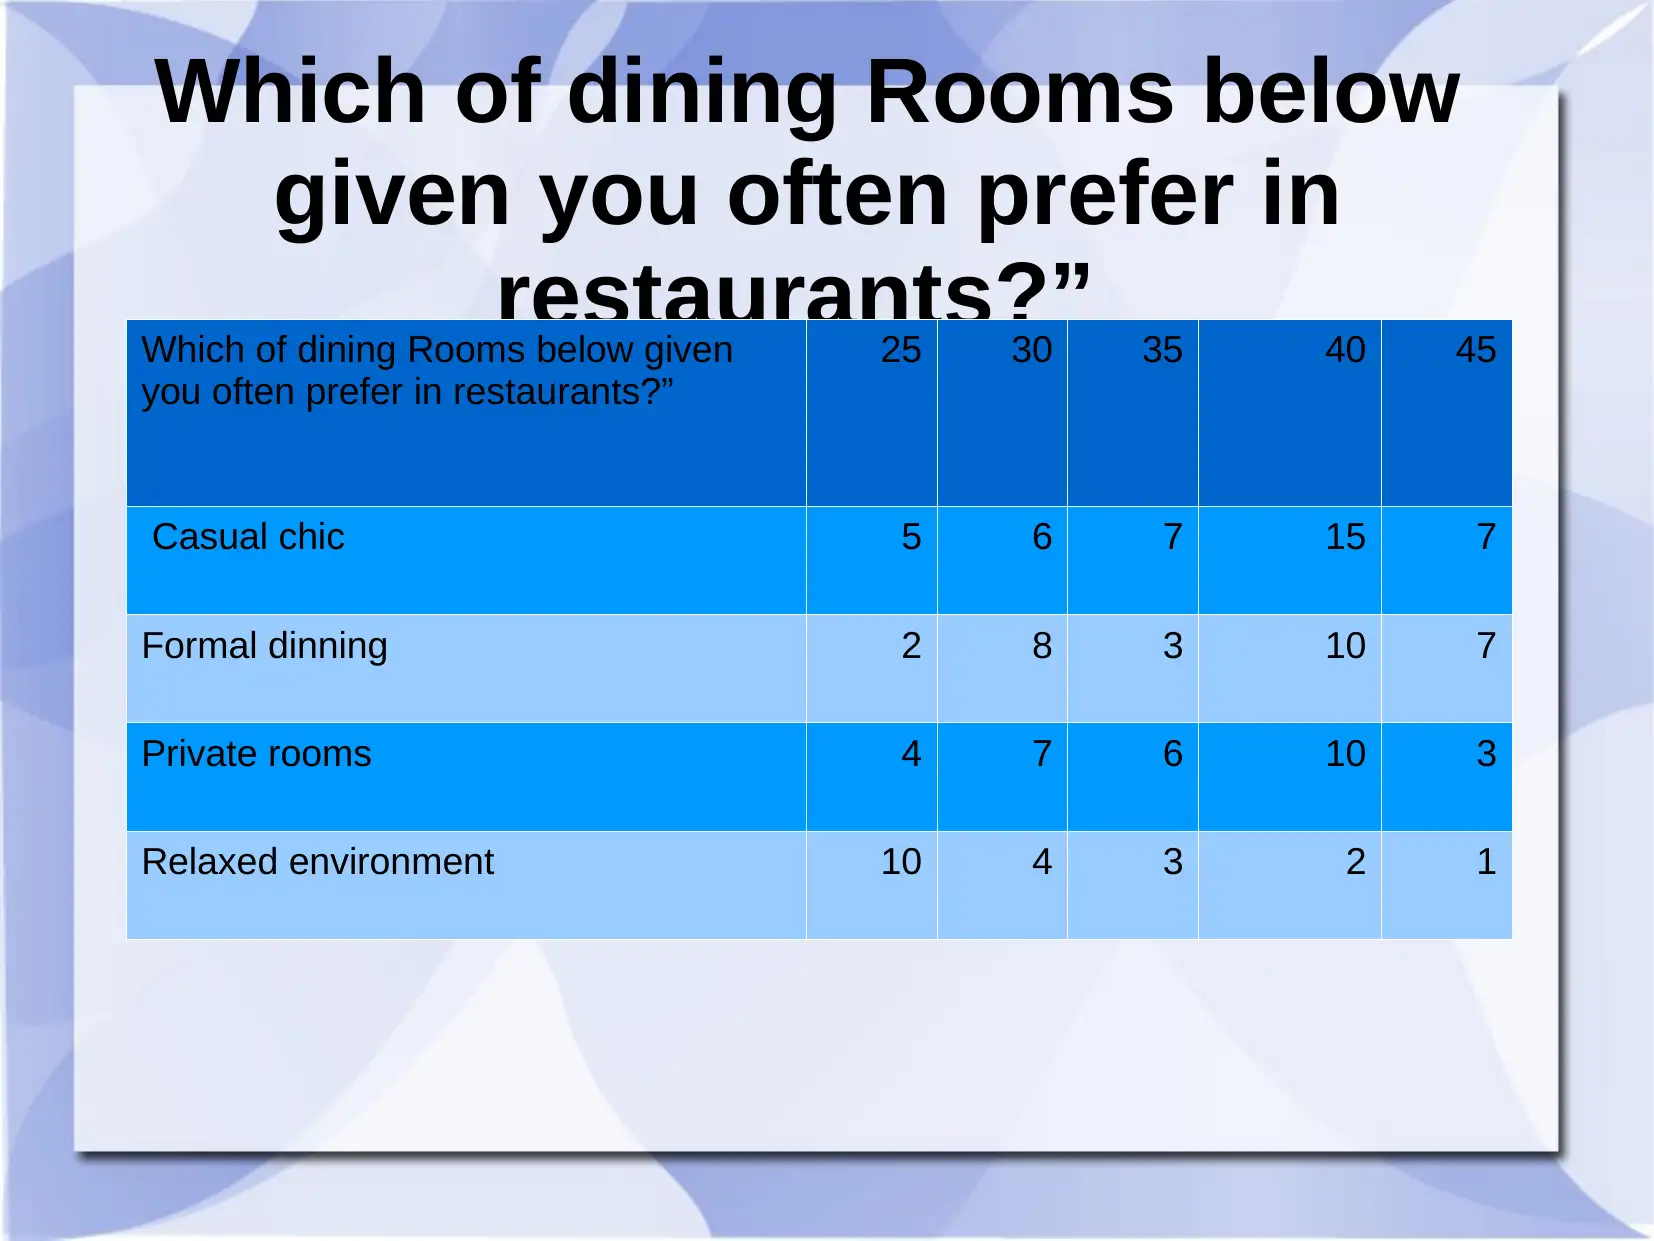
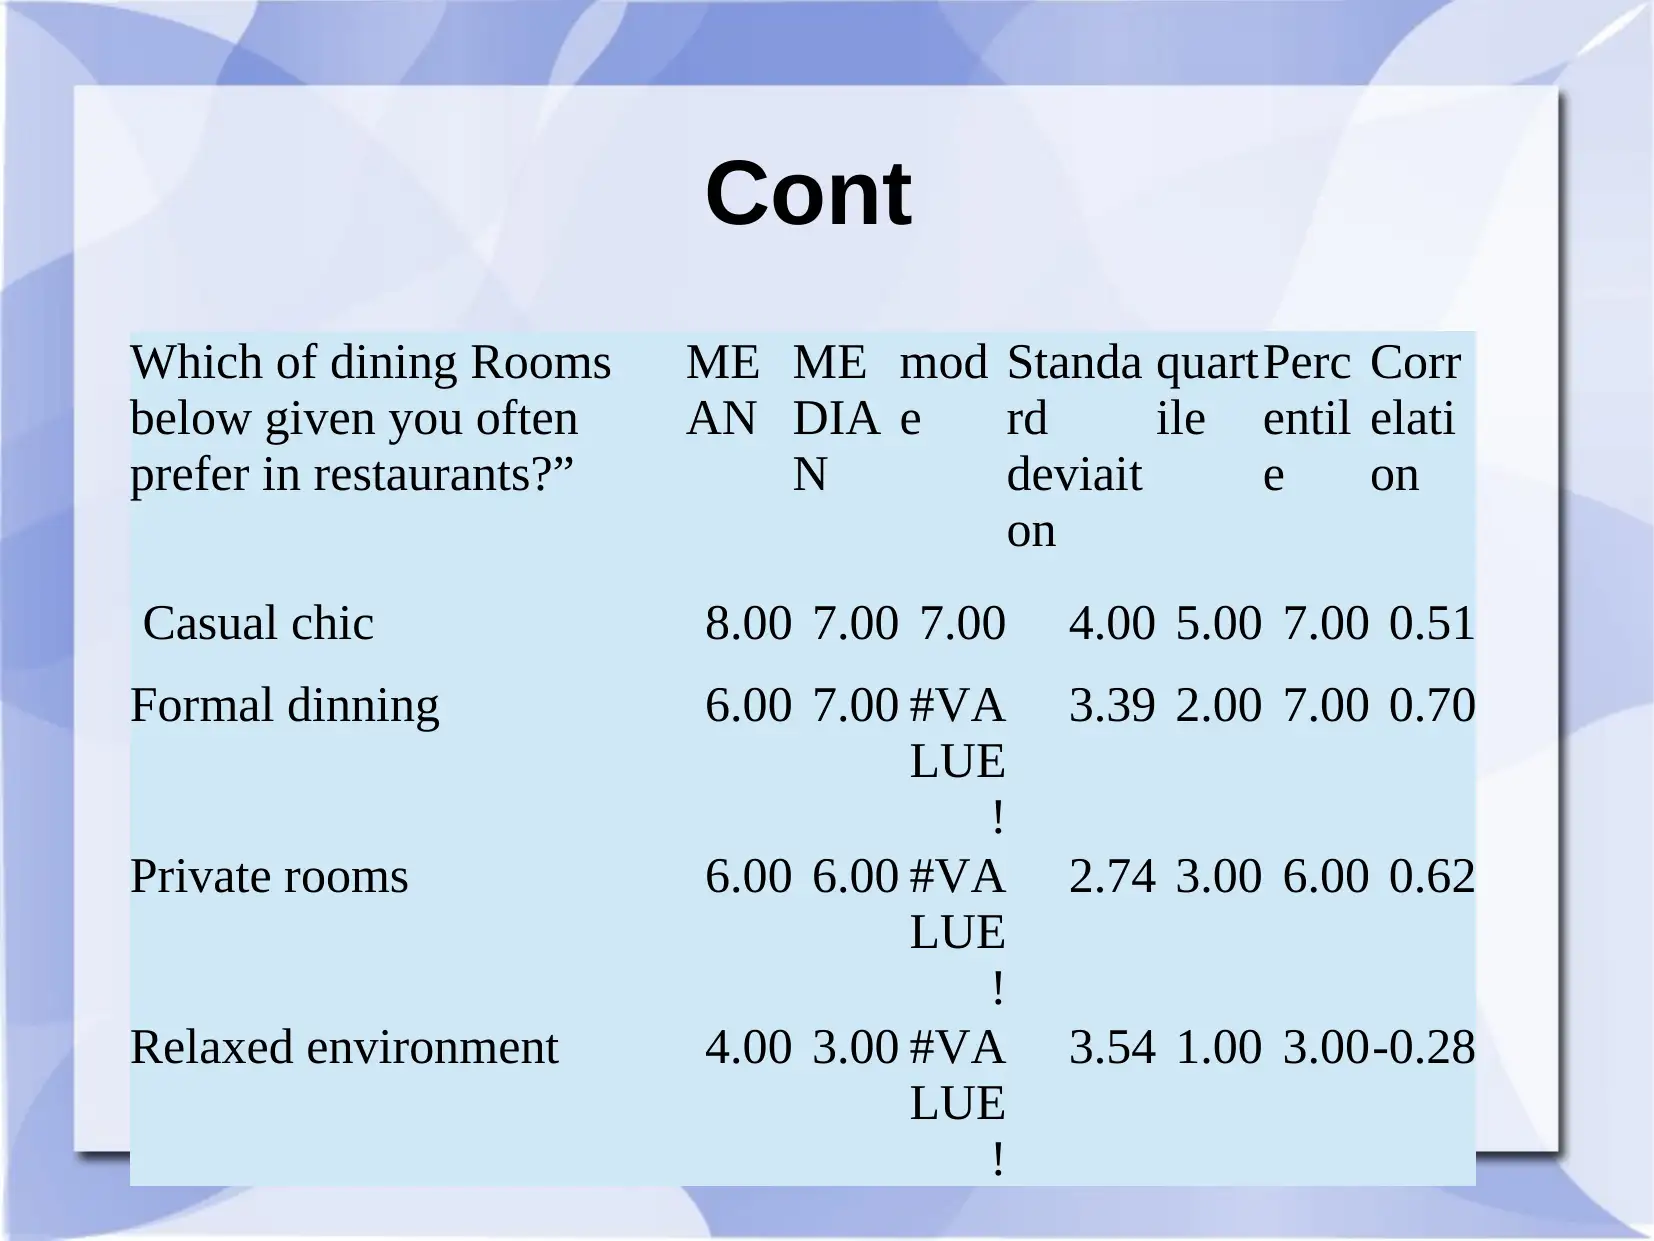
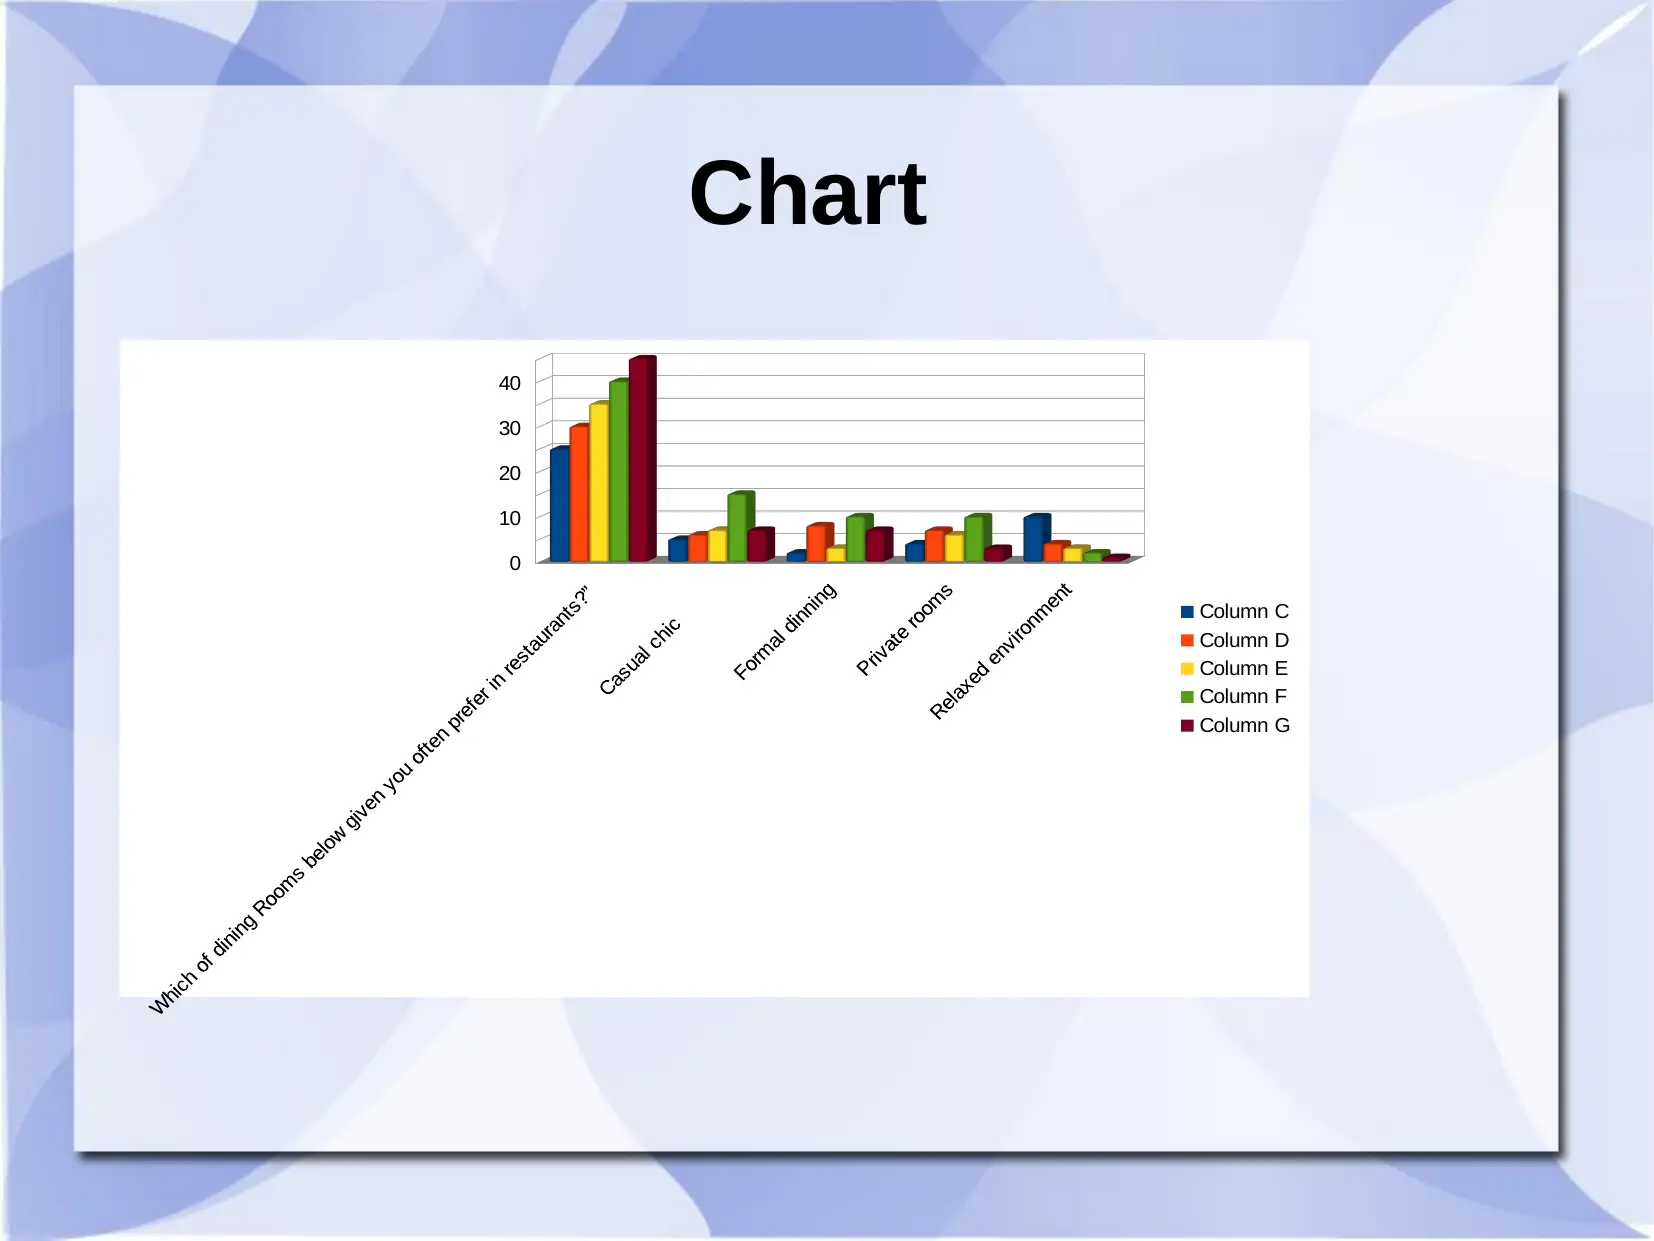
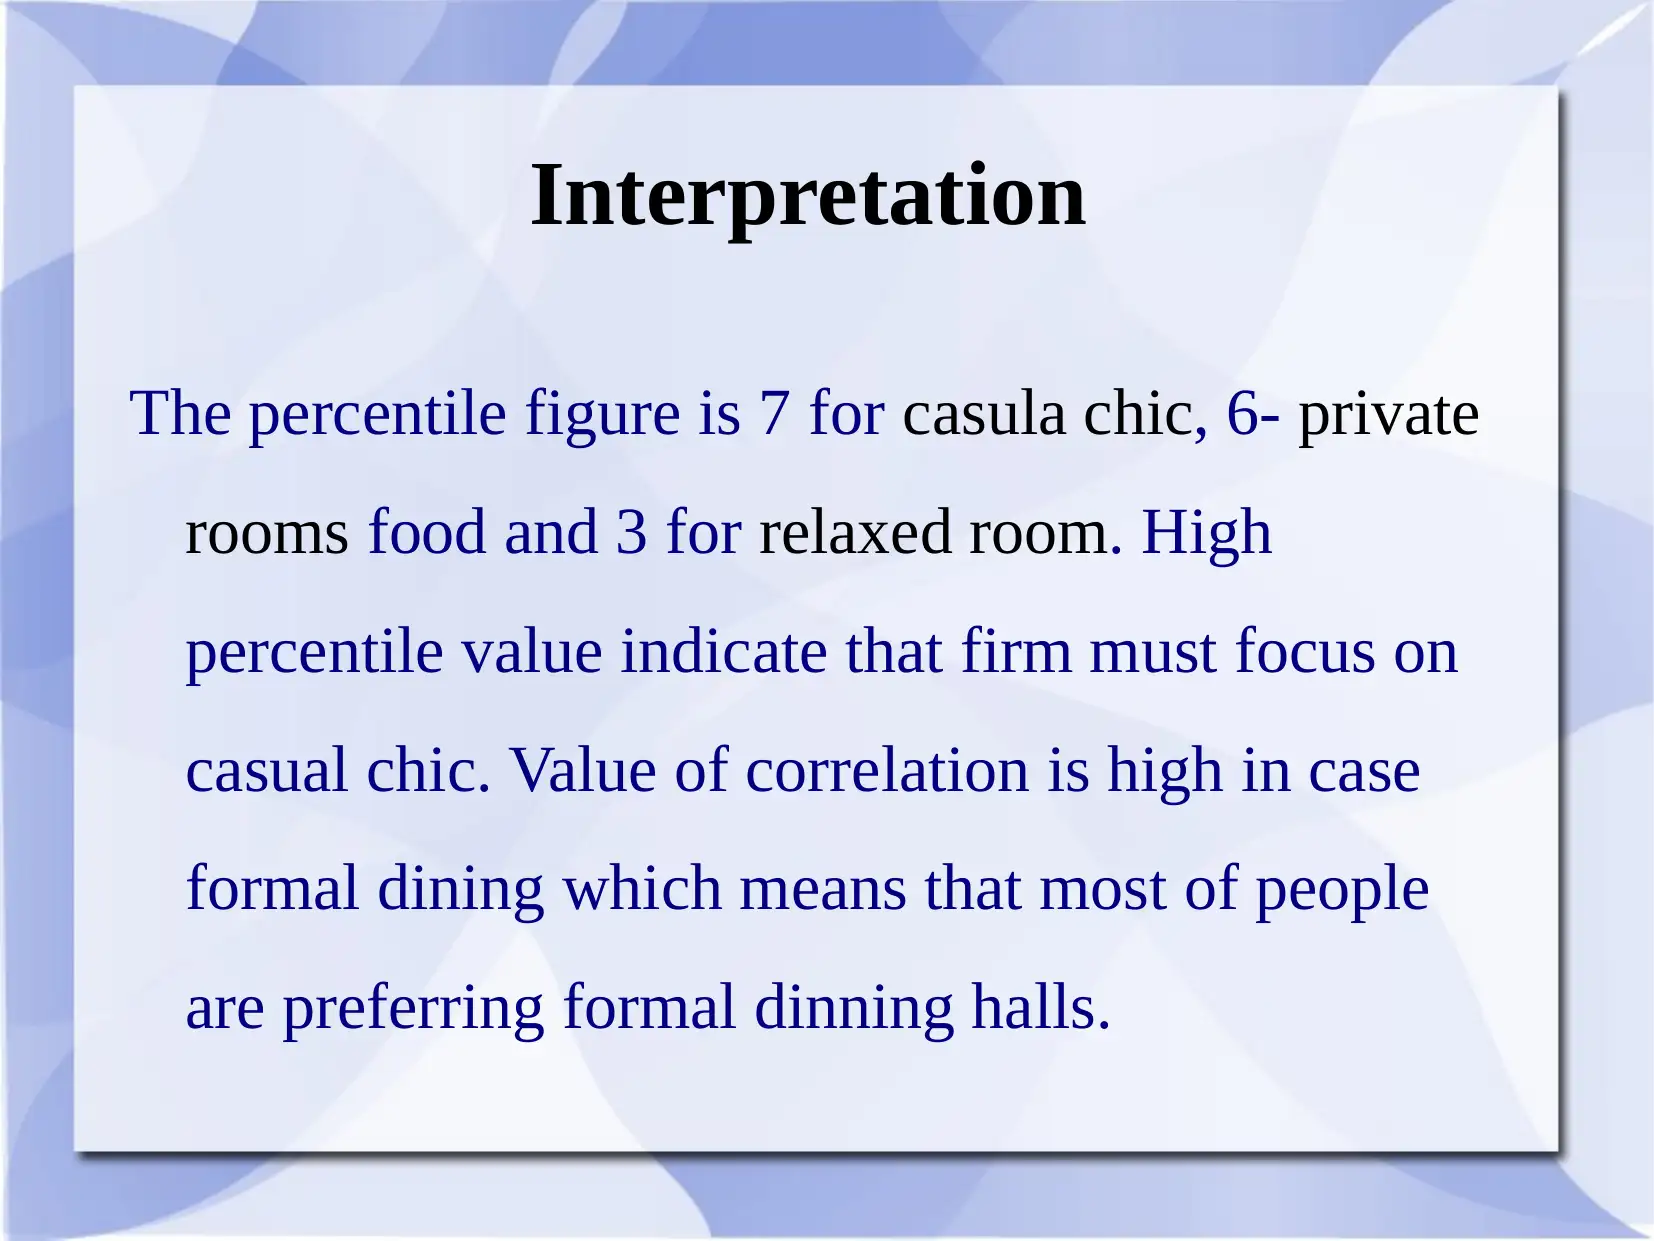
This assignment analyzes consumer preferences for restaurants, focusing on factors influencing dining choices. The data examines preferred restaurant types, important criteria like menu, environment, food quality, service, and price, and preferred dining room environments. The analysis includes descriptive statistics (mean, median, mode, standard deviation) and charts to visualize the data. It also calculates percentiles and correlation coefficients to identify key trends and relationships, such as the preference for casual chic dining rooms and a correlation between formal dining and other factors. The findings provide insights for business decision-making in the restaurant industry, helping to understand consumer behavior and optimize business strategies. References to relevant literature are also included.
Document Page
BUSINESS DECISION MAKING
tabler-icon-diamond-filled.svg

Paraphrase This Document

Need a fresh take? Get an instant paraphrase of this document with our AI Paraphraser
Document Page
Which type of restaurant you
prefer for taking lunch or dinner?
Which type of restaurant you prefer for
taking lunch or dinner?
25 30 35 40 45
Traditional 2 2 4 1 1
Homey 2 3 10 7 8
Modern 10 13 10 5 2
Combination of Traditional and Modern 5 6 4 2 3
No specific choice 4 5 4 4 3
Document Page
Cont
Which type of restaurant you prefer for
taking lunch or dinner?
Mean Media
n
Mode Standard
deviaiton
Traditional 2 2 2 1.26
Homey 6 6.5 #VAL
UE!
3.70
Modern 8 9 10 3.32
Combination of Traditional and Modern 4 4 4 1.71
No specific choice 4 4 4 0.50
Document Page
Chart
0
10
20
30
40
Column C
Column D
Column E
Column F
Column G
tabler-icon-diamond-filled.svg

Paraphrase This Document

Need a fresh take? Get an instant paraphrase of this document with our AI Paraphraser
Document Page
Most important criteria when choosing a
restaurant/1-6/
25 30 35 40 45
Menu of restaurant 6 2 2 6 5
Environment of dinning hall 2 3 5 3 3
Quality of food 5 4 6 5 6
Quality of service 3 6 3 4 4
Price of fast food at restaurant 4 5 4 2 3
Convenience 3 2 3 3 2
Other (please specify) 2 3 2 4 2
Document Page
Cont
Most important criteria when
choosing a restaurant/1-6/
Mea
n
Medi
an
Mod
e
Standard
deviaiton
Perc
entil
e
Qaur
tile
Corr
elait
on
Menu of restaurant 4.2 5.0 2.0 2.0 5.0 2.0 0.2
Environment of dinning hall 3.2 3.0 3.0 1.1 3.0 2.0 -0.7
Quality of food 5.2 5.0 5.0 0.8 5.0 4.0 0.5
Quality of service 4.0 4.0 3.0 1.2 4.0 3.0 -0.7
Price of fast food at restaurant 3.6 4.0 4.0 1.1 4.0 2.0 0.4
Convenience 2.6 3.0 3.0 0.5 3.0 2.0 -0.3
Other (please specify) 2.6 2.0 2.0 0.9 2.0 2.0 0.1
Document Page
Chart
Most important criteria when choosing a restaurant/1-6/
Menu of restaurant
Environment of dinning hall
Quality of food
Quality of service
Price of fast food at restaurant
Convenience
Other (please specify)
0
5
10
15
20
25
30
35
40
45
Column C
Column D
Column E
Column F
Column G
tabler-icon-diamond-filled.svg

Paraphrase This Document

Need a fresh take? Get an instant paraphrase of this document with our AI Paraphraser
Document Page
Which of dining Rooms below
given you often prefer in
restaurants?”Which of dining Rooms below given
you often prefer in restaurants?”
25 30 35 40 45
Casual chic 5 6 7 15 7
Formal dinning 2 8 3 10 7
Private rooms 4 7 6 10 3
Relaxed environment 10 4 3 2 1
Document Page
Cont
Which of dining Rooms
below given you often
prefer in restaurants?”
ME
AN
ME
DIA
N
mod
e
Standa
rd
deviait
on
quart
ile
Perc
entil
e
Corr
elati
on
Casual chic 8.00 7.00 7.00 4.00 5.00 7.00 0.51
Formal dinning 6.00 7.00 #VA
LUE
!
3.39 2.00 7.00 0.70
Private rooms 6.00 6.00 #VA
LUE
!
2.74 3.00 6.00 0.62
Relaxed environment 4.00 3.00 #VA
LUE
!
3.54 1.00 3.00-0.28
Document Page
Chart
0
10
20
30
40
Column C
Column D
Column E
Column F
Column G
tabler-icon-diamond-filled.svg

Paraphrase This Document

Need a fresh take? Get an instant paraphrase of this document with our AI Paraphraser
Document Page
Interpretation
The percentile figure is 7 for casula chic, 6- private
rooms food and 3 for relaxed room. High
percentile value indicate that firm must focus on
casual chic. Value of correlation is high in case
formal dining which means that most of people
are preferring formal dinning halls.
Document Page
REFRENCES
Morgan, G., 2013. Riding the waves of change.
Imaginization Inc.
Scherer, R.J. and Schapke, S.E., 2011. A distributed
multi-model-based Management Information
System for simulation and decision-making on
construction projects. Advanced Engineering
Informatics. 25(4). pp.582-599.
chevron_up_icon
1 out of 13
circle_padding
hide_on_mobile
zoom_out_icon
[object Object]