Business Decision Making: Restaurant Visit Analysis Presentation

Verified

Added on  2023/03/31

|9
|321
|411
Presentation
AI Summary
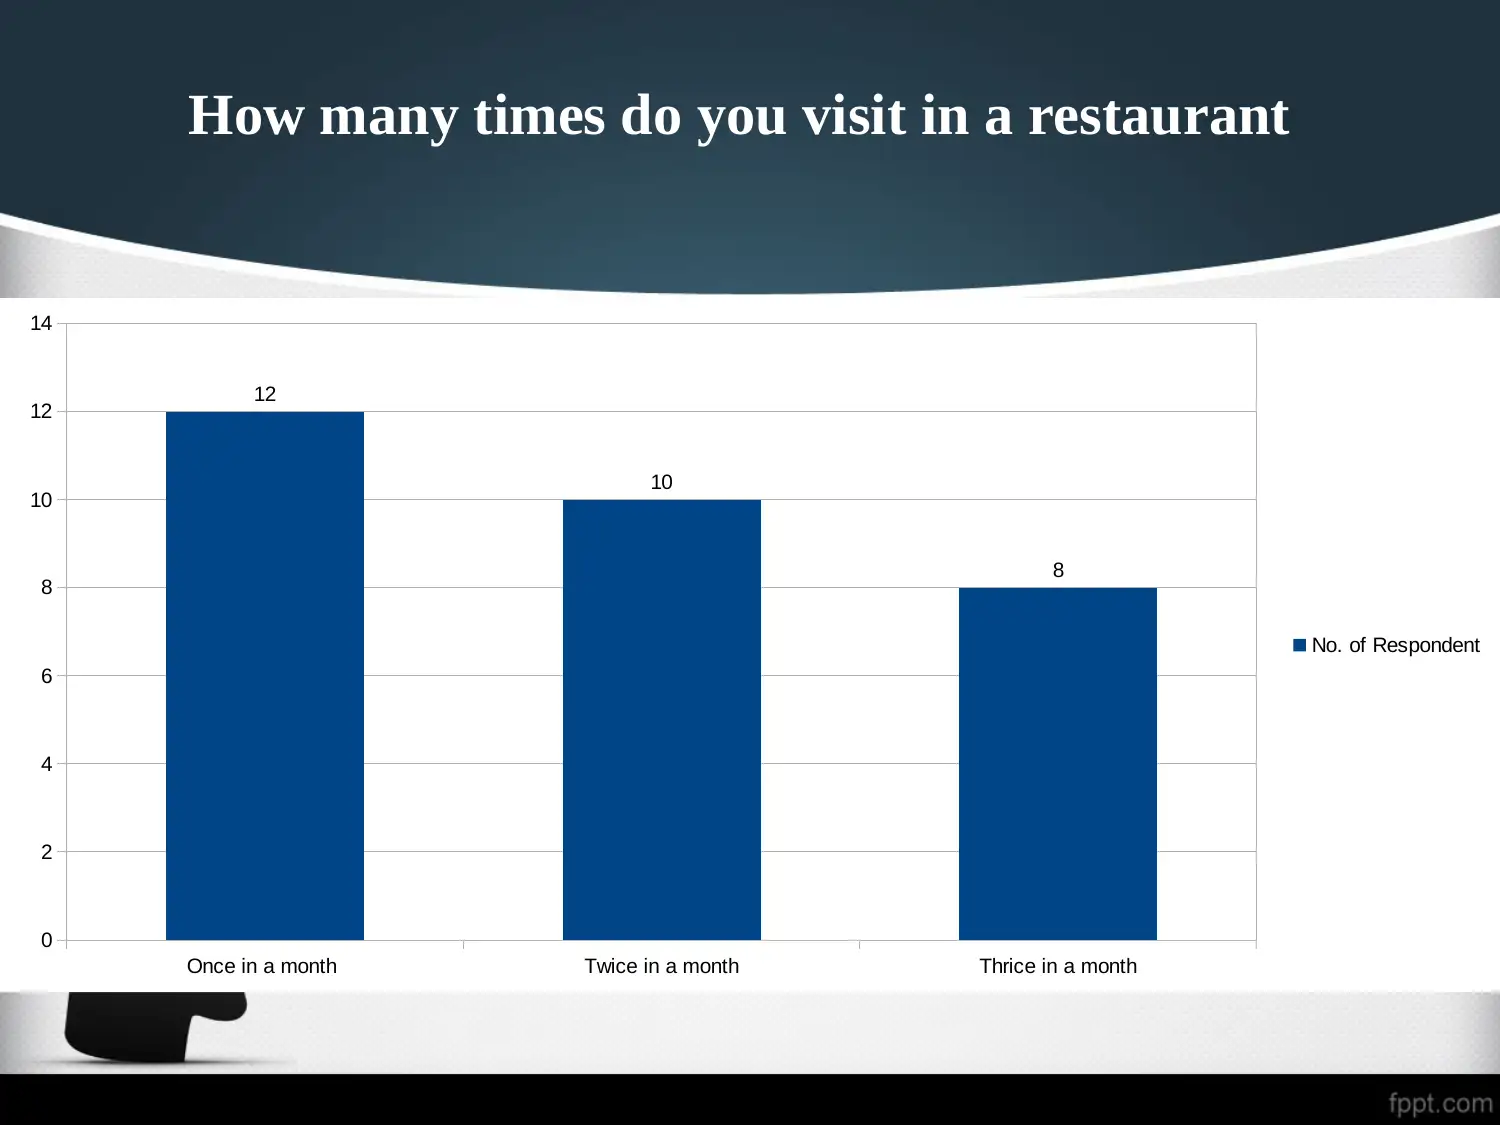
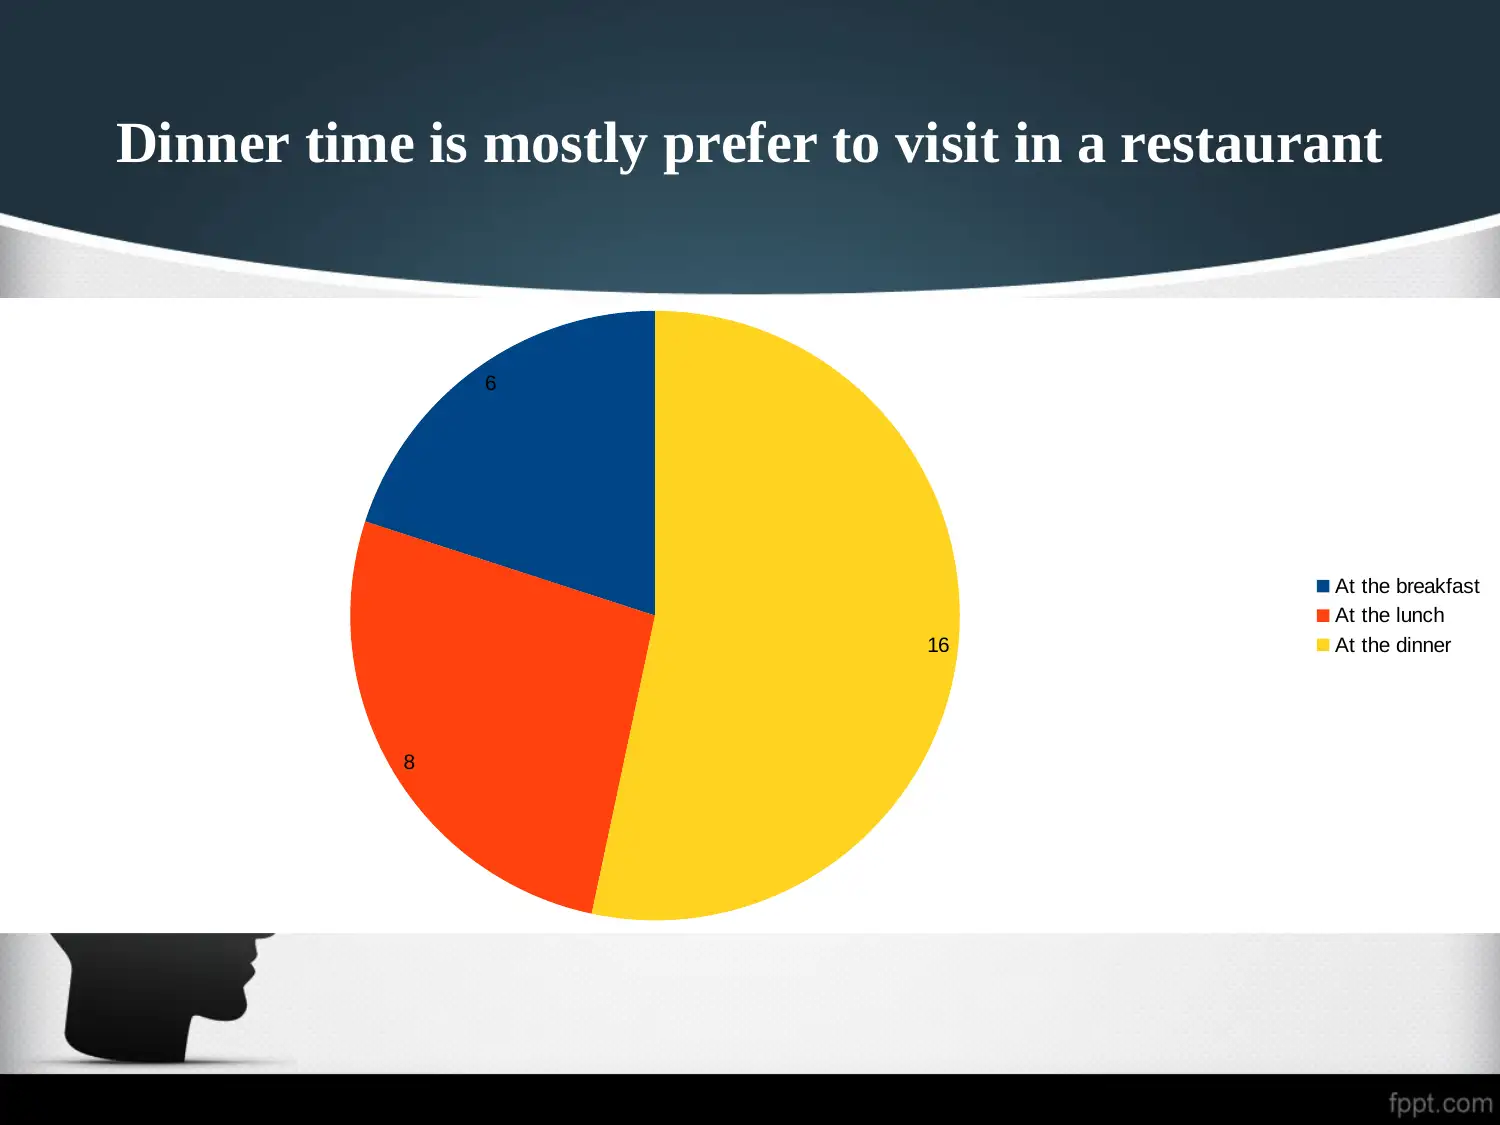
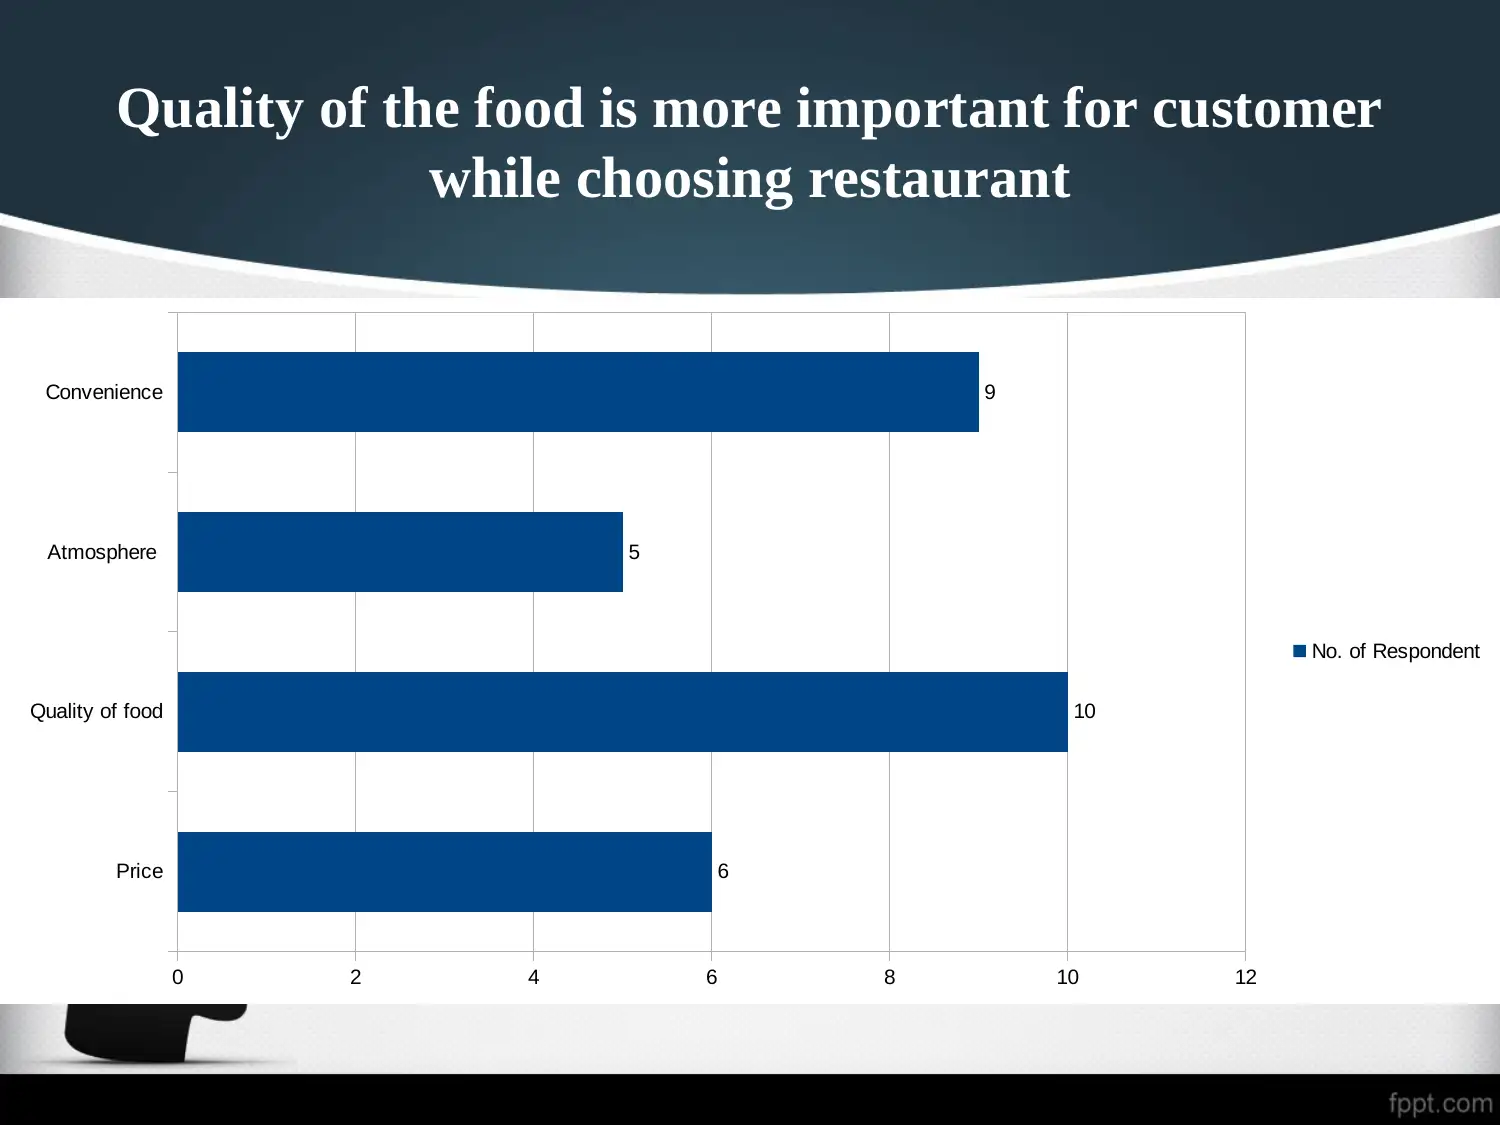
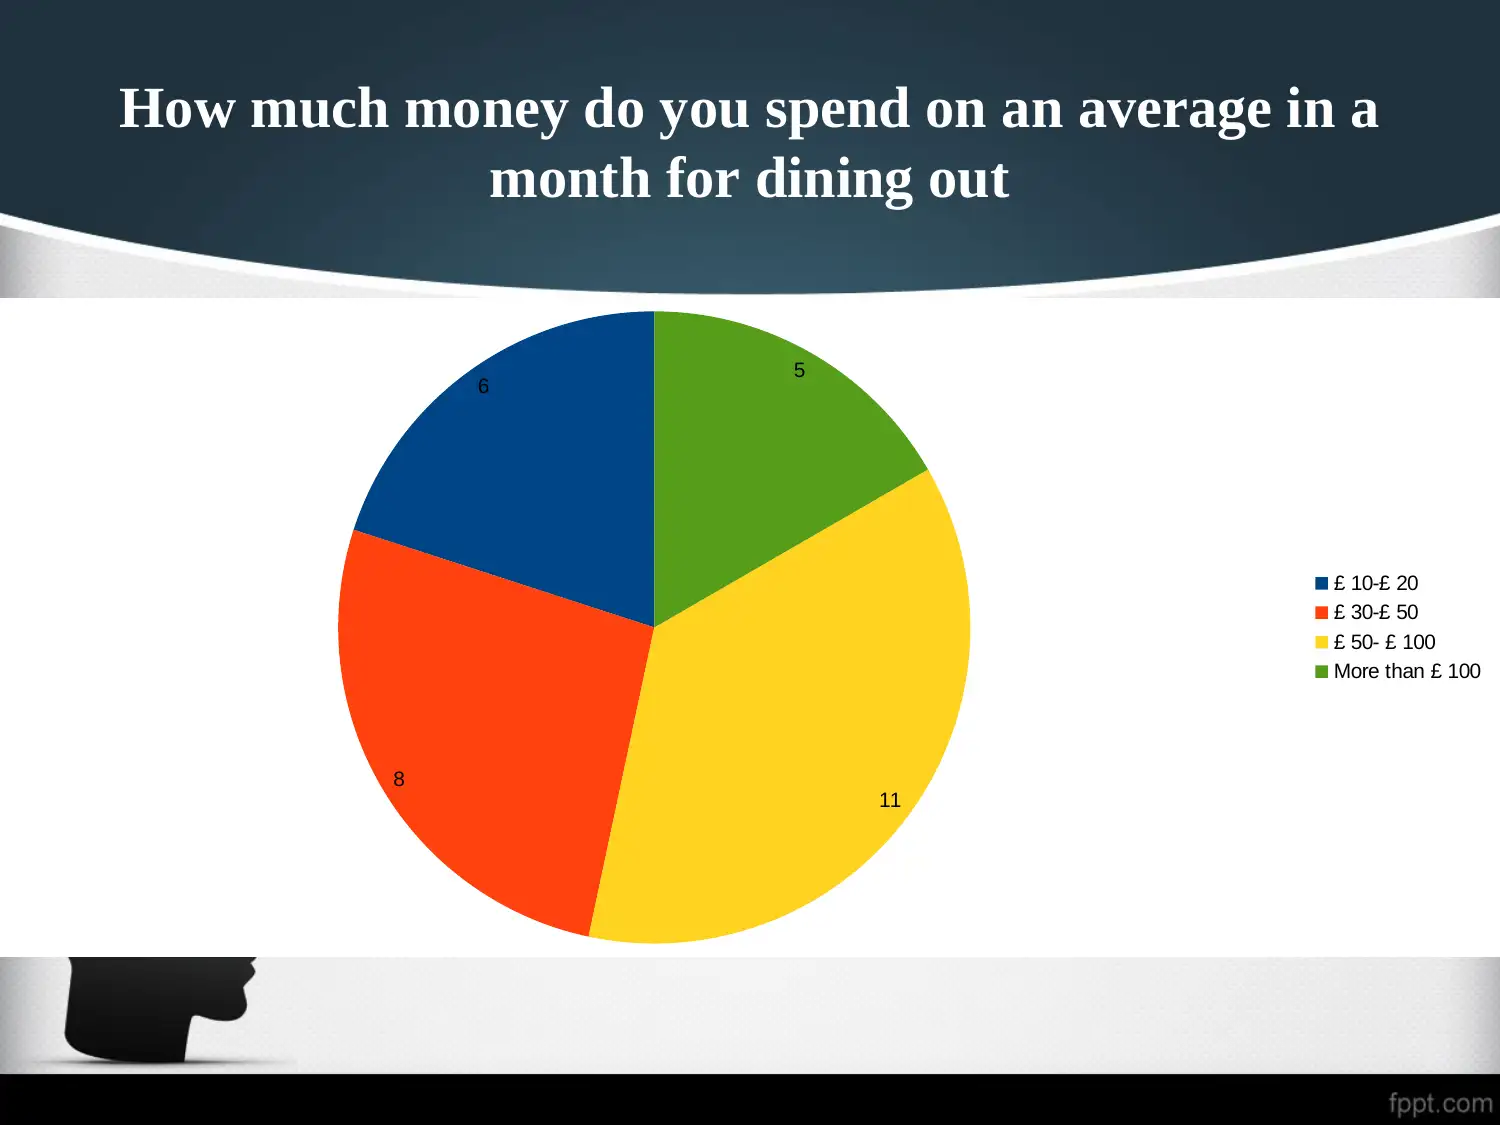
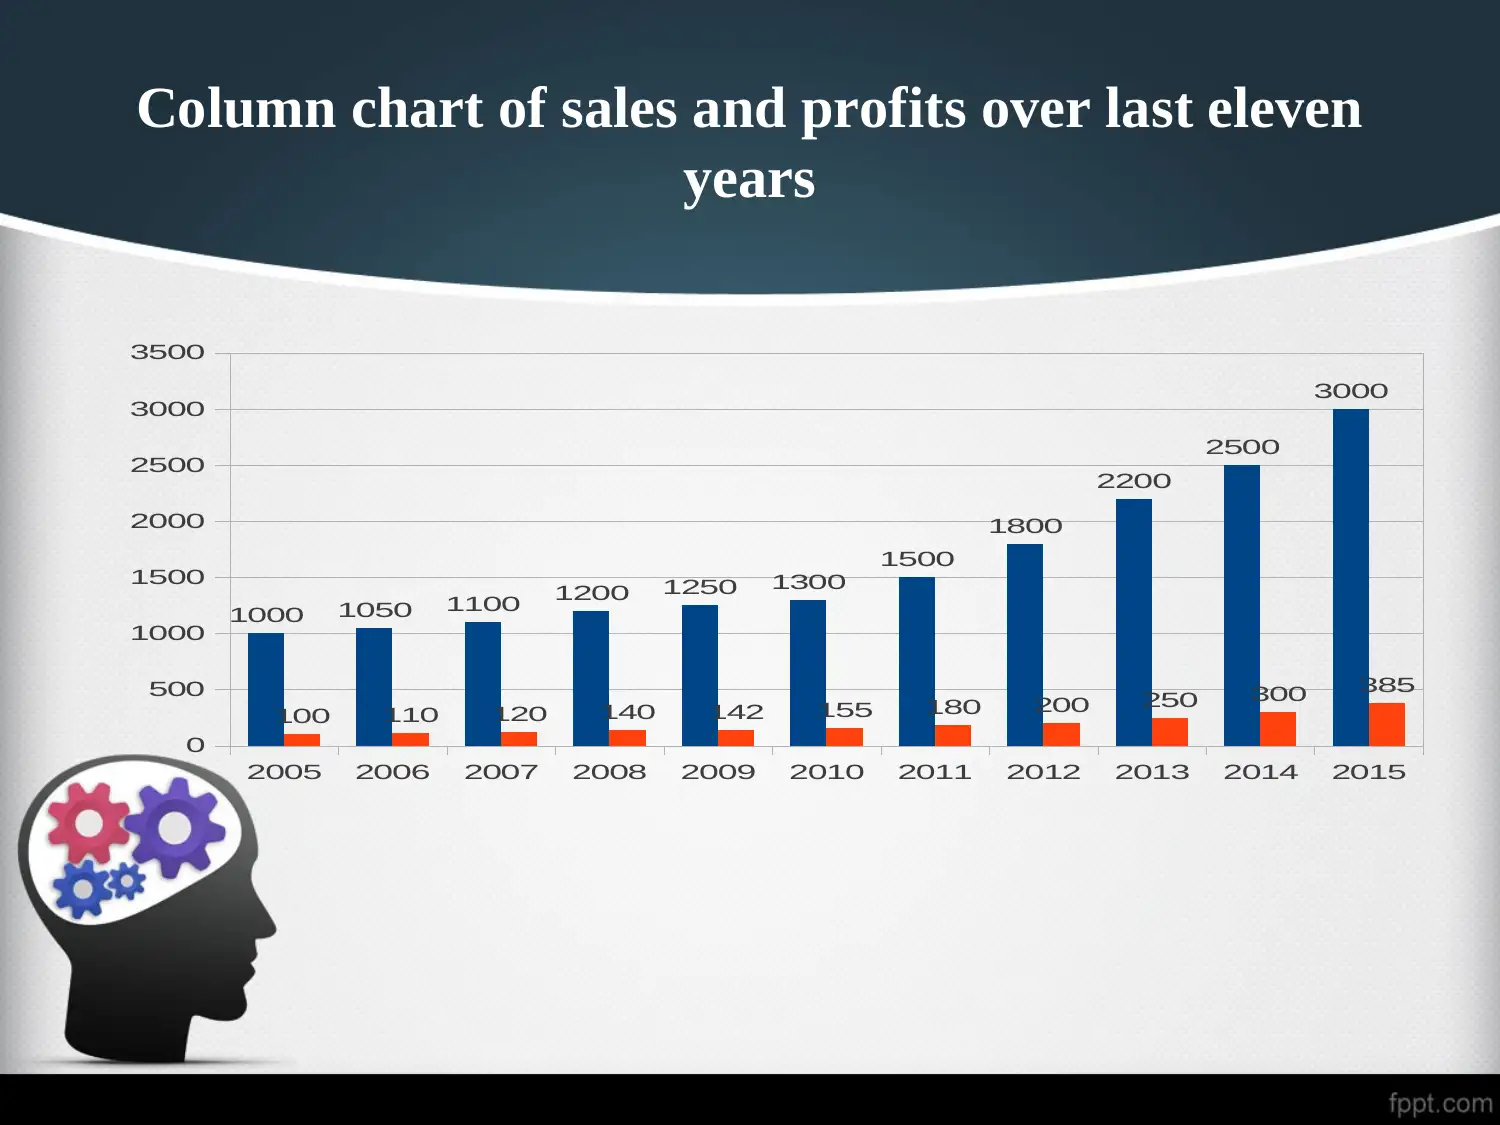
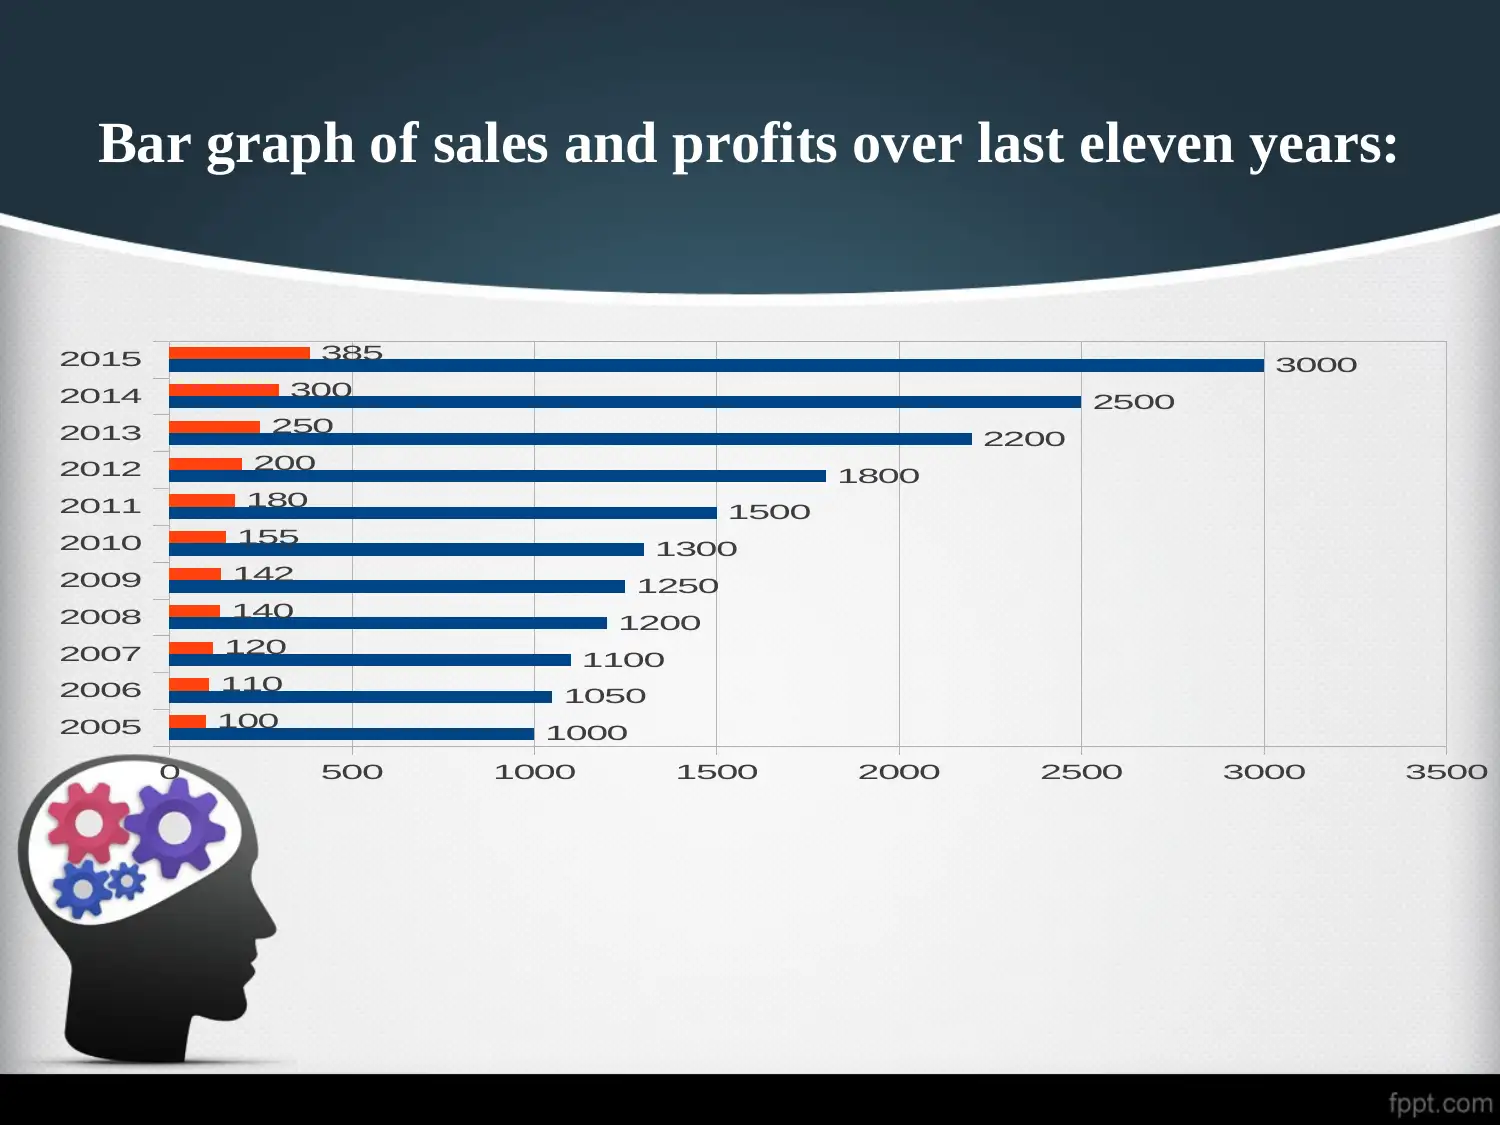
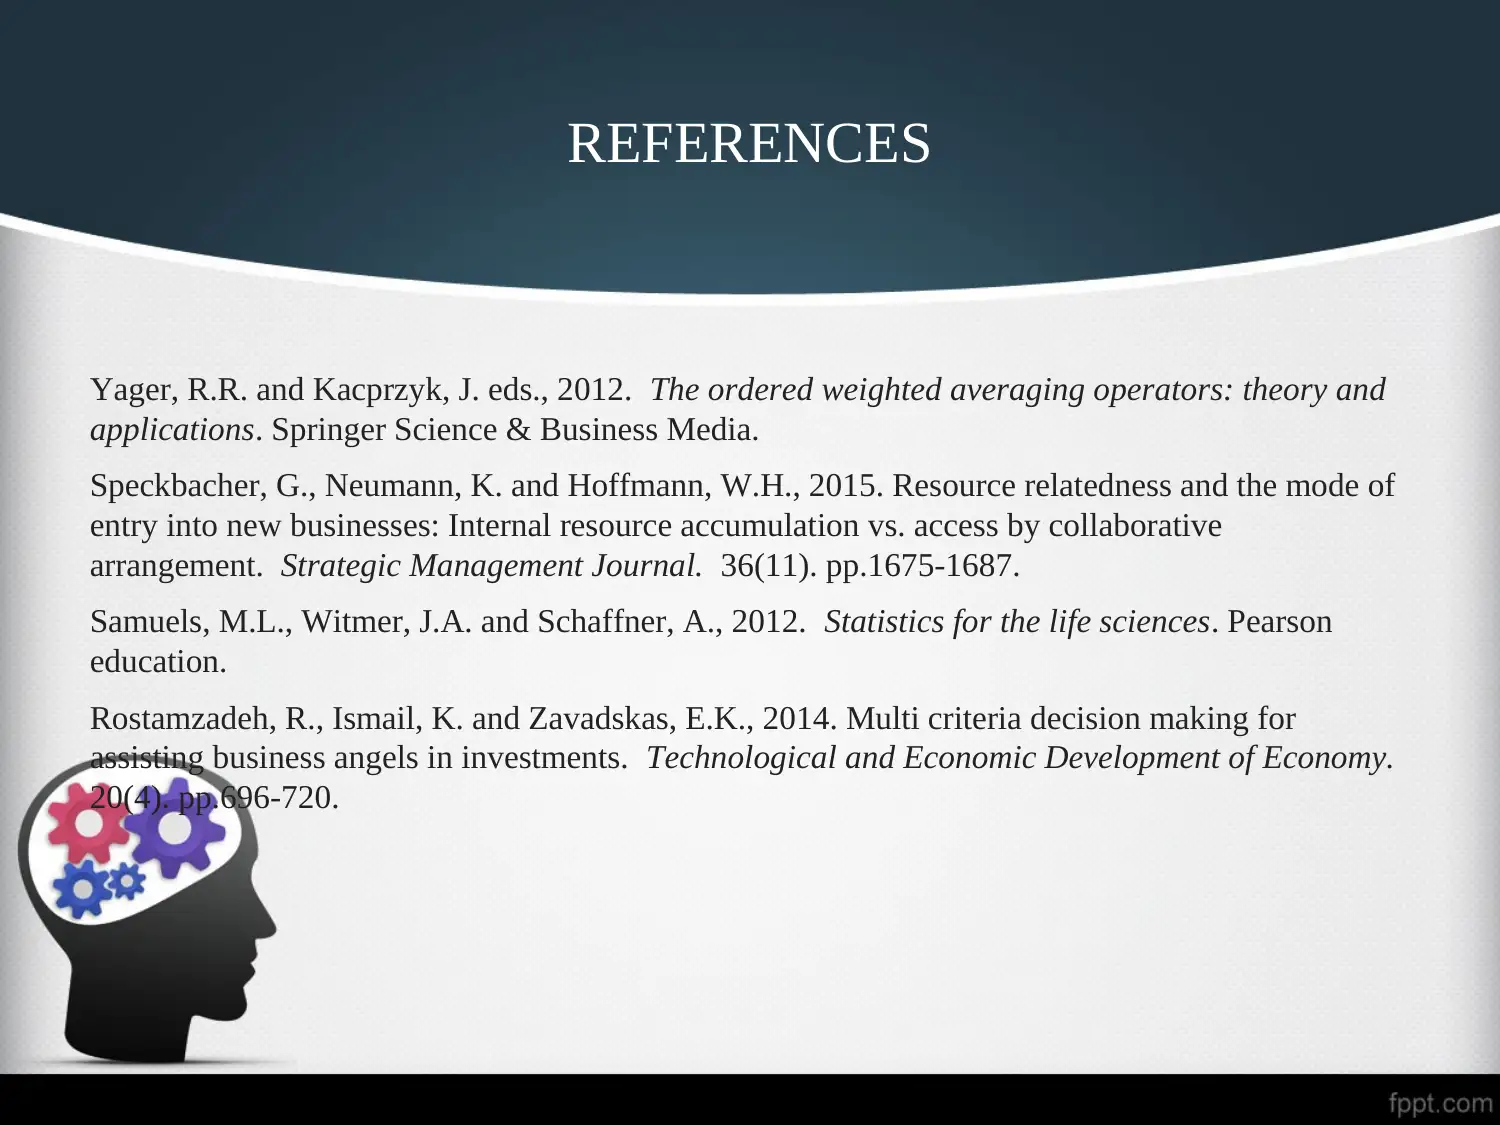
This presentation analyzes data related to restaurant visits and customer preferences. The data includes the frequency of restaurant visits, preferred dining times (breakfast, lunch, dinner), and the importance of various factors (food quality, convenience, atmosphere, price) in customer decision-making. It also presents information on customer spending habits, categorized by monthly expenditure ranges. Furthermore, the presentation includes sales and profit data over an eleven-year period, visualized through both column and bar graphs. The data is used to understand market trends, customer behavior, and financial performance. The presentation concludes with a list of relevant academic references to support the analysis. This presentation is designed to provide insights into business decision making, particularly in the context of the restaurant industry, and is available on Desklib for students seeking study resources.
Document Page
BUSINESS
DECISION MAKING
(PRESENTATION)
tabler-icon-diamond-filled.svg

Paraphrase This Document

Need a fresh take? Get an instant paraphrase of this document with our AI Paraphraser
Document Page
How many times do you visit in a restaurant
Once in a month Twice in a month Thrice in a month
0
2
4
6
8
10
12
14
12
10
8
No. of Respondent
Document Page
Dinner time is mostly prefer to visit in a restaurant
6
8
16
At the breakfast
At the lunch
At the dinner
Document Page
Quality of the food is more important for customer
while choosing restaurant
Price
Quality of food
Atmosphere
Convenience
0 2 4 6 8 10 12
6
10
5
9
No. of Respondent
tabler-icon-diamond-filled.svg

Paraphrase This Document

Need a fresh take? Get an instant paraphrase of this document with our AI Paraphraser
Document Page
How much money do you spend on an average in a
month for dining out
6
8 11
5
£ 10-£ 20
£ 30-£ 50
£ 50- £ 100
More than £ 100
Document Page
Column chart of sales and profits over last eleven
years
2005 2006 2007 2008 2009 2010 2011 2012 2013 2014 2015
0
500
1000
1500
2000
2500
3000
3500
1000 1050 1100 1200 1250 1300
1500
1800
2200
2500
3000
100 110 120 140 142 155 180 200 250 300 385
Document Page
Bar graph of sales and profits over last eleven years:
2005
2006
2007
2008
2009
2010
2011
2012
2013
2014
2015
0 500 1000 1500 2000 2500 3000 3500
1000
1050
1100
1200
1250
1300
1500
1800
2200
2500
3000
100
110
120
140
142
155
180
200
250
300
385
tabler-icon-diamond-filled.svg

Paraphrase This Document

Need a fresh take? Get an instant paraphrase of this document with our AI Paraphraser
Document Page
REFERENCES
Yager, R.R. and Kacprzyk, J. eds., 2012. The ordered weighted averaging operators: theory and
applications. Springer Science & Business Media.
Speckbacher, G., Neumann, K. and Hoffmann, W.H., 2015. Resource relatedness and the mode of
entry into new businesses: Internal resource accumulation vs. access by collaborative
arrangement. Strategic Management Journal. 36(11). pp.1675-1687.
Samuels, M.L., Witmer, J.A. and Schaffner, A., 2012. Statistics for the life sciences. Pearson
education.
Rostamzadeh, R., Ismail, K. and Zavadskas, E.K., 2014. Multi criteria decision making for
assisting business angels in investments. Technological and Economic Development of Economy.
20(4). pp.696-720.
Document Page
chevron_up_icon
1 out of 9
circle_padding
hide_on_mobile
zoom_out_icon
[object Object]