Analysis of Wine Consumption in US Restaurants: A Research Report
VerifiedAdded on 2022/09/18
|19
|12097
|34
Report
AI Summary
This research report, published in the International Journal of Wine Business Research, investigates the interaction between wine involvement, dining group dynamics, and consumption behavior in US restaurants. The study, based on an online survey of 513 respondents, segments diners into low and high wine involvement categories to examine differences in dining group size, composition, wine ordering methods, choice factors, and spending habits across various restaurant categories. The findings reveal that high-involvement diners tend to dine in larger groups, order more wine, spend more money on wine, and are more likely to be the primary decision-makers for wine selection, utilizing wine menus and displays more frequently. Furthermore, they exhibit a greater discernment for wine taste, grape variety, and style. The study's practical implications offer valuable insights for the restaurant industry, providing wine-related profile descriptions for different restaurant categories to assist in the development of effective business strategies. The research contributes to the existing body of knowledge by being the first to explore these relationships, providing a framework for understanding the complex interplay of wine involvement and dining experiences in the US restaurant environment.
See discussions, stats, and author profiles for this publication at: https://www.researchgate.net/publication/331355823
Wine involvement interaction with dining group dynamics, group
composition and consumption behavioural aspects in USA restaurant
Article in International Journal of Wine Business Research · February 2019
DOI: 10.1108/IJWBR-06-2018-0027
CITATIONS
0
READS
55
3 authors, including:
Some of the authors of this publication are also working on these related projects:
The cellar door as catalyst for wine consumption changes and multiplier of sales in the Australian wine marketView project
Adaptation to climate change in Mekong Delta, VietnamView project
Johan Bruwer
University of South Australia
137PUBLICATIONS3,386CITATIONS
SEE PROFILE
Paraphrase This Document
Need a fresh take? Get an instant paraphrase of this document with our AI Paraphraser
International Journal of Wine Business Research
Wine involvement interaction with dining group dynamics, group composition and
consumption behavioural aspects in USA restaurants
Johan Bruwer, Justin Cohen, Kathleen Kelley,
Article information:
To cite this document:
Johan Bruwer, Justin Cohen, Kathleen Kelley, (2019) "Wine involvement interaction with dining
group dynamics, group composition and consumption behavioural aspects in USA restaurants",
International Journal of Wine Business Research, Vol. 31 Issue: 1, pp.12-28, https://doi.org/10.1108/
IJWBR-06-2018-0027
Permanent link to this document:
https://doi.org/10.1108/IJWBR-06-2018-0027
Downloaded on: 11 April 2019, At: 17:53 (PT)
References: this document contains references to 49 other documents.
To copy this document: permissions@emeraldinsight.com
The fulltext of this document has been downloaded 31 times since 2019*
Users who downloaded this article also downloaded:
(2018),"New approach to segmenting tourists in a German wine region", International Journal
of Wine Business Research, Vol. 30 Iss 2 pp. 153-168 <a href="https://doi.org/10.1108/
IJWBR-07-2017-0044">https://doi.org/10.1108/IJWBR-07-2017-0044</a>
Access to this document was granted through an Emerald subscription provided by emerald-
srm:416658 []
For Authors
If you would like to write for this, or any other Emerald publication, then please use our Emera
for Authors service information about how to choose which publication to write for and submis
guidelines are available for all. Please visit www.emeraldinsight.com/authors for more informa
About Emerald www.emeraldinsight.com
Emerald is a global publisher linking research and practice to the benefit of society. The compa
manages a portfolio of more than 290 journals and over 2,350 books and book series volumes
well as providing an extensive range of online products and additional customer resources and
services.
Emerald is both COUNTER 4 and TRANSFER compliant. The organization is a partner of the
Committee on Publication Ethics (COPE) and also works with Portico and the LOCKSS initiative for
digital archive preservation.
*Related content and download information correct at time of download.
Downloaded by University of South Australia At 17:53 11 April 2019 (PT)
Wine involvement interaction
with dining group dynamics, group
composition and consumption
behavioural aspects in
USA restaurants
Johan Bruwer and Justin Cohen
School of Marketing, University of South Australia, Adelaide, Australia, an
Kathleen Kelley
Department of Plant Science, The Pennsylvania State University, University
Pennsylvania, USA
Abstract
Purpose –The importance of the wine involvement construct in explaining consumers’ wine consu
behaviour is widely acknowledged in the literature, as is the social nature of dining out with others
is a paucity of research examining the relationships between how this construct interacts with din
dynamics and wine consumption behaviouralaspects in the restaurant environment.This study aims to
investigate these aspects in US restaurants.
Design/methodology/approach –Utilising an online survey that yielded a sampleof 513
respondentsfrom across the USA who frequentedall the recognisedrestaurantcategories,
respondents are segmented into low and high wine involvementcategories using a reliable wine
involvement scale.The authors examine differences between various dining group dynamics,dining
group composition,main choice factors when ordering wine and method ofordering wine in US
restaurants.
Findings –The authors find that diners’ level of involvement with wine provides sharp insights into
significant differences between involvement and dining group dynamics,group composition,choice factors
when ordering wine and method of ordering wine in restaurants. High involvement diners dine out
groups, order more wine, spend more money on wine, are more often the main decision-maker or
for the dining group and use wine menus and wallboard displays more often when ordering than low
involvement diners.They are also more discerning about the taste of wine,grape variety and wine style in
terms of choice factors when ordering.
Practical implications –The nature and dynamics of dining groups are aspects that have profound
implications, in various ways, for the restaurant industry. The level of involvement diners have wit
strong predictor of various outcomes in terms of dining group behavioural aspects regarding wineWine-
related restaurant category-specific profile descriptions, such as those developed in this study, ca
for restaurants when creating business strategies.
Originality/value – The authors make a substantive contribution by being the firststudy to
examinethe relationshipsbetweendining group dynamics,dining group compositionand
behaviouralaspects concerning wine consumption and involvement in the restaurant environment.
The authors then map this information to derive wine-related profile descriptions for all US restau
categories.
Keywords Market segmentation, Conceptual/theoretical, Wines, Consumer behaviour,
Survey research, Scale development/testing
Paper type Research paper
IJWBR
31,1
12
Received 16 June 2018
Revised 20 August 2018
Accepted 17 September 2018
International Journal of Wine
Business Research
Vol. 31 No. 1, 2019
pp.12-28
© Emerald Publishing Limited
1751-1062
DOI 10.1108/IJWBR-06-2018-0027
The current issue and full text archive of this journal is available on Emerald Insight at:
www.emeraldinsight.com/1751-1062.htm
Downloaded by University of South Australia At 17:53 11 April 2019 (PT)
⊘ This is a preview!⊘
Do you want full access?
Subscribe today to unlock all pages.
Trusted by 1+ million students worldwide
Introduction
Wine is an important component of the US restaurant industry representing US$19.8bn in
sales value in what is the largest wine consuming market in the world. Restaurant sales in
the USA totalled US$766bn in 2017.This shows a strong upward trend from US$370bn in
2000 and US$587bn in 2010 (NationalRestaurantAssociation,2017).More specifically,
dining-drinking establishments accounted for US$548bn (72 per cent) of the total restaurant
industry sales with table service restaurants and limited service restaurants contributing US
$263bn and US$234bn respectively of that figure (National Restaurant Association,2017).
The total US wine market is worth US$44bn, and while the on-premise trade “only” has a 16
per cent share of volume it contributes a significant 45 per cent of the total market value. To
put the importance of alcoholic drinks to the US foodservice industry in further perspective,
ratios in per cent value analysis for food to drinks are 77 per cent to 23 per cent for full-
service restaurants and 23 per cent to 77 per cent for cafés/bars (Euromonitor International,
2018). While wine volumes sold in the on-premise sector have been stagnant during the five-
year period 2012 to 2017, value has increased by nearly 11 per cent during the corresponding
period (Euromonitor International,2017).This underlines the importance and potential for
further growth of wine sales in the on-premise sector.Eating out is part of the American
lifestyle to such an extentthat90 per centof consumers say they enjoy going outto
restaurants compared with “only” 66 per cent who enjoy going to grocery stores (National
Restaurant Association, 2017).
Consumer behaviour has long preoccupied marketers as they strive to best position their
product by anticipating consumer wants and needs. The consumer decision-making process
is, however,frequently complicated and can be explained by a numberof theoretical
constructs, also relevant to the foodservice market where wine represents a good example of
these phenomena (Roe and Bruwer,2017).There has,nevertheless,been surprisingly little
situationalresearch (i.e.in the restaurant situation)to explain the interaction of product,
situationaland personalfactors,more specifically,the wine productinvolvementand
consumption situation (Hirche and Bruwer,2014).While involvementwith wine as a
product has been used as an explanatory medium with consumers segmented into high- or
low-involvementcategories (Barberet al.,2007;Bruwerand Huang,2012;Hirche and
Bruwer, 2014), this has not been done in the restaurant setting.
According to Sobal and Nelson (2003),the eating of food by humans is largely a social
activity to such an extent that “eating alone is devalued and is not considered a real meal for
many people” (p.88). Hence, in the restaurant setting by far, the majority of people are dining
in a group situation with otherpeople (Herand Seo,2018)and solo dining is fairly
uncommon (Bruwer and Johnson,2005).The size of the dining group,the nature of the
relationships between dining group members and the composition of the group are likely to
have an impact on the consumption behaviour related to products being offered in the
restaurant,such as wine.There is a paucity of research focused on wine consumption and
dining group dynamics,composition and decision-making,and no previous study has
examined the potential relationship(s) between these variables and wine involvement, which
is a firmly grounded theoretical construct. There has also been no research linking these to
the various restaurant categories (full-service family,casual ethnic foodservice,fine dining
upscale,bar/taverns,cafeteria/grill/buffetand quick-service/limited service restaurants),
either in the USA, which is the focal market of our study, or elsewhere.
Our study makes a substantive contribution in four ways.Firstly,by examining how
wine involvement levelrelates to dining group dynamics and dining group composition.
Secondly,by determining how wine involvementlevelrelates to the amountof wine
consumed and amount spent on wine in restaurants. Thirdly, by identifying the main choice
Wine
involvement
interaction
13
Downloaded by University of South Australia At 17:53 11 April 2019 (PT)
Paraphrase This Document
Need a fresh take? Get an instant paraphrase of this document with our AI Paraphraser
factorsused by low-versushigh-involvementconsumerswhen ordering winein a
restaurant and method(s) of ordering it. Finally, it provides a wine-related profiling
grid for all restaurant categories in the US market.
Literature review
There has been a multitude ofresearch studies focusing on wine in the hospitality
environment,specifically within the restaurant domain.These include,but are not limited
to, wine service training (Gultek et al., 2005); wine menu/list design (Barth, 2011; B
et al.,2009;Gil et al.,2009;McCall and Lynn,2008),wine origin (Bruwer et al.,2012),risk
perception and risk reduction (Bruwer et al., 2017a; Lacey et al., 2009; Terrier and
2016),and wine involvement (Barber etal.,2007;Bruwer and Huang,2012;Hirche and
Bruwer,2014;Hollebeek and Brodie,2009;Roe and Bruwer,2017).Despite some advocacy
for marketsegmentation based on consumers’wine involvement(Barberet al.,2007;
Lesschaeve and Bruwer,2010),no previous study has focused solely on diners in the
restaurant environment and explored relationships between involvement, dining gr
and composition, etc.
Role of wine in restaurants
Wine is widely served as a food accompanimentin restaurants.It is also a generally
accepted fact that the sale of wine can add significantly to a restaurant’s profitabili
2011; Berenguer et al., 2009; Frost, 2015; Gil et al., 2009; Hansen, 2015; Wansink
For example, in Australia, profitability varies between 26 per cent and 29 per cent (
and Johnson,2005;Bruwer et al.,2012),and in Spain,it accounts for 32 per cent of the
average restaurant bill(Gilet al.,2009).However,studies have discovered that selecting
wine in a restaurant is associated with a stressfulexperience and has an associated risk
perception (Bruwer et al., 2017a; Lacey et al., 2009). Nevertheless, surprisingly litt
has been conducted on illuminating various aspects of the dining occasion and spe
the dining group,method of ordering wine,choice factors and wine involvement level,as
these relate to wine consumption in restaurants.
Wine product involvement and wine purchasing
The historical roots of the involvement construct can be found many decades ago i
psychology,but it was not untilthe mid-1980s that researchers began to understand the
importance of studying this construct for the purpose of segmenting markets (Less
and Bruwer,2010).It has been described as “a person’s perceived relevance of the ob
based on inherent values,needs and interests” (Zaichkowsky,1985,p. 342).Much of the
initialinvolvementresearch focused on its role in advertising (Celsiand Olson,1988;
Laurentand Kapferer,1985).Since then,the involvementconstructhas received much
attention due to its significantinfluence on consumer purchasing behaviour (Dholakia,
2001).
Although involvement theory views consumer behaviour as a continuum coverin
range of cognitive and behaviouralprocesses (Barber et al.,2009,p. 61),from early on,
researchers (Bloch, 1981; Bloch and Richins, 1983; Celsi and Olson, 1988; Richins e
distinguished between enduring involvement and situational involvement in the pro
studying involvement.In its simplestform,a primary distinction between enduring
involvement and situationalinvolvement is temporalduration (Richins and Bloch,1986).
Enduring involvementis a ratherstable phenomenon thatrepresents the consumer’s
personalinterest in the productclass over a long period (Park etal.,2013).Situational
involvement,on the other hand,is the temporary arousalof a consumer’s interest that
IJWBR
31,1
14
Downloaded by University of South Australia At 17:53 11 April 2019 (PT)
fluctuates,usually within the timeframe of a purchase decision (Park et al.,2013),such as
ordering a bottle of wine or wine by-the-glass (WBG) from a restaurant’s wine list when
dining there (Bruwer and Cohen,2019).Situationalinvolvementis the outcome ofthe
consumer’s interaction with the productand the purchase situation.It is an incorrect
assumption that a consumer with low involvement in a certain product would always put
little effort in purchasing (Hirche and Bruwer, 2014).
Both enduring and situationalinvolvementrepresentstates ofarousaland product
interest.Both also have similar behaviouraloutcomes such as information search and
dissemination (Ogbeide and Bruwer,2013;Richins and Bloch,1986).There is considerable
evidence that information seeking is used mainly as a risk-reduction strategy in response to
risk perceptions and has been identified as an important risk-reduction strategy in wine
purchasing (Bruwer et al.,2017a).In the current study,we examine methods of ordering
wine using information (i.e. wine menus, table talkers, etc.) provided in restaurants.
Wine has long been regarded as a product category well suited to involvement research
with the firstwine-specific involvementstudy executed by Zaichkowsky (1985).Not
surprisingly, research has identified involvement as an important variable that has a certain
impact upon consumer behaviour in the wine market (Lesschaeve and Bruwer, 2010). Wine
involvement has been loosely referred to as one’s personal involvement with wine (Barber
et al., 2007) and the demonstrated relevance of involvement in wine purchasing is supported
by several studies (Barber et al.,2007;Bruwer and Buller,2013;Bruwer and Huang,2012;
Hirche and Bruwer, 2014; Ogbeide and Bruwer, 2013). Involvement has also been linked to
wine buying and it has been shown that consumers with different levels of involvement
behave differently (Bruwer and Huang, 2012; Hirche and Bruwer, 2014). Zaichkowsky (1985)
is of the opinion that the use of key attributes such as grape variety,region of origin and
price is influenced by involvement.There is,nevertheless,a dearth of research examining
the role of wine involvement in the restaurant environment among diners and how this
relates to aspects such as dining group behaviour and decision-making.
Dining group dynamics and composition
The literature emphasises that communal eating and sharing mealtimes with other people is
a deeply embedded human behaviour (Sobal and Nelson, 2003). Unsurprisingly, the intense
social nature of dining out in restaurants has,thus,been well documented (Alonso et al.,
2013; Bruwer and Johnson, 2005; Her and Seo, 2018; Sun and Morrison, 2007). Moreover, in a
service environmentsuch as restaurants,other individuals have been highlighted as a
crucialhuman factor,influencing consumers’affective and cognitive responses (Her and
Seo,2018;Liu and Mattila,2015).People form their self-concept (Roe and Bruwer,2017)
according to the social identity theory and also the social categorization theory with respect
to which social groups or categories the individual belongs to,is affiliated with and feels
psychologically connected to (White and Dahl, 2007).
In response to the question if the presence of others affects how much other people eat,
Herman, Roth and Polivy (2003, p. 873) go as far as to emphatically answer “definitely yes”.
However, depending on the explanatory theory used to understand such behaviour, people
eat either more or less when dining in the company of others depending on the amounts their
dining companions eat(Herman etal.,2003).Whilst severalstudies (Dibb-Smith and
Brindal,2015;Polivy and Pliner,2015;Salvy et al.,2007) examined and made conclusions
about the effects of group dynamics and composition (also known as socialfacilitation
theory)on food consumption,thereis a lack of similarresearch focused on wine
consumption in restaurants.
Wine
involvement
interaction
15
Downloaded by University of South Australia At 17:53 11 April 2019 (PT)
⊘ This is a preview!⊘
Do you want full access?
Subscribe today to unlock all pages.
Trusted by 1+ million students worldwide
Given the general consensus that the majority of people dine out in restaurants
situation and the fact that the very nature of wine consumption is highly social(Bruwer
et al., 2012), we combine this with the fact that people with high wine involvement
highly likely to provide information about wine to others. Considering that people w
both a high involvement in and expertise of the wine product category are likely to
impress others (Roe and Bruwer, 2017; Hollebeek and Brodie, 2009; Lesschaeve an
2010), we derive the study’s first hypothesis and postulate that:
H1. Diners with a high level of wine involvement are more likely to be part of a la
dining group than those with a low wine involvement level.
Another aspect to consider when examining the nature of the dining group is the ty
relationship(s) a focal person has with the other group members.This can range between
extremes from a close spousalrelationship to a complete stranger such as a potential
business associate who is being met for the first time. In between the two, there ar
less close relationships such as with family, friends and work colleagues and combi
thereof, depending on the size of the dining group. There exists a dearth of informa
provides guidance regarding the potential setting of a hypothesis to direct the exam
of the nature of the relationship between group members and wine involvement le
we also set no specific hypothesis in this regard. We, nevertheless, examine this as
a view to providing direction for future studies to set hypotheses and add to the the
Quantity consumed and amount of money spent on wine
Although the group context is widely acknowledged as influencing quantity of food
and consumed (Alonso et al., 2013; Dibb-Smith and Brindal, 2015; Her and Seo, 2018;
and Pliner,2015),no similar study has been executed to examine wine ordering and
consumption in the contextof restaurants.This lack ofinformation relating to group
dynamics when considering wine in restaurants include baseline metrics such as th
the dining group. Our study contributes by examining these aspects.
When considering whether involvement level affects the quantity of wine consum
the amount of money spent on wine,there is a body of evidence confirming that high-
involvement wine drinkers spend more money on wine and consume larger quantit
low involvement drinkers (Barber et al., 2007; Bruwer and Huang, 2012; Gultek et a
Hirche and Bruwer, 2014). We, therefore, derive H2 and H3:
H2. Diners with a high levelof wine involvementconsume more wine than low
involvement diners when dining out in a restaurant.
H3. Diners with a high level of wine involvement spend more money on wine tha
involvement diners when dining out in a restaurant.
Decision-making, choice factors and method of ordering wine
There has also been little research on decision-making when ordering wine in a res
setting. Moreover, this decision is consistently referred to as being “complicated” (
Berenguer et al.,2009;Bruwer et al.,2017b;Bruwer and Huang,2012;Bruwer et al.,2012;
Gil et al., 2009; Lacey et al., 2009). This is not surprising, given the fact that wines
restaurant are generally not pre-viewed as they would be in a retail store, but inste
using a wine menu/list, which in a dining group situation has associated social pres
research contributes by not only identifying the incidence of primary decision-maki
IJWBR
31,1
16
Downloaded by University of South Australia At 17:53 11 April 2019 (PT)
Paraphrase This Document
Need a fresh take? Get an instant paraphrase of this document with our AI Paraphraser
ordering wine, but also by pinpointing the socio-demographics of the decision-maker within th
dining group. Firm theoretical grounding is provided by anchoring this aspect within the wine
involvement construct from which we derive H4:
H4: Diners with a high level of wine involvement are more often the main decision-
makerwhen ordering winein a restaurantthan thosewith a low wine
involvement level.
It stands to reason that the previously discussed social cues and group pressures affect
behaviour in the restaurant environment (Dibb-Smith and Brindal,2015;Herman et al.,
2003),even more so when wine involvement levelis considered to be an independent
variable. More specifically, the effect on the diners’ ordering method of wine (Barth, 2011)
and the main choice factors used when ordering wine (Lacey etal.,2009)should be
considered.Amongst the choice factors when selecting wine,taste,wine style (i.e.red or
white)and grape variety (i.e.CabernetSauvignon or Chardonnay)and price tend to
dominate the decision (Bruwer and Johnson,2005;Lacey et al.,2009).Through H5,H6
and H7, we therefore postulate that:
H5. Diners with a high level of wine involvement are more likely to use the wine menu
when ordering wine in a restaurant than those with a low wine involvement level.
H6. Diners with a low level of wine involvement are more likely to use the advice of
service staffwhen ordering wine in a restaurantthan those with a high wine
involvement level.
H7. Diners with a high level of wine involvement are more likely to use the taste of wine,
wine style and grape variety as the main choice factors when ordering wine in a
restaurant than those with a low wine involvement level.
Methodology
The main aim of this study is to identify how diners’ involvement with wine impacts their
wine consumption behaviour when dining in US restaurants and how this relates to the
nature, composition and size of their dining group. During the operalisation process, a scale
was designedfor measuringthe diners’wine involvementlevel.To date,most
wine involvement studies either developed/used scales that measured only the enduring
wine involvementconstruct(Barber etal.,2007;Bruwer and Buller,2013;Bruwer and
Huang,2012;Hirche and Bruwer,2014;Hollebeek and Brodie,2009).In the restaurant
context,which is very situation-specific,it is essentialthatthe (temporal)situational
involvement construct also be incorporated in the measurement of wine involvement. A five-
item involvement scale developed by Dholakia (2001) brought together both components of
involvement and delivered robust results. Therefore, given the fact that no similar scale with
wine as product focus has been developed, we adopted Dholakia’s (2001) scale and adjusted
it to wine as a productand restaurants as its situation-specific context.As far as the
practicalimplications ofthis study are concerned,the main aim is to develop profile
descriptions, informed by the study’s findings, for all US restaurant categories.
Sample
An online survey was executed in the USA by engaging a professionalconsumer panel
company involving people of legal drinking age (21 years and older) who consumed wine
and had dined out at least once during the previous month at any one of the US restaurant
Wine
involvement
interaction
17
Downloaded by University of South Australia At 17:53 11 April 2019 (PT)
categories(Canzianiet al., 2016;NationalRestaurantAssociation,2017)wherethey
consumed wine on that occasion. All information obtained from the respondents re
to their last dining occasion in a restaurant.The online survey eliminated the logistical
issues and invasion of diners’privacy that occurs when information is collected in situ at
restaurants whilst providing the advantage of sampling across the USA and its diffe
restaurant categories. Table I exhibits the socio-demographic characteristics of the
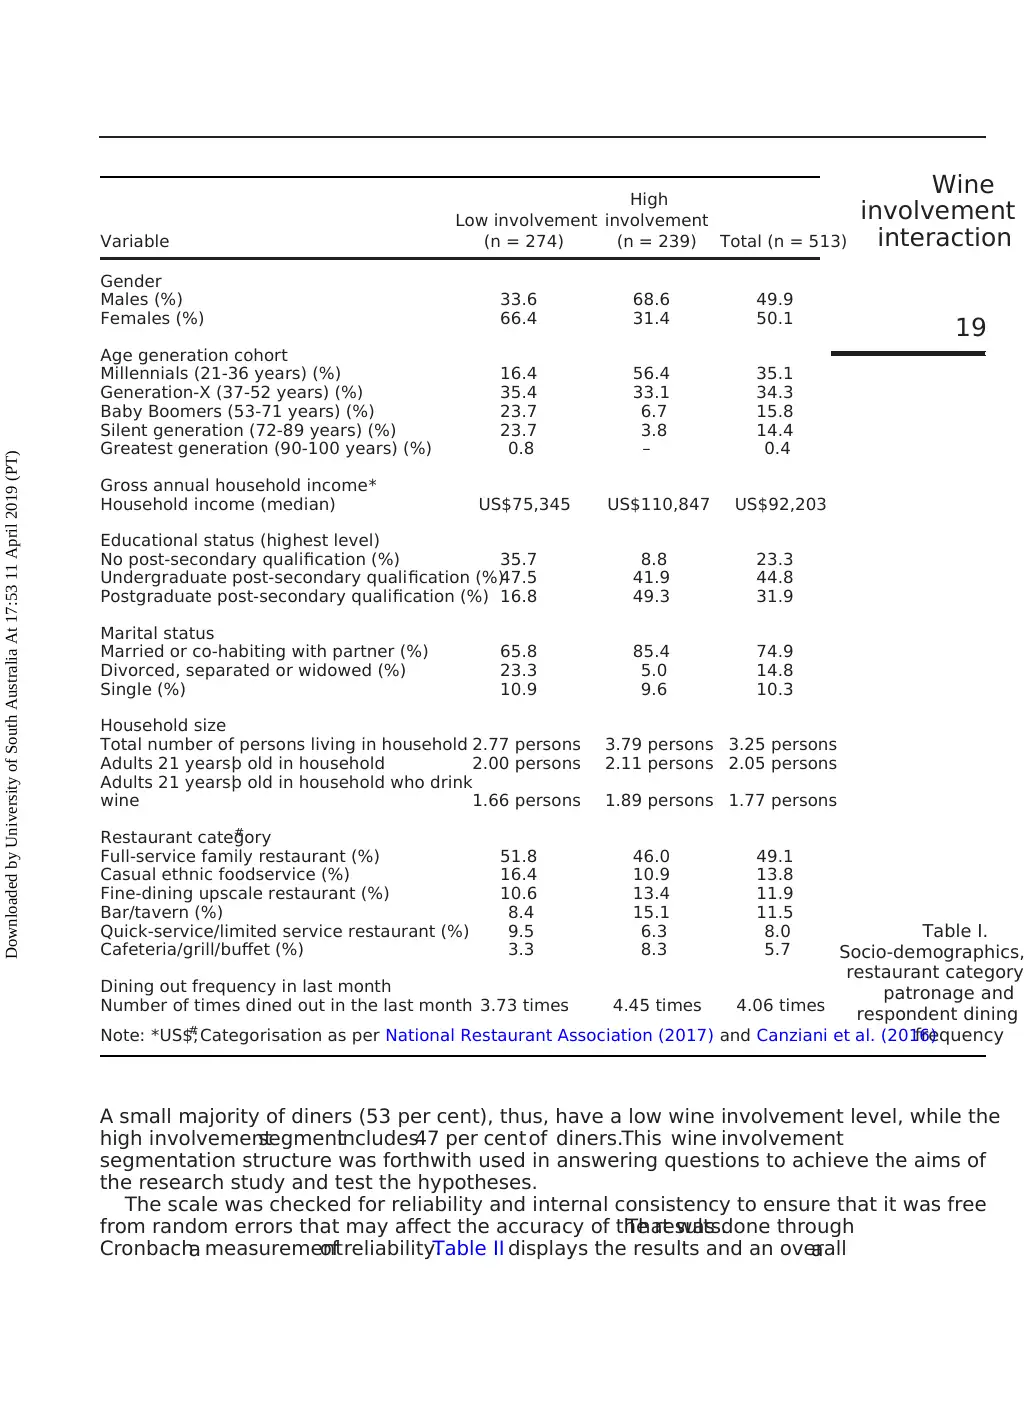
Table I shows that 50.1 per cent of the respondents are male and 49.9 per cent f
main age generationalcohorts are 21-36-year-old millennials (35 per cent),37-52-year-old
Generation-Xers (34 per cent) and 53-71-year-old Baby Boomers (16 per cent), 75
married or co-habiting in a household with a partner,have a household size of “only” 3
persons, 76 per cent have a university bachelor degree or college educational qual
with a mean annualgross household income ofUS$92,203.In terms ofidentifying the
restaurant category where the respondents’most recent dining experience took place prior
to participating in the survey,Table I reveals that full-service family restaurants (49 per
cent) are patronised the most by far,followed by casual ethnic food service (14 per cent),
fine-dining upscale (12 per cent),bar/tavern (12 per cent),with the remaining restaurant
categories making up the remaining 13 per cent.Moreover,the average number of dining
out occasions of four times a month is reflective of diners with a high level of exper
the restaurant environment.
Procedure
An online survey programmed in Qualtrics was used to collect the information with
controls inserted in the case of the involvement measurement scale used. An onlin
eliminated the logistical issues and invasion of diners’ privacy faced when having t
information in situ in restaurants,an aspecthighlighted byBruwer etal. (2017a).The
respondents took on average 13 min to complete the survey which was part of a la
project.There were five involvementscale questions and 15 demographic and other
categorical questions. The data were collected during a one-week period in 2017. O
initial responses, 615 were completed, resulting in a 46 per cent response rate. How
to incomplete responses to survey questions,513 surveys could be utilised for further
analysis. We analysed the data using IBM SPSS 24.0 software.
Segmenting diners into wine involvement segments
The results in Table II were used to split the respondents into segments based on th
involvement with wine using a five-item seven-point Likert scale that combined end
and situationalinvolvement which we adapted from Dholakia (2001).The resulting final
wine involvement measurement construct was used to segment the sample into tw
consumer groups (low and high involvement).
After re-specification, the possible involvement score range was 5 to 35 (minimu
of 1 * 5 and maximum score of7 * 5).Each respondentwas then recoded into “high
involvement” (above the median) and “low involvement” (below the median = 21)
overall involvement score was calculated for the five scale items with involvement
ranging between 5 and 35 with a mean = 21.1 and median = 21.0. This yielded bre
to allow splitting involvement into two different categories, with answers spread th
the whole range:
(1) high involvement: overall score = 22 to 35: 46.6 per cent of respondents; an
(2) low involvement: overall score = 5 to 21: 53.4 per cent of respondents.
IJWBR
31,1
18
Downloaded by University of South Australia At 17:53 11 April 2019 (PT)
consumed wine on that occasion. All information obtained from the respondents re
to their last dining occasion in a restaurant.The online survey eliminated the logistical
issues and invasion of diners’privacy that occurs when information is collected in situ at
restaurants whilst providing the advantage of sampling across the USA and its diffe
restaurant categories. Table I exhibits the socio-demographic characteristics of the
Table I shows that 50.1 per cent of the respondents are male and 49.9 per cent f
main age generationalcohorts are 21-36-year-old millennials (35 per cent),37-52-year-old
Generation-Xers (34 per cent) and 53-71-year-old Baby Boomers (16 per cent), 75
married or co-habiting in a household with a partner,have a household size of “only” 3
persons, 76 per cent have a university bachelor degree or college educational qual
with a mean annualgross household income ofUS$92,203.In terms ofidentifying the
restaurant category where the respondents’most recent dining experience took place prior
to participating in the survey,Table I reveals that full-service family restaurants (49 per
cent) are patronised the most by far,followed by casual ethnic food service (14 per cent),
fine-dining upscale (12 per cent),bar/tavern (12 per cent),with the remaining restaurant
categories making up the remaining 13 per cent.Moreover,the average number of dining
out occasions of four times a month is reflective of diners with a high level of exper
the restaurant environment.
Procedure
An online survey programmed in Qualtrics was used to collect the information with
controls inserted in the case of the involvement measurement scale used. An onlin
eliminated the logistical issues and invasion of diners’ privacy faced when having t
information in situ in restaurants,an aspecthighlighted byBruwer etal. (2017a).The
respondents took on average 13 min to complete the survey which was part of a la
project.There were five involvementscale questions and 15 demographic and other
categorical questions. The data were collected during a one-week period in 2017. O
initial responses, 615 were completed, resulting in a 46 per cent response rate. How
to incomplete responses to survey questions,513 surveys could be utilised for further
analysis. We analysed the data using IBM SPSS 24.0 software.
Segmenting diners into wine involvement segments
The results in Table II were used to split the respondents into segments based on th
involvement with wine using a five-item seven-point Likert scale that combined end
and situationalinvolvement which we adapted from Dholakia (2001).The resulting final
wine involvement measurement construct was used to segment the sample into tw
consumer groups (low and high involvement).
After re-specification, the possible involvement score range was 5 to 35 (minimu
of 1 * 5 and maximum score of7 * 5).Each respondentwas then recoded into “high
involvement” (above the median) and “low involvement” (below the median = 21)
overall involvement score was calculated for the five scale items with involvement
ranging between 5 and 35 with a mean = 21.1 and median = 21.0. This yielded bre
to allow splitting involvement into two different categories, with answers spread th
the whole range:
(1) high involvement: overall score = 22 to 35: 46.6 per cent of respondents; an
(2) low involvement: overall score = 5 to 21: 53.4 per cent of respondents.
IJWBR
31,1
18
Downloaded by University of South Australia At 17:53 11 April 2019 (PT)
⊘ This is a preview!⊘
Do you want full access?
Subscribe today to unlock all pages.
Trusted by 1+ million students worldwide
A small majority of diners (53 per cent), thus, have a low wine involvement level, while the
high involvementsegmentincludes47 per centof diners.This wine involvement
segmentation structure was forthwith used in answering questions to achieve the aims of
the research study and test the hypotheses.
The scale was checked for reliability and internal consistency to ensure that it was free
from random errors that may affect the accuracy of the results.That was done through
Cronbacha measurementof reliability.Table II displays the results and an overalla
Table I.
Socio-demographics,
restaurant category
patronage and
respondent dining
frequency
Variable
Low involvement
(n = 274)
High
involvement
(n = 239) Total (n = 513)
Gender
Males (%) 33.6 68.6 49.9
Females (%) 66.4 31.4 50.1
Age generation cohort
Millennials (21-36 years) (%) 16.4 56.4 35.1
Generation-X (37-52 years) (%) 35.4 33.1 34.3
Baby Boomers (53-71 years) (%) 23.7 6.7 15.8
Silent generation (72-89 years) (%) 23.7 3.8 14.4
Greatest generation (90-100 years) (%) 0.8 – 0.4
Gross annual household income*
Household income (median) US$75,345 US$110,847 US$92,203
Educational status (highest level)
No post-secondary qualification (%) 35.7 8.8 23.3
Undergraduate post-secondary qualification (%)47.5 41.9 44.8
Postgraduate post-secondary qualification (%) 16.8 49.3 31.9
Marital status
Married or co-habiting with partner (%) 65.8 85.4 74.9
Divorced, separated or widowed (%) 23.3 5.0 14.8
Single (%) 10.9 9.6 10.3
Household size
Total number of persons living in household 2.77 persons 3.79 persons 3.25 persons
Adults 21 yearsþ old in household 2.00 persons 2.11 persons 2.05 persons
Adults 21 yearsþ old in household who drink
wine 1.66 persons 1.89 persons 1.77 persons
Restaurant category#
Full-service family restaurant (%) 51.8 46.0 49.1
Casual ethnic foodservice (%) 16.4 10.9 13.8
Fine-dining upscale restaurant (%) 10.6 13.4 11.9
Bar/tavern (%) 8.4 15.1 11.5
Quick-service/limited service restaurant (%) 9.5 6.3 8.0
Cafeteria/grill/buffet (%) 3.3 8.3 5.7
Dining out frequency in last month
Number of times dined out in the last month 3.73 times 4.45 times 4.06 times
Note: *US$;# Categorisation as per National Restaurant Association (2017) and Canziani et al. (2016)
Wine
involvement
interaction
19
Downloaded by University of South Australia At 17:53 11 April 2019 (PT)
Paraphrase This Document
Need a fresh take? Get an instant paraphrase of this document with our AI Paraphraser
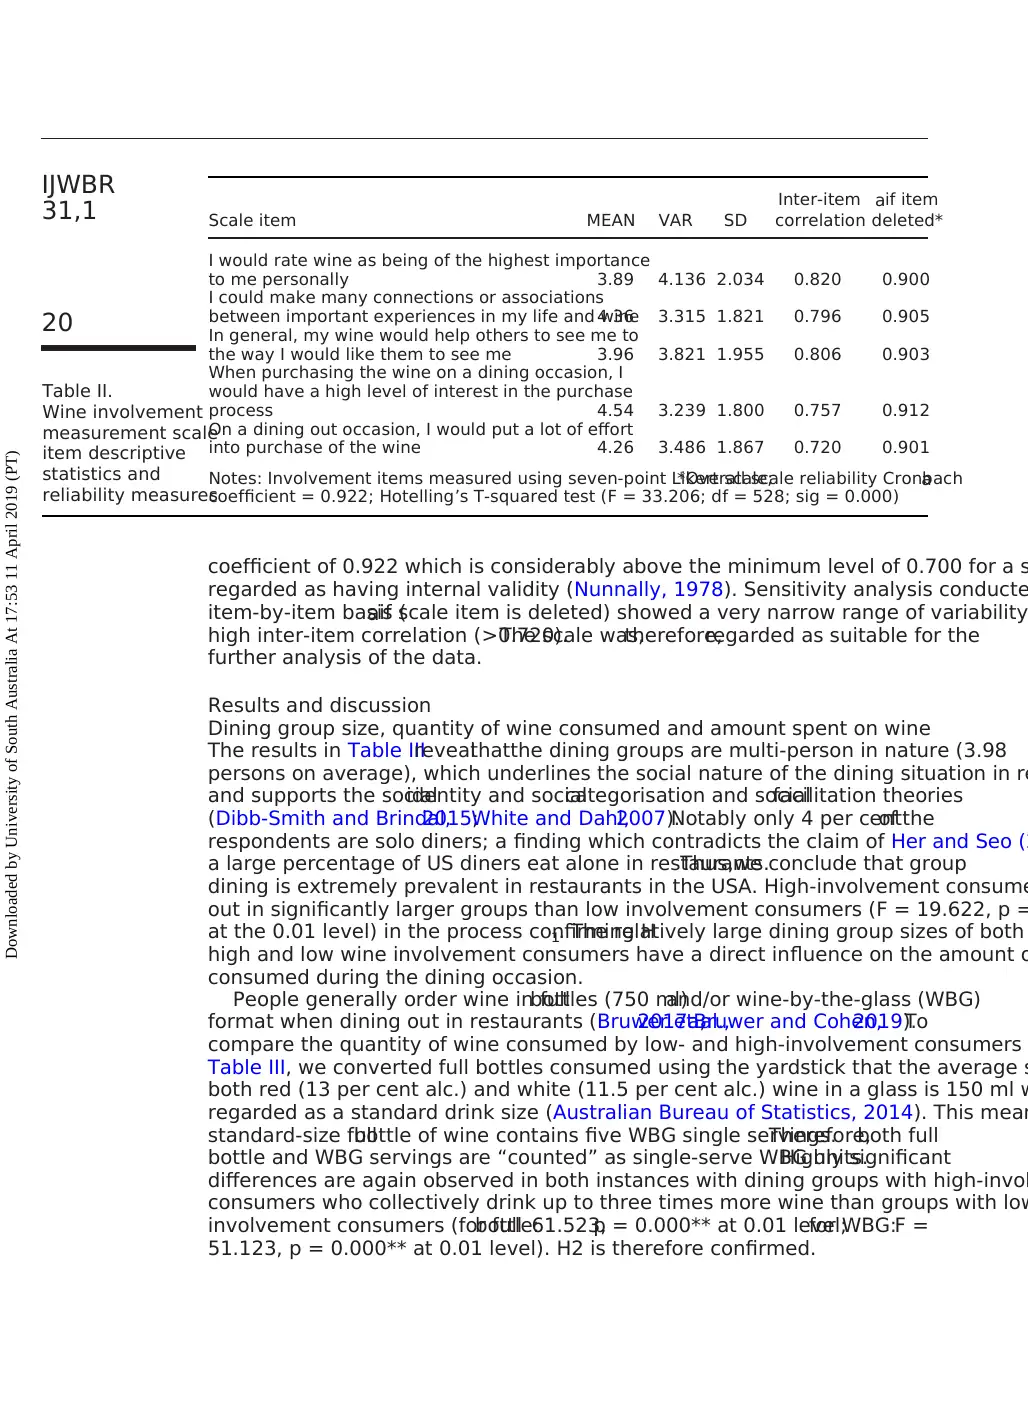
coefficient of 0.922 which is considerably above the minimum level of 0.700 for a s
regarded as having internal validity (Nunnally, 1978). Sensitivity analysis conducte
item-by-item basis (aif scale item is deleted) showed a very narrow range of variability
high inter-item correlation (>0.720).The scale was,therefore,regarded as suitable for the
further analysis of the data.
Results and discussion
Dining group size, quantity of wine consumed and amount spent on wine
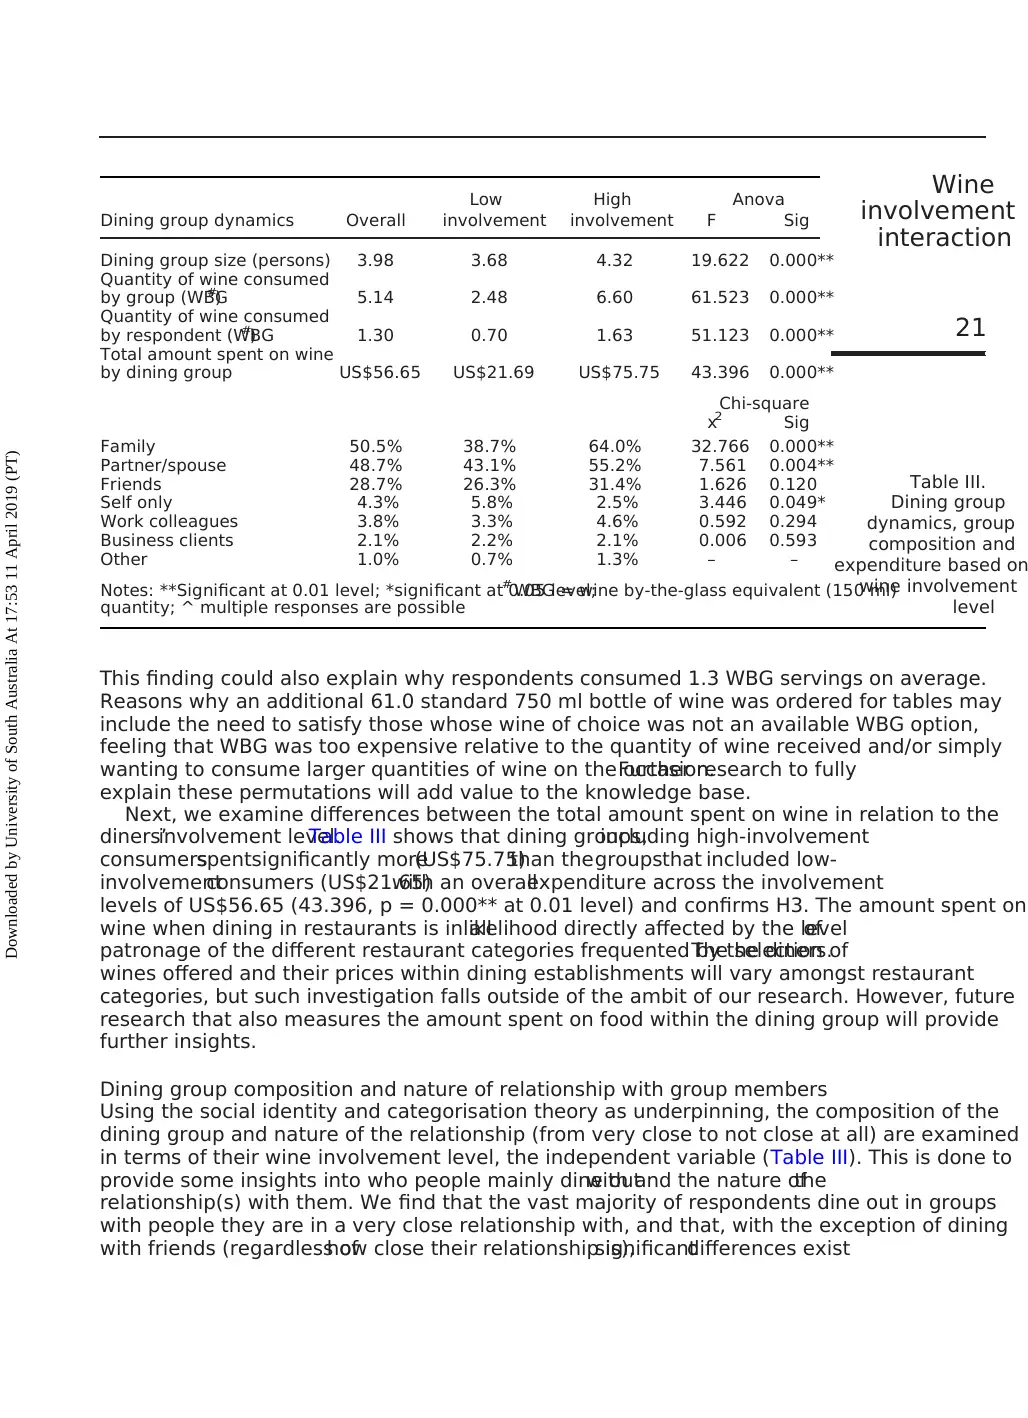
The results in Table IIIrevealthatthe dining groups are multi-person in nature (3.98
persons on average), which underlines the social nature of the dining situation in re
and supports the socialidentity and socialcategorisation and socialfacilitation theories
(Dibb-Smith and Brindal,2015;White and Dahl,2007).Notably only 4 per centof the
respondents are solo diners; a finding which contradicts the claim of Her and Seo (2
a large percentage of US diners eat alone in restaurants.Thus,we conclude that group
dining is extremely prevalent in restaurants in the USA. High-involvement consume
out in significantly larger groups than low involvement consumers (F = 19.622, p =
at the 0.01 level) in the process confirming H1. The relatively large dining group sizes of both
high and low wine involvement consumers have a direct influence on the amount o
consumed during the dining occasion.
People generally order wine in fullbottles (750 ml)and/or wine-by-the-glass (WBG)
format when dining out in restaurants (Bruwer et al.,2017a;Bruwer and Cohen,2019).To
compare the quantity of wine consumed by low- and high-involvement consumers
Table III, we converted full bottles consumed using the yardstick that the average s
both red (13 per cent alc.) and white (11.5 per cent alc.) wine in a glass is 150 ml w
regarded as a standard drink size (Australian Bureau of Statistics, 2014). This mean
standard-size fullbottle of wine contains five WBG single servings.Therefore,both full
bottle and WBG servings are “counted” as single-serve WBG units.Highly significant
differences are again observed in both instances with dining groups with high-invol
consumers who collectively drink up to three times more wine than groups with low
involvement consumers (for fullbottle:61.523,p = 0.000** at 0.01 level;for WBG:F =
51.123, p = 0.000** at 0.01 level). H2 is therefore confirmed.
Table II.
Wine involvement
measurement scale
item descriptive
statistics and
reliability measures
Scale item MEAN VAR SD
Inter-item
correlation
aif item
deleted*
I would rate wine as being of the highest importance
to me personally 3.89 4.136 2.034 0.820 0.900
I could make many connections or associations
between important experiences in my life and wine4.36 3.315 1.821 0.796 0.905
In general, my wine would help others to see me to
the way I would like them to see me 3.96 3.821 1.955 0.806 0.903
When purchasing the wine on a dining occasion, I
would have a high level of interest in the purchase
process 4.54 3.239 1.800 0.757 0.912
On a dining out occasion, I would put a lot of effort
into purchase of the wine 4.26 3.486 1.867 0.720 0.901
Notes: Involvement items measured using seven-point Likert scale;*Overall scale reliability Cronbacha
coefficient = 0.922; Hotelling’s T-squared test (F = 33.206; df = 528; sig = 0.000)
IJWBR
31,1
20
Downloaded by University of South Australia At 17:53 11 April 2019 (PT)
regarded as having internal validity (Nunnally, 1978). Sensitivity analysis conducte
item-by-item basis (aif scale item is deleted) showed a very narrow range of variability
high inter-item correlation (>0.720).The scale was,therefore,regarded as suitable for the
further analysis of the data.
Results and discussion
Dining group size, quantity of wine consumed and amount spent on wine
The results in Table IIIrevealthatthe dining groups are multi-person in nature (3.98
persons on average), which underlines the social nature of the dining situation in re
and supports the socialidentity and socialcategorisation and socialfacilitation theories
(Dibb-Smith and Brindal,2015;White and Dahl,2007).Notably only 4 per centof the
respondents are solo diners; a finding which contradicts the claim of Her and Seo (2
a large percentage of US diners eat alone in restaurants.Thus,we conclude that group
dining is extremely prevalent in restaurants in the USA. High-involvement consume
out in significantly larger groups than low involvement consumers (F = 19.622, p =
at the 0.01 level) in the process confirming H1. The relatively large dining group sizes of both
high and low wine involvement consumers have a direct influence on the amount o
consumed during the dining occasion.
People generally order wine in fullbottles (750 ml)and/or wine-by-the-glass (WBG)
format when dining out in restaurants (Bruwer et al.,2017a;Bruwer and Cohen,2019).To
compare the quantity of wine consumed by low- and high-involvement consumers
Table III, we converted full bottles consumed using the yardstick that the average s
both red (13 per cent alc.) and white (11.5 per cent alc.) wine in a glass is 150 ml w
regarded as a standard drink size (Australian Bureau of Statistics, 2014). This mean
standard-size fullbottle of wine contains five WBG single servings.Therefore,both full
bottle and WBG servings are “counted” as single-serve WBG units.Highly significant
differences are again observed in both instances with dining groups with high-invol
consumers who collectively drink up to three times more wine than groups with low
involvement consumers (for fullbottle:61.523,p = 0.000** at 0.01 level;for WBG:F =
51.123, p = 0.000** at 0.01 level). H2 is therefore confirmed.
Table II.
Wine involvement
measurement scale
item descriptive
statistics and
reliability measures
Scale item MEAN VAR SD
Inter-item
correlation
aif item
deleted*
I would rate wine as being of the highest importance
to me personally 3.89 4.136 2.034 0.820 0.900
I could make many connections or associations
between important experiences in my life and wine4.36 3.315 1.821 0.796 0.905
In general, my wine would help others to see me to
the way I would like them to see me 3.96 3.821 1.955 0.806 0.903
When purchasing the wine on a dining occasion, I
would have a high level of interest in the purchase
process 4.54 3.239 1.800 0.757 0.912
On a dining out occasion, I would put a lot of effort
into purchase of the wine 4.26 3.486 1.867 0.720 0.901
Notes: Involvement items measured using seven-point Likert scale;*Overall scale reliability Cronbacha
coefficient = 0.922; Hotelling’s T-squared test (F = 33.206; df = 528; sig = 0.000)
IJWBR
31,1
20
Downloaded by University of South Australia At 17:53 11 April 2019 (PT)
This finding could also explain why respondents consumed 1.3 WBG servings on average.
Reasons why an additional 61.0 standard 750 ml bottle of wine was ordered for tables may
include the need to satisfy those whose wine of choice was not an available WBG option,
feeling that WBG was too expensive relative to the quantity of wine received and/or simply
wanting to consume larger quantities of wine on the occasion.Further research to fully
explain these permutations will add value to the knowledge base.
Next, we examine differences between the total amount spent on wine in relation to the
diners’involvement level.Table III shows that dining groups,including high-involvement
consumersspentsignificantly more(US$75.75)than thegroupsthat included low-
involvementconsumers (US$21.65)with an overallexpenditure across the involvement
levels of US$56.65 (43.396, p = 0.000** at 0.01 level) and confirms H3. The amount spent on
wine when dining in restaurants is in alllikelihood directly affected by the levelof
patronage of the different restaurant categories frequented by the diners.The selection of
wines offered and their prices within dining establishments will vary amongst restaurant
categories, but such investigation falls outside of the ambit of our research. However, future
research that also measures the amount spent on food within the dining group will provide
further insights.
Dining group composition and nature of relationship with group members
Using the social identity and categorisation theory as underpinning, the composition of the
dining group and nature of the relationship (from very close to not close at all) are examined
in terms of their wine involvement level, the independent variable (Table III). This is done to
provide some insights into who people mainly dine outwith and the nature ofthe
relationship(s) with them. We find that the vast majority of respondents dine out in groups
with people they are in a very close relationship with, and that, with the exception of dining
with friends (regardless ofhow close their relationship is),significantdifferences exist
Table III.
Dining group
dynamics, group
composition and
expenditure based on
wine involvement
level
Low High Anova
Dining group dynamics Overall involvement involvement F Sig
Dining group size (persons) 3.98 3.68 4.32 19.622 0.000**
Quantity of wine consumed
by group (WBG#) 5.14 2.48 6.60 61.523 0.000**
Quantity of wine consumed
by respondent (WBG#) 1.30 0.70 1.63 51.123 0.000**
Total amount spent on wine
by dining group US$56.65 US$21.69 US$75.75 43.396 0.000**
Chi-square
x2 Sig
Family 50.5% 38.7% 64.0% 32.766 0.000**
Partner/spouse 48.7% 43.1% 55.2% 7.561 0.004**
Friends 28.7% 26.3% 31.4% 1.626 0.120
Self only 4.3% 5.8% 2.5% 3.446 0.049*
Work colleagues 3.8% 3.3% 4.6% 0.592 0.294
Business clients 2.1% 2.2% 2.1% 0.006 0.593
Other 1.0% 0.7% 1.3% – –
Notes: **Significant at 0.01 level; *significant at 0.05 level;# WBG = wine by-the-glass equivalent (150 ml)
quantity; ^ multiple responses are possible
Wine
involvement
interaction
21
Downloaded by University of South Australia At 17:53 11 April 2019 (PT)
⊘ This is a preview!⊘
Do you want full access?
Subscribe today to unlock all pages.
Trusted by 1+ million students worldwide
1 out of 19


Your All-in-One AI-Powered Toolkit for Academic Success.
+13062052269
info@desklib.com
Available 24*7 on WhatsApp / Email
![[object Object]](/_next/static/media/star-bottom.7253800d.svg)
Unlock your academic potential
Copyright © 2020–2026 A2Z Services. All Rights Reserved. Developed and managed by ZUCOL.