Comprehensive Financial Spreadsheet for Retail Business Operations

Verified

Added on  2023/01/16

|15
|1302
|67
Practical Assignment
AI Summary
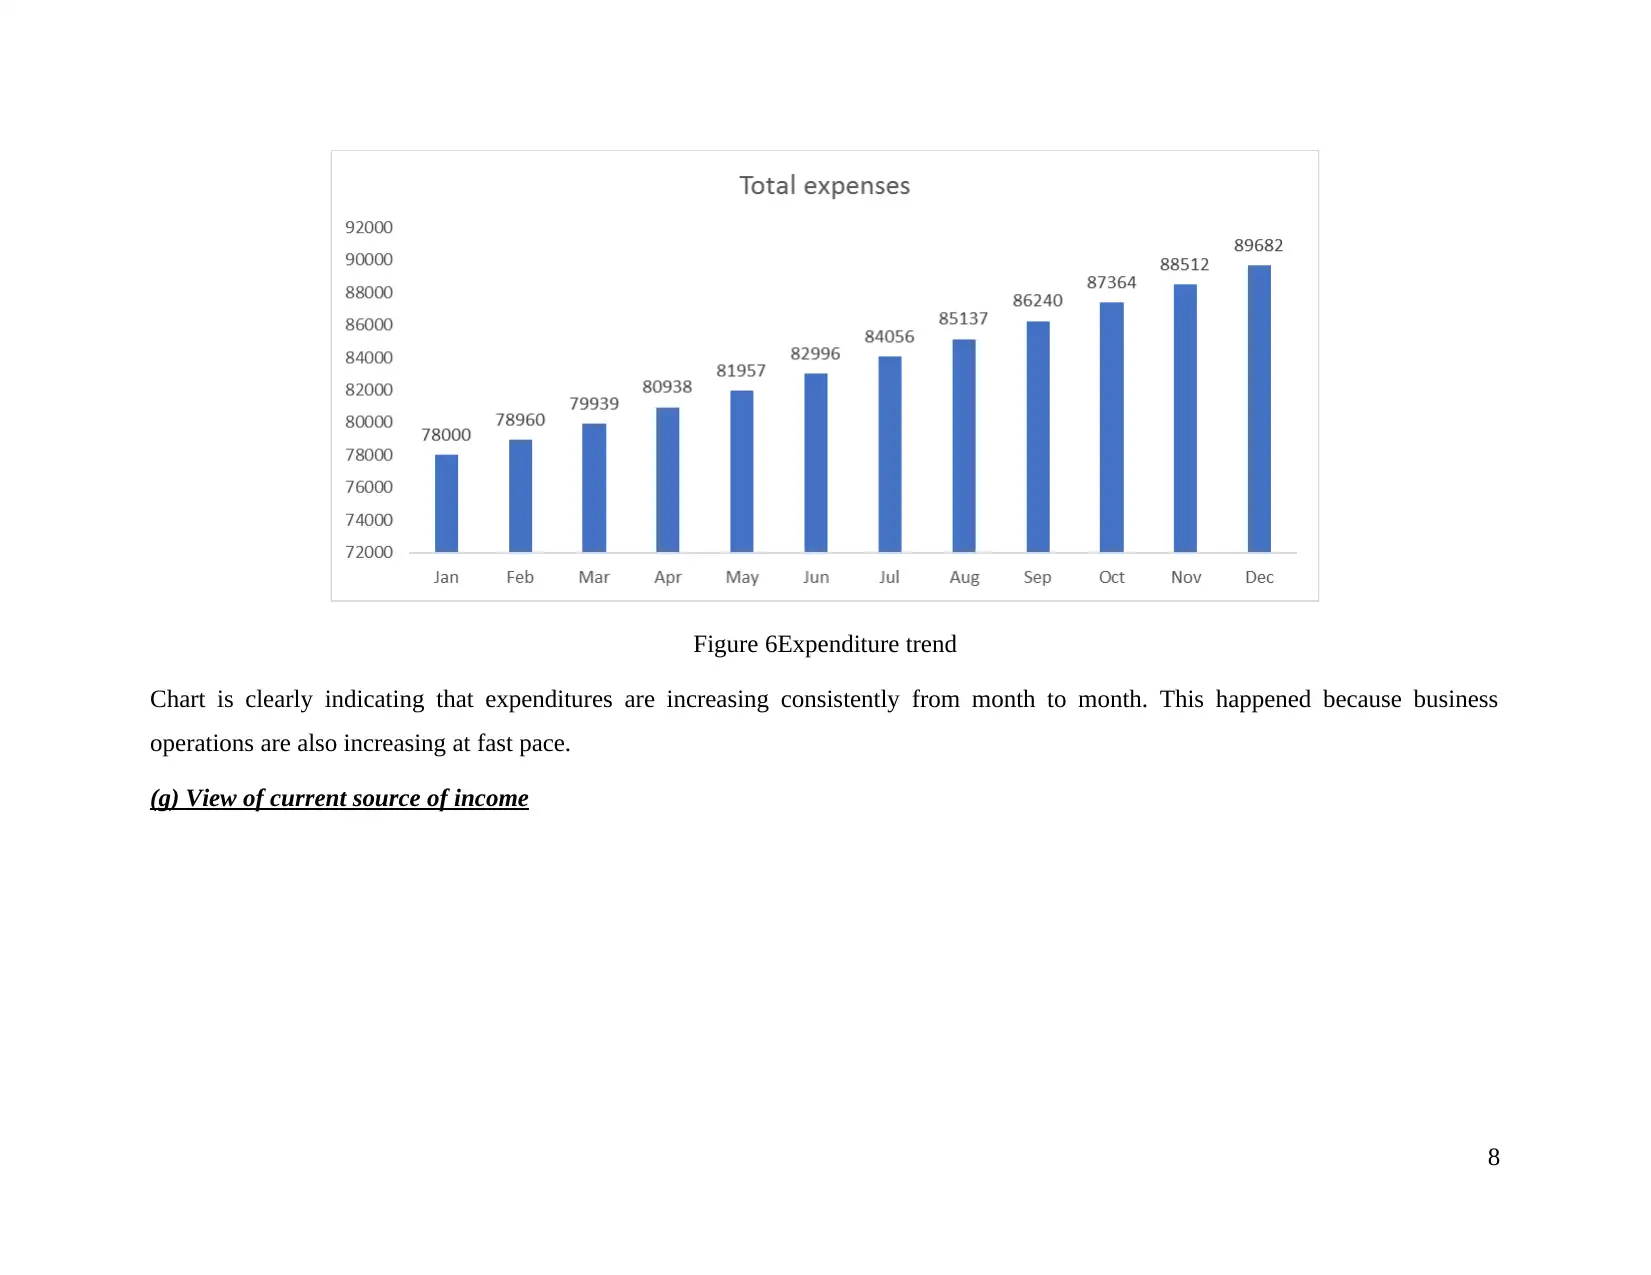
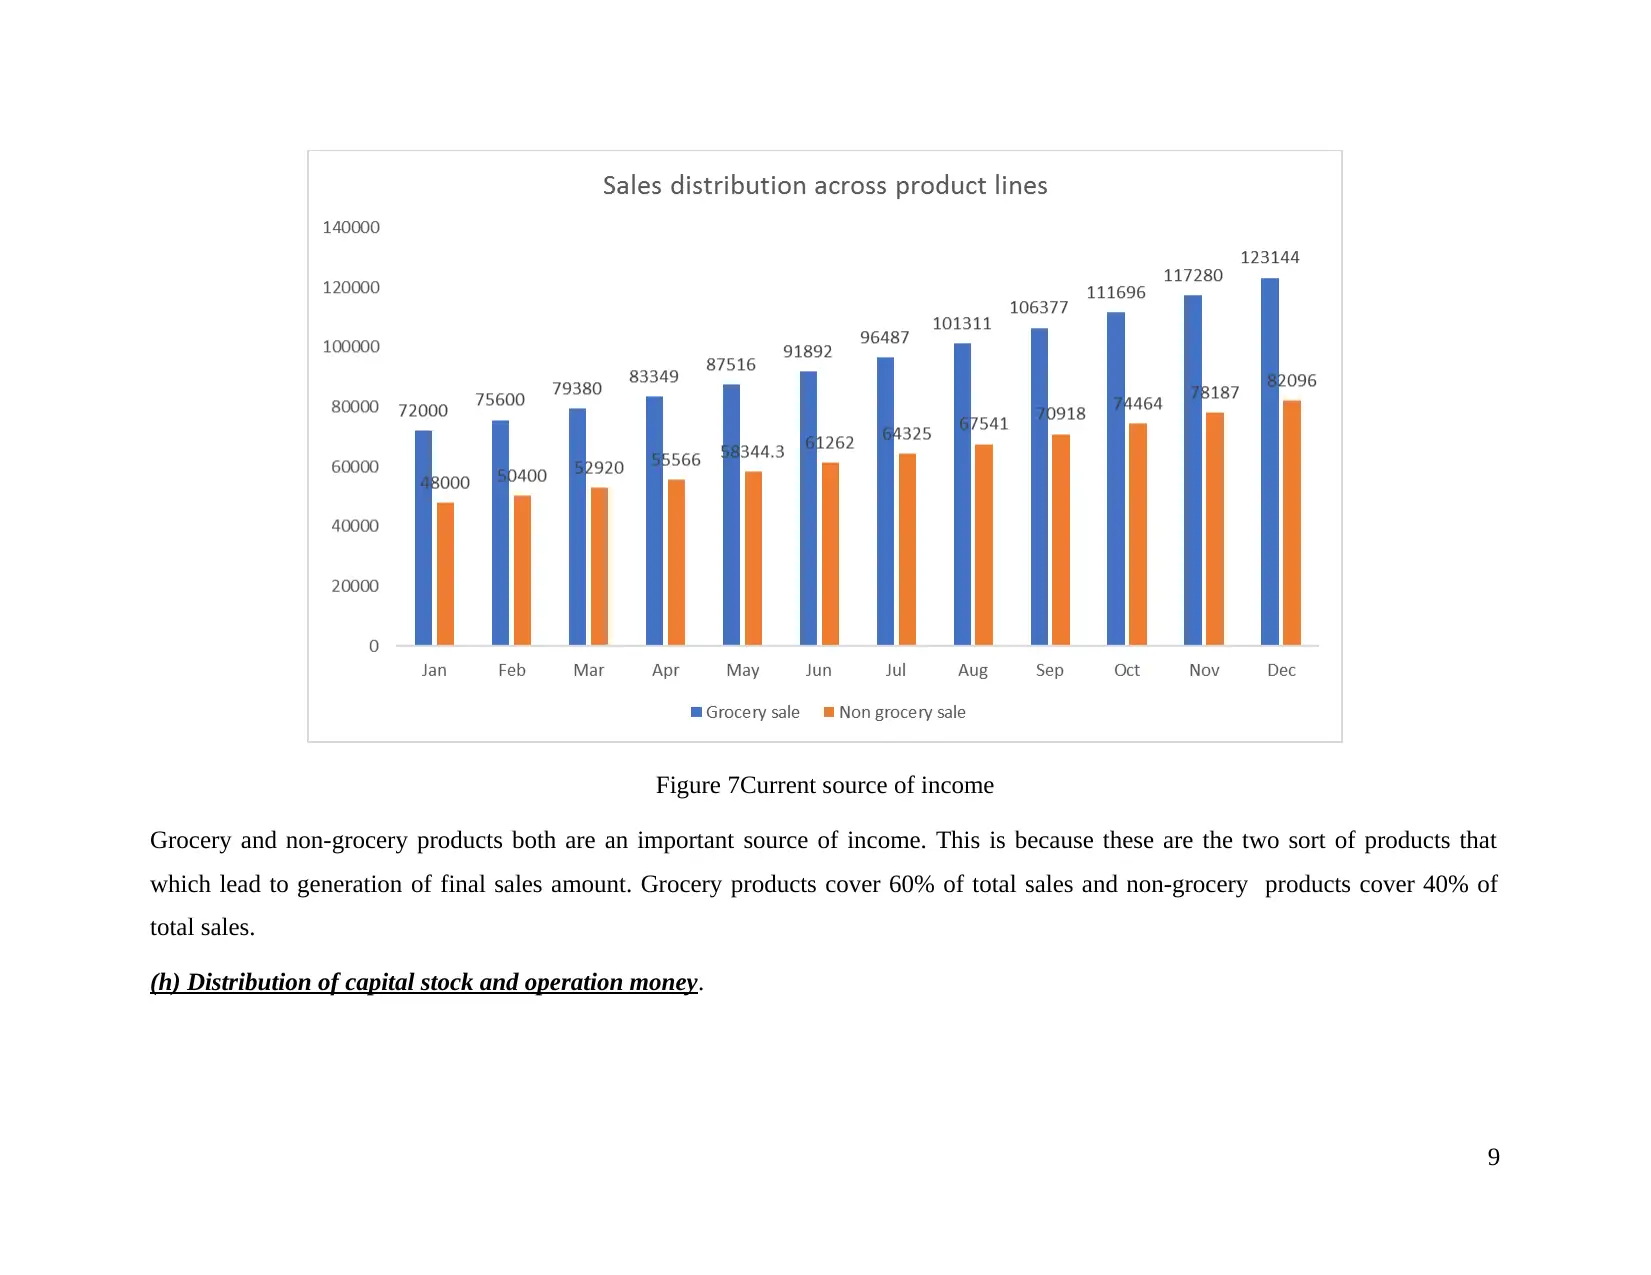
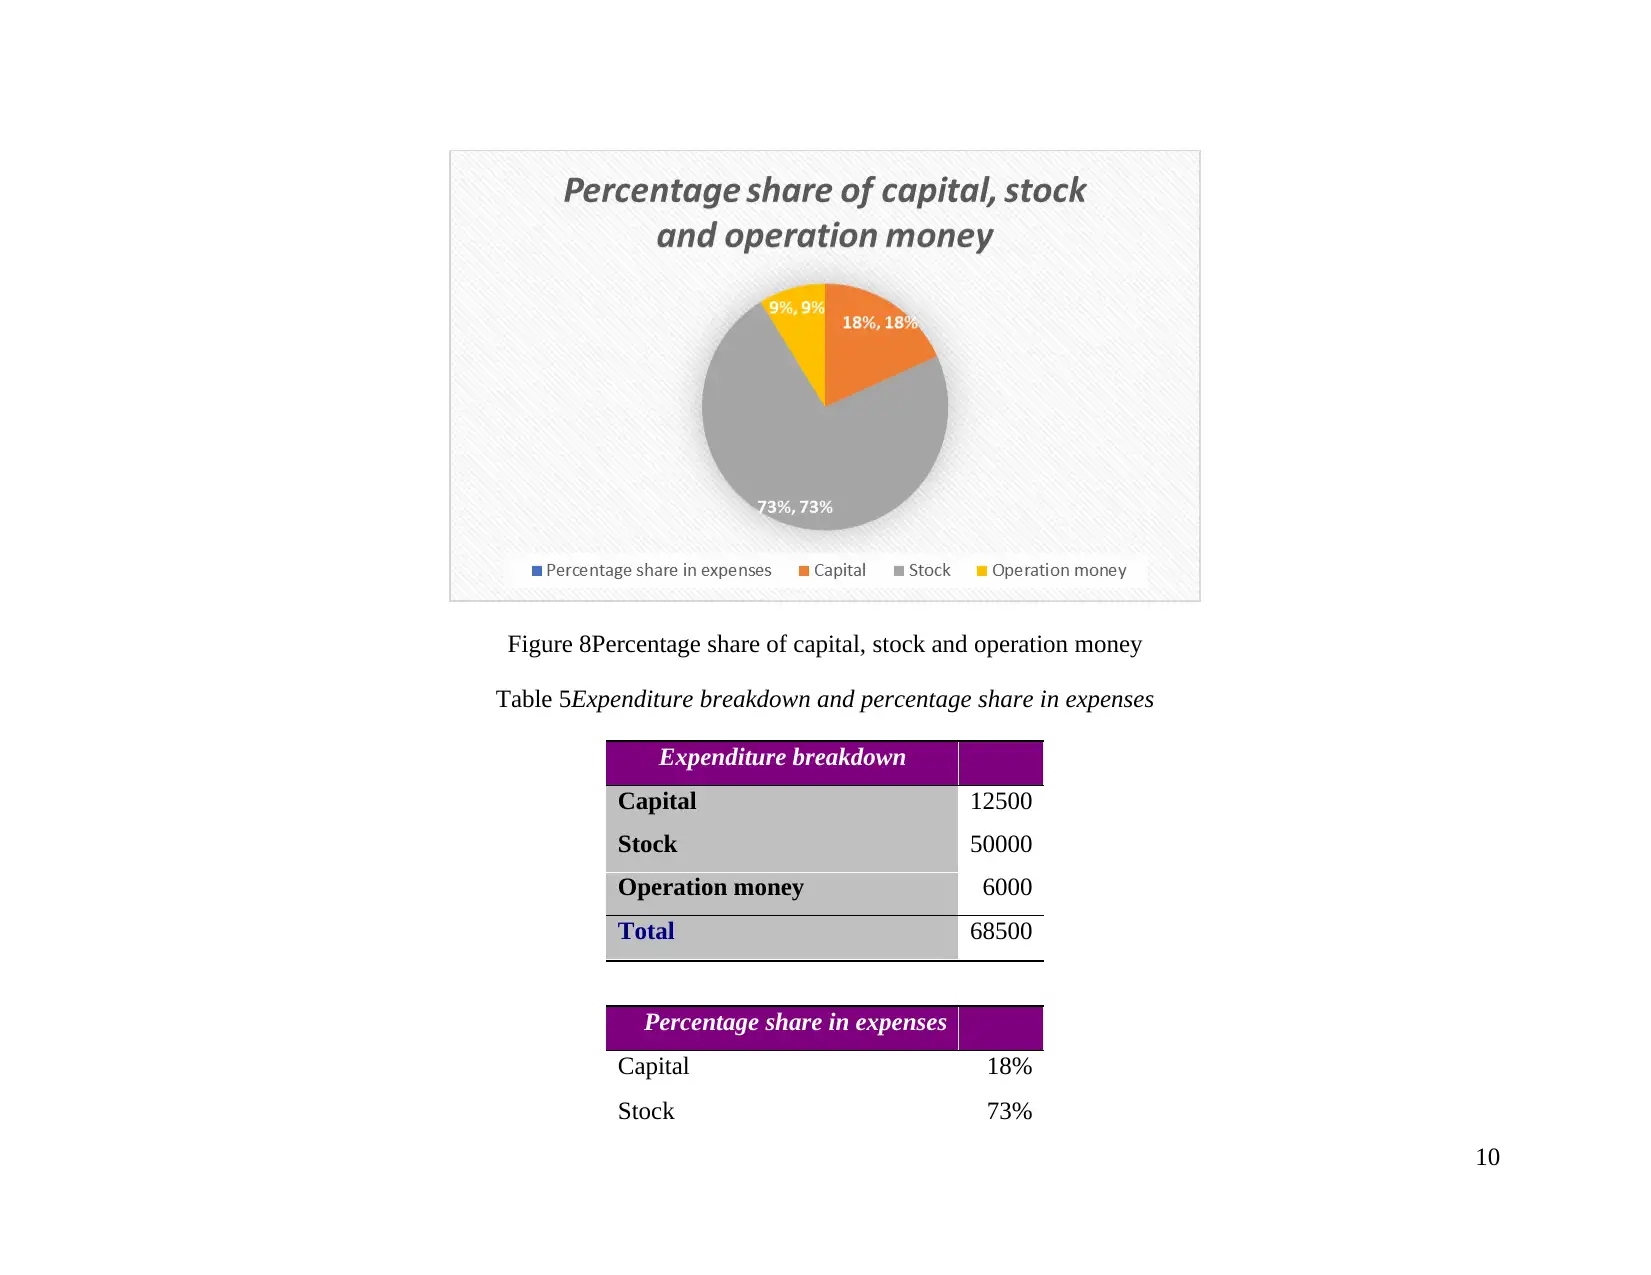
This assignment provides a detailed financial analysis of a retail business using a comprehensive spreadsheet. The document begins with a description of the retail business, 'Big Deal,' located in the UK, detailing its product offerings (grocery and non-grocery items), financing structure, and marketing strategies. The core of the assignment involves the development and analysis of a spreadsheet, including the application of formulas like auto-sum and average, and the use of absolute references for percentage calculations. The spreadsheet presents tables for average expenses, sales classification, cash flows, and expense percentages. Charts are used to visualize expenditure trends and income sources. Task 2 focuses on the design of the spreadsheet, explaining how expenses and sales revenue are estimated, profit is computed, and how the P&L statement is used to assist a bank manager. The document also describes the formulas and charts utilized to present financial data effectively, including the use of SUM, column, and pie charts to reveal trends and illustrate the distribution of financial components. The analysis includes a breakdown of capital, stock, and operation money, demonstrating the financial structure of the retail business.
tabler-icon-diamond-filled.svg

Contribute Materials

Your contribution can guide someone’s learning journey. Share your documents today.
Document Page
ACCOUNTING
tabler-icon-diamond-filled.svg

Secure Best Marks with AI Grader

Need help grading? Try our AI Grader for instant feedback on your assignments.
Document Page
TABLE OF CONTENTS
TASK 1............................................................................................................................................1
(a) Brief description of retail business........................................................................................1
(b) Development of spreadsheet..................................................................................................1
TASK 2........................................................................................................................................................11
Table 1Average expenses................................................................................................................4
Table 2Sales classification in retail business...................................................................................5
Table 3Cash flows...........................................................................................................................6
Table 4Expenses as percentage of expenditure...............................................................................7
Table 5Expenditure breakdown and percentage share in expenses...............................................10
Figure 1Auto sum formula application............................................................................................1
Figure 2Auto format........................................................................................................................2
Figure 3Auto format dialog box......................................................................................................3
Figure 4Average formula.................................................................................................................4
Figure 5Percentage using absolute reference..................................................................................5
Figure 6Expenditure trend...............................................................................................................8
Figure 7Current source of income...................................................................................................9
Figure 8Percentage share of capital, stock and operation money..................................................10
Document Page
TASK 1
(a) Brief description of retail business
Big deal is the one of the retail stores in the West London in the UK. Store offer wide variety of products that can be classified
in to grocery and non-grocery items. There are number of competitors in the market and due to this reason, it is very important to do
something special and different in the business. For financing business operations £10000 is collected from the family and friends.
Apart from this, amount valued at £2500 is needed extra to finance business operations. £50000 is also needed to purchase goods.
Thus, it can be said that requirement amount is high and due to this reason, it become important to resort to the banks to get finance
for business operations. Main focus of the retail store is on marketing of its product and in this regard heavy expenditure is made on
the marketing of the product lines. Marketing alone cover 20% to 25% of overall sales revenue. Thus, it can be said that heavy
investment is made in the business and efforts are also made to capitalize opportunity.
(b) Development of spreadsheet
(a)Auto sum formula
Figure 1Auto sum formula application
1
Document Page
(b) Auto format
Figure 2Auto format
On upper left side icon is given by clicking on which below given dialog box open.
2
tabler-icon-diamond-filled.svg

Secure Best Marks with AI Grader

Need help grading? Try our AI Grader for instant feedback on your assignments.
Document Page
Figure 3Auto format dialog box
3
Document Page
© Average formula
Figure 4Average formula
Table 1Average expenses
Average expenses
4
Document Page
Marketing expenses 26824
Administrative expenses 8047
Electricity expenses 5365
HR expenses 30000
Transportation expenses 13412
Miscellaneous expenses 6706
(d) Percentage using absolute reference
Figure 5Percentage using absolute reference
Table 2Sales classification in retail business
Sales classification Jan Feb Mar Apr May Jun Jul Aug Sep Oct Nov Dec
Grocery sale 7200 7560 7938 8334 87516 9189 9648 10131 10637 11169 11728 12314
5
tabler-icon-diamond-filled.svg

Paraphrase This Document

Need a fresh take? Get an instant paraphrase of this document with our AI Paraphraser
Document Page
0 0 0 9 2 7 1 7 6 0 4
Non-grocery sale
4800
0
5040
0
5292
0
5556
6
58344.
3
6126
2
6432
5 67541 70918 74464 78187 82096
Table 3Cash flows
Cash flow Jan Feb Mar Apr May Jun Jul Aug Sep Oct Nov Dec
Sales 120000 126000 132300 138915 145861 153154 160811 168852 177295 186159 195467 205241
Less: COGS 36000 37800 39690 41675 43758 45946 48243 50656 53188 55848 58640 61572
Gross profit 84000 88200 92610 97241 102103 107208 112568 118196 124106 130312 136827 143669
Expenses
Marketing expenses 24000 24480 24970 25469 25978 26498 27028 27568 28120 28682 29256 29841
Administrative expenses 7200 7344 7491 7641 7794 7949 8108 8271 8436 8605 8777 8952
Electricity expenses 4800 4896 4994 5094 5196 5300 5406 5514 5624 5736 5851 5968
HR expenses 30000 30000 30000 30000 30000 30000 30000 30000 30000 30000 30000 30000
Transportation expenses 12000 12240 12485 12734 12989 13249 13514 13784 14060 14341 14628 14920
Miscellaneous expenses 6000 6120 6242 6367 6495 6624 6757 6892 7030 7171 7314 7460
Total expenses 78000 78960 79939 80938 81957 82996 84056 85137 86240 87364 88512 89682
Net profit 6000 9240 12671 16303 20146 24212 28512 33060 37867 42947 48315 53987
6
Document Page
Table 4Expenses as percentage of expenditure
Expenses as percentage of
expenditure
Marketing expenses 20% 20% 21% 21% 22% 22% 23% 23% 23% 24% 24% 25%
Administrative expenses 6% 6% 6% 6% 6% 7% 7% 7% 7% 7% 7% 7%
Electricity expenses 4% 4% 4% 4% 4% 4% 5% 5% 5% 5% 5% 5%
HR expenses 25% 24% 23% 22% 21% 20% 19% 18% 17% 16% 15% 15%
Transportation expenses 10% 10% 10% 11% 11% 11% 11% 11% 12% 12% 12% 12%
Miscellaneous expenses 5% 5% 5% 5% 5% 6% 6% 6% 6% 6% 6% 6%
(e ) Password protection
Sheet is not password protected. In order to protect sheet user, have to go to review tab and then click on protect sheet or
workbook. After placing password on the sheet Excel can be protected.
(f) Chart on clear representation of expenses
7
Document Page
Figure 6Expenditure trend
Chart is clearly indicating that expenditures are increasing consistently from month to month. This happened because business
operations are also increasing at fast pace.
(g) View of current source of income
8
tabler-icon-diamond-filled.svg

Secure Best Marks with AI Grader

Need help grading? Try our AI Grader for instant feedback on your assignments.
Document Page
Figure 7Current source of income
Grocery and non-grocery products both are an important source of income. This is because these are the two sort of products that
which lead to generation of final sales amount. Grocery products cover 60% of total sales and non-grocery products cover 40% of
total sales.
(h) Distribution of capital stock and operation money.
9
Document Page
Figure 8Percentage share of capital, stock and operation money
Table 5Expenditure breakdown and percentage share in expenses
Expenditure breakdown
Capital 12500
Stock 50000
Operation money 6000
Total 68500
Percentage share in expenses
Capital 18%
Stock 73%
10
Document Page
Operation money 9%
It can be seen from the above table that share of capital is 18% and same of stock is 73% followed by operation money whose share is
9% respectively. Thus, it can have said that stock will cover large portion of the entire investment amount.
TASK 2
In order to design spreadsheet first of all business model and product lines are taken in to account. Simply, expenses that are made
in the business are estimated along with sales revenue. From sales revenue expenses are subtracted and, in this way, profit is
computed. In order to assist bank manager in identifying firm efficiency percentage table is prepared below P&L statement to reflect
share that each sort of expenditure have on total sales amount. In order to give brief overview of the overall expenses made each
month in each category AVERAGE formula is applied in Excel. This is because by using information about amount that mostly
incurred in each expenditure head in every month can be communicated to officer in better way. In order to show expenditure
breakdown percentage share of capital, stock and operating expense is compute in overall expenditure amount. It was necessary to use
SUM formula in sheet to compute overall expenditure made each month. Column chart is used in two graphs because by using it short
term trends can be revealed in better way. On other hand, pie chart is used because it in better way indicate share of varied variables in
total value.
11
tabler-icon-diamond-filled.svg

Paraphrase This Document

Need a fresh take? Get an instant paraphrase of this document with our AI Paraphraser
Document Page
12
Document Page
13
chevron_up_icon
1 out of 15
circle_padding
hide_on_mobile
zoom_out_icon
logo.png

Your All-in-One AI-Powered Toolkit for Academic Success.

Available 24*7 on WhatsApp / Email

[object Object]