Data Mining Project: Online Retail Store Data Analysis using Weka

Verified

Added on  2023/05/30

|8
|348
|58
Project
AI Summary
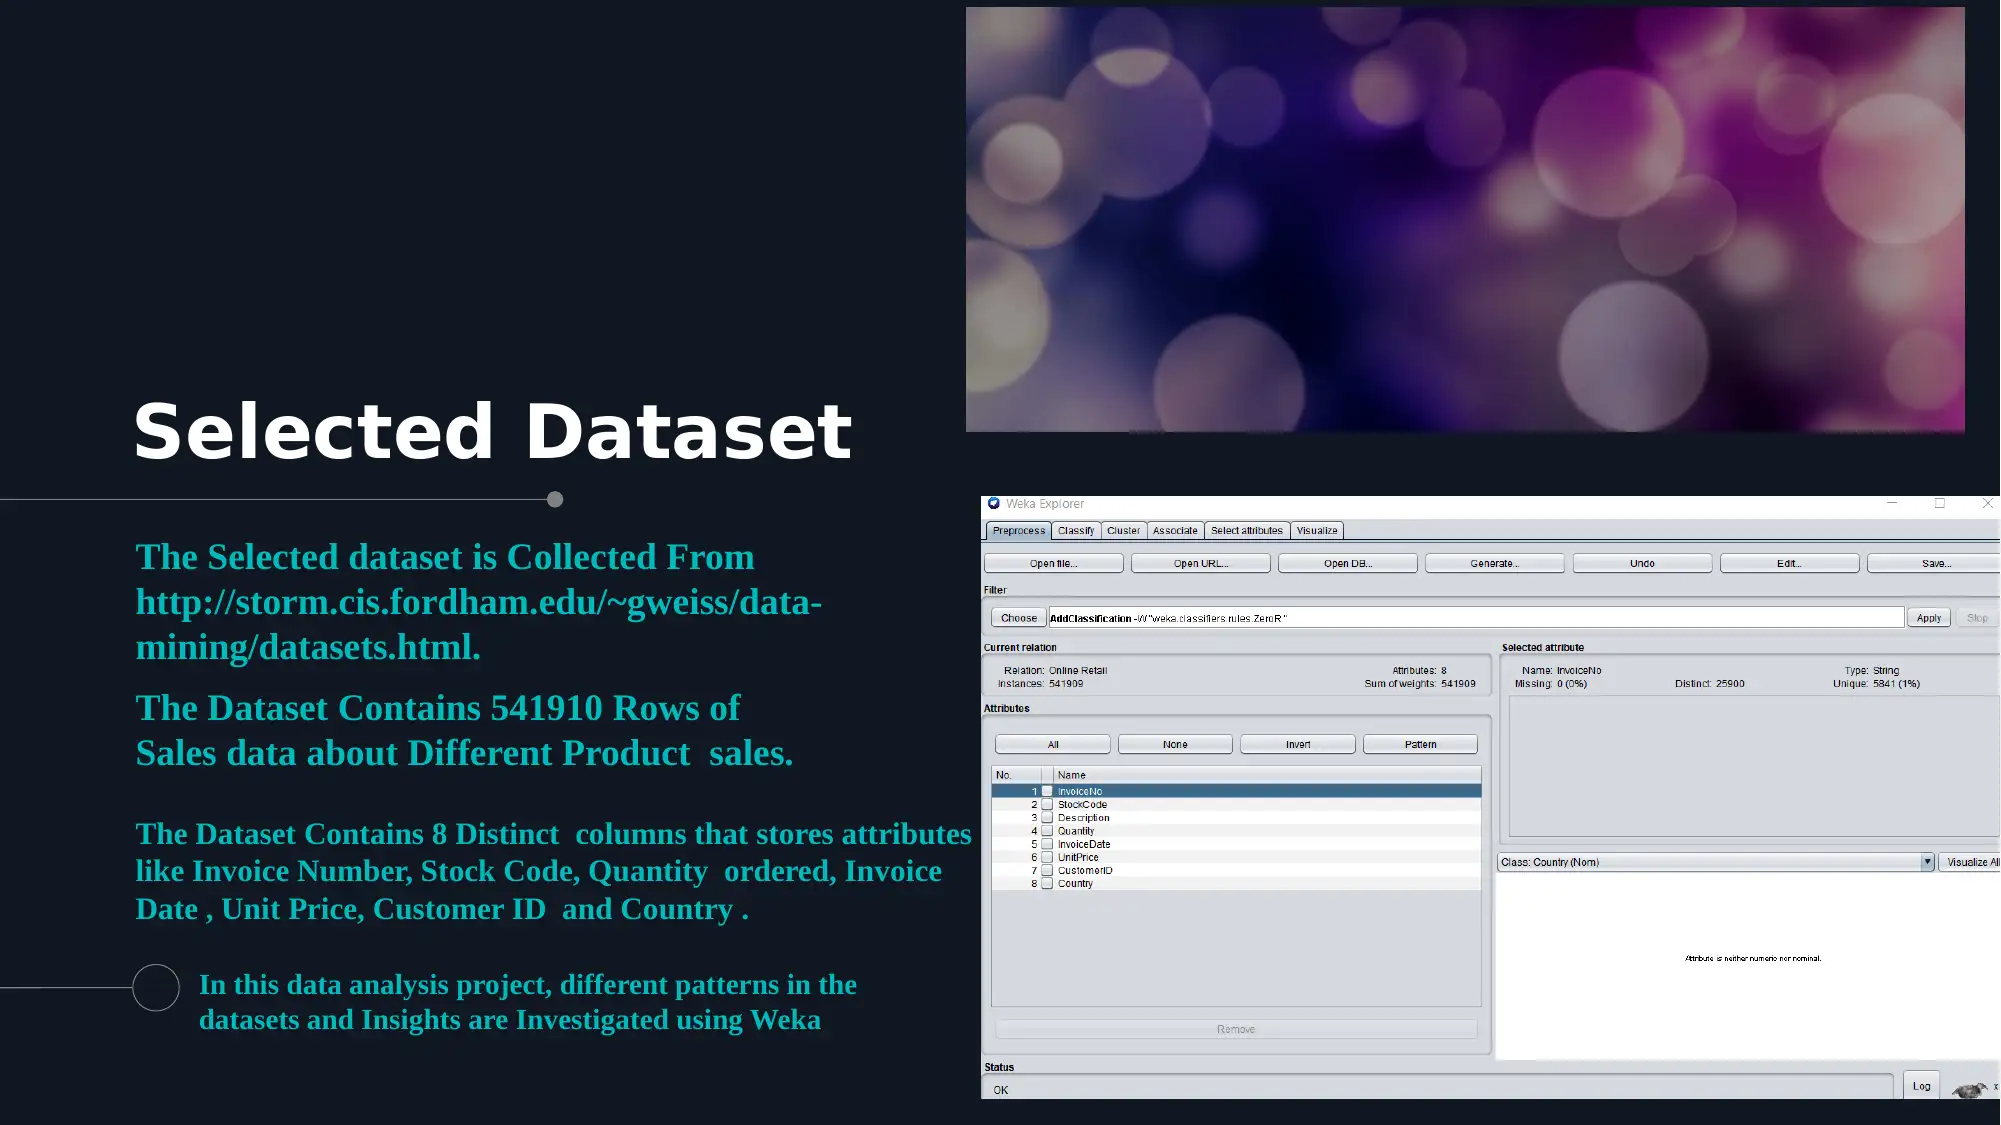
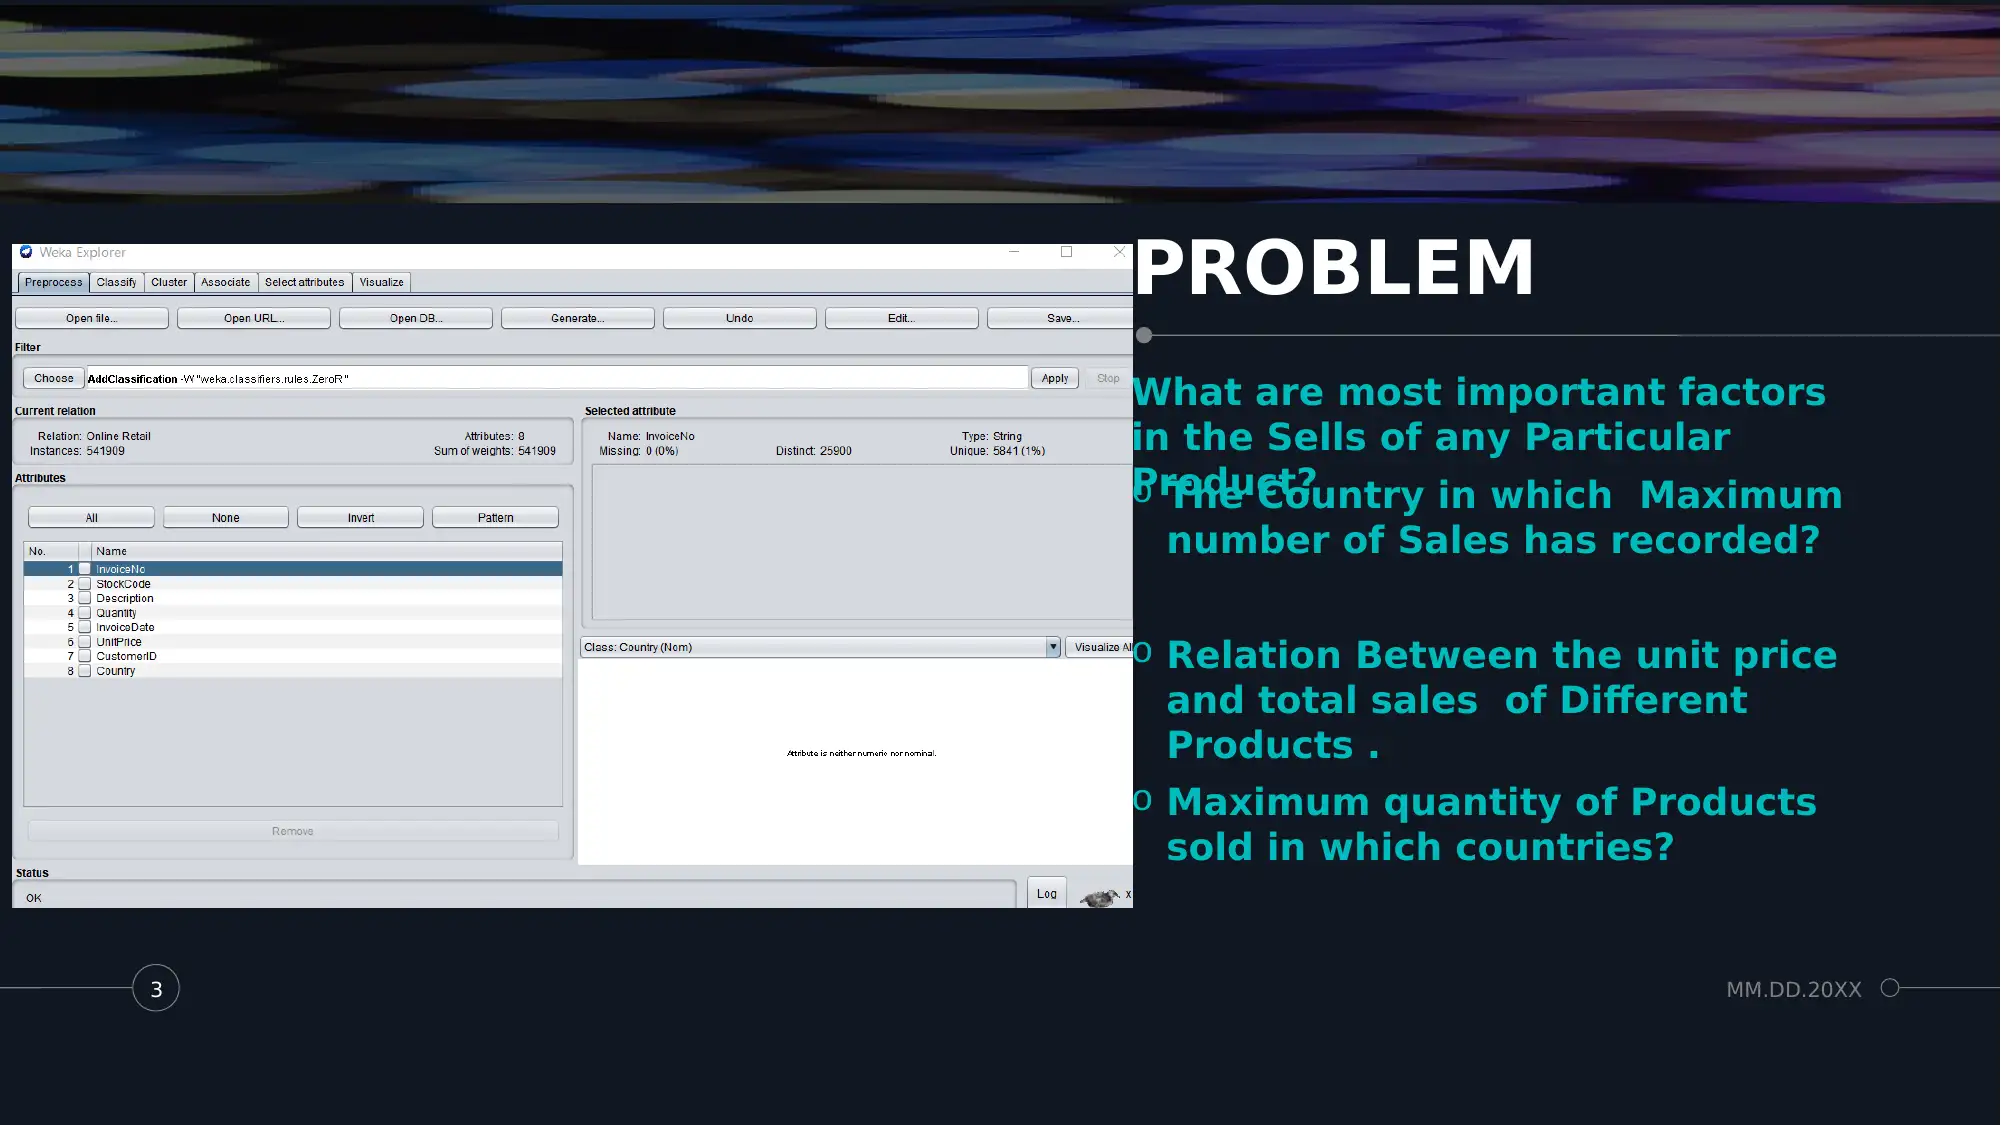
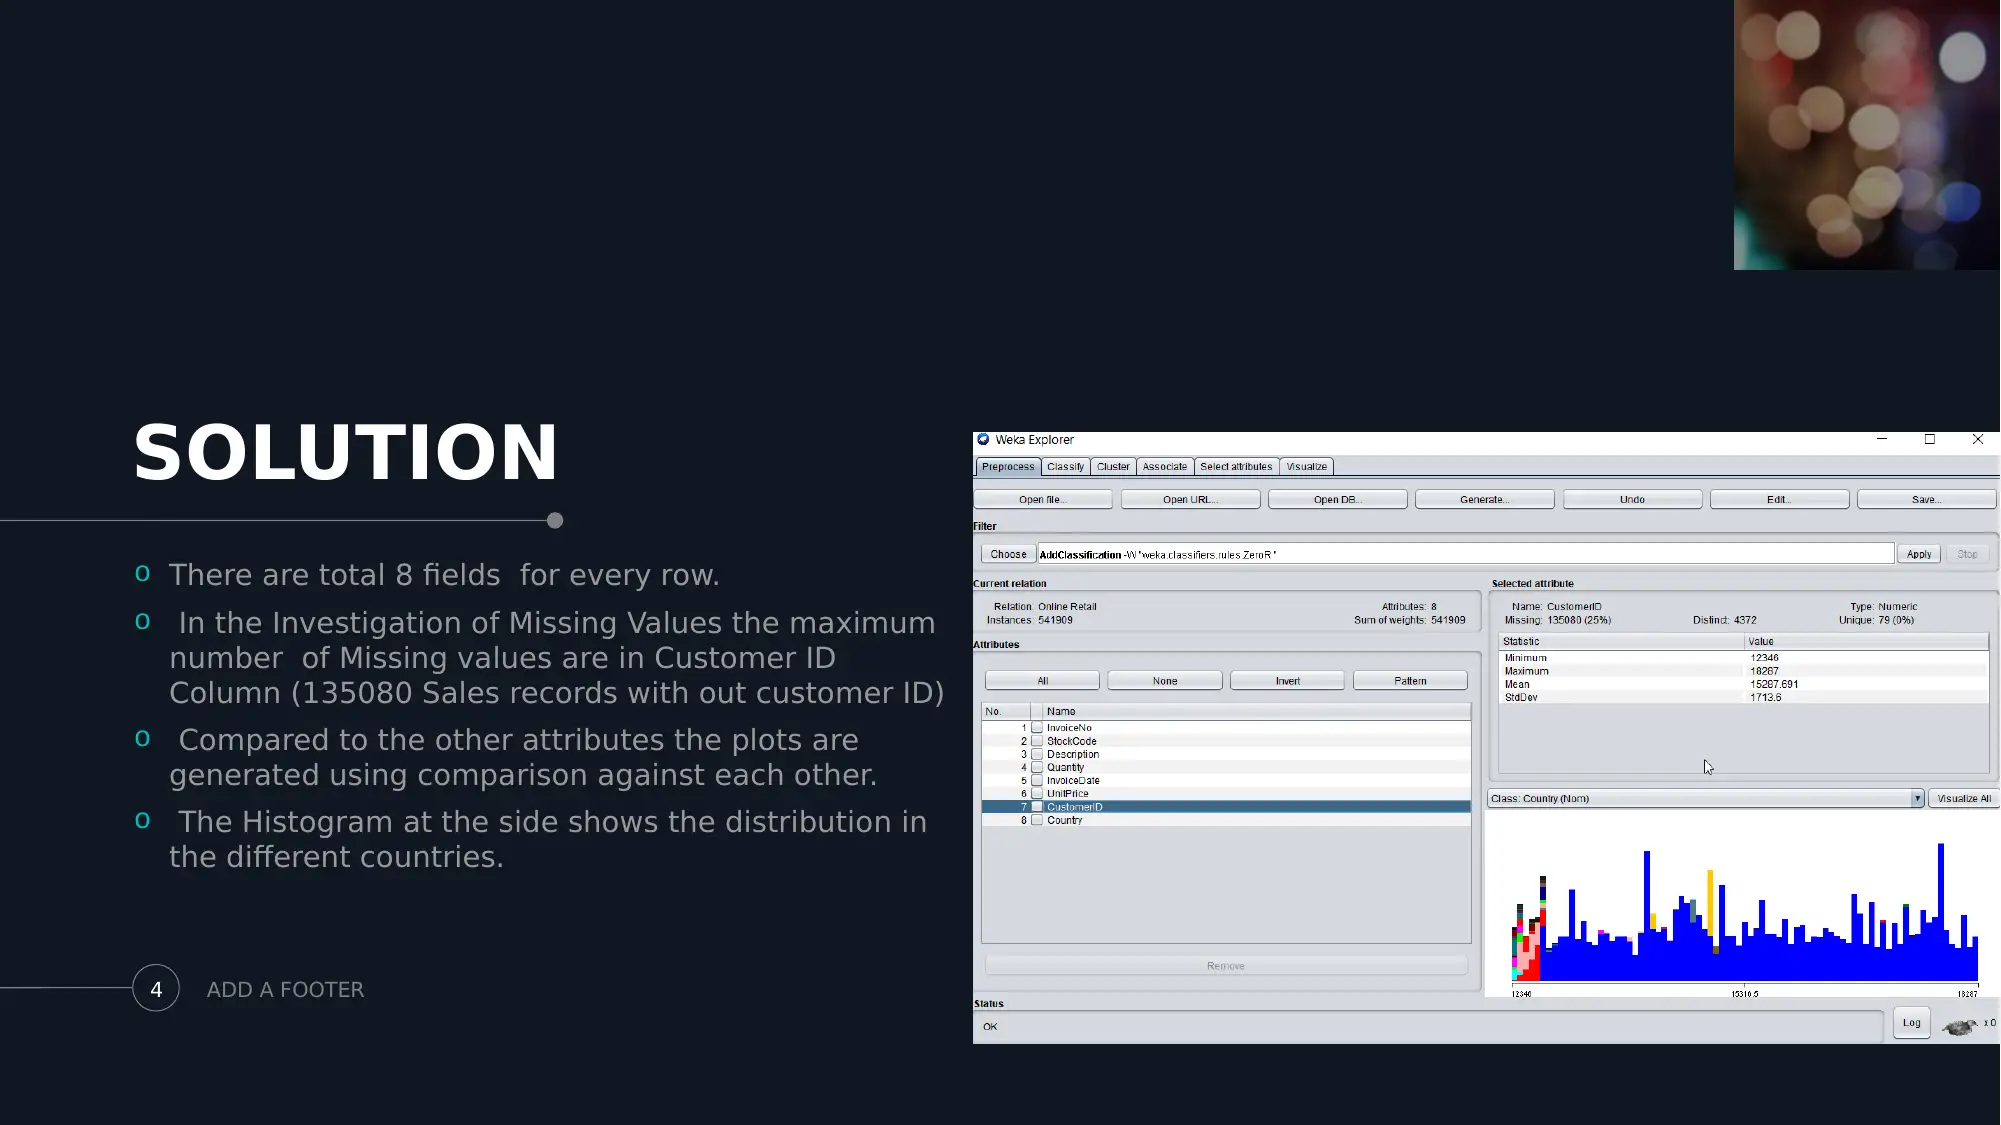
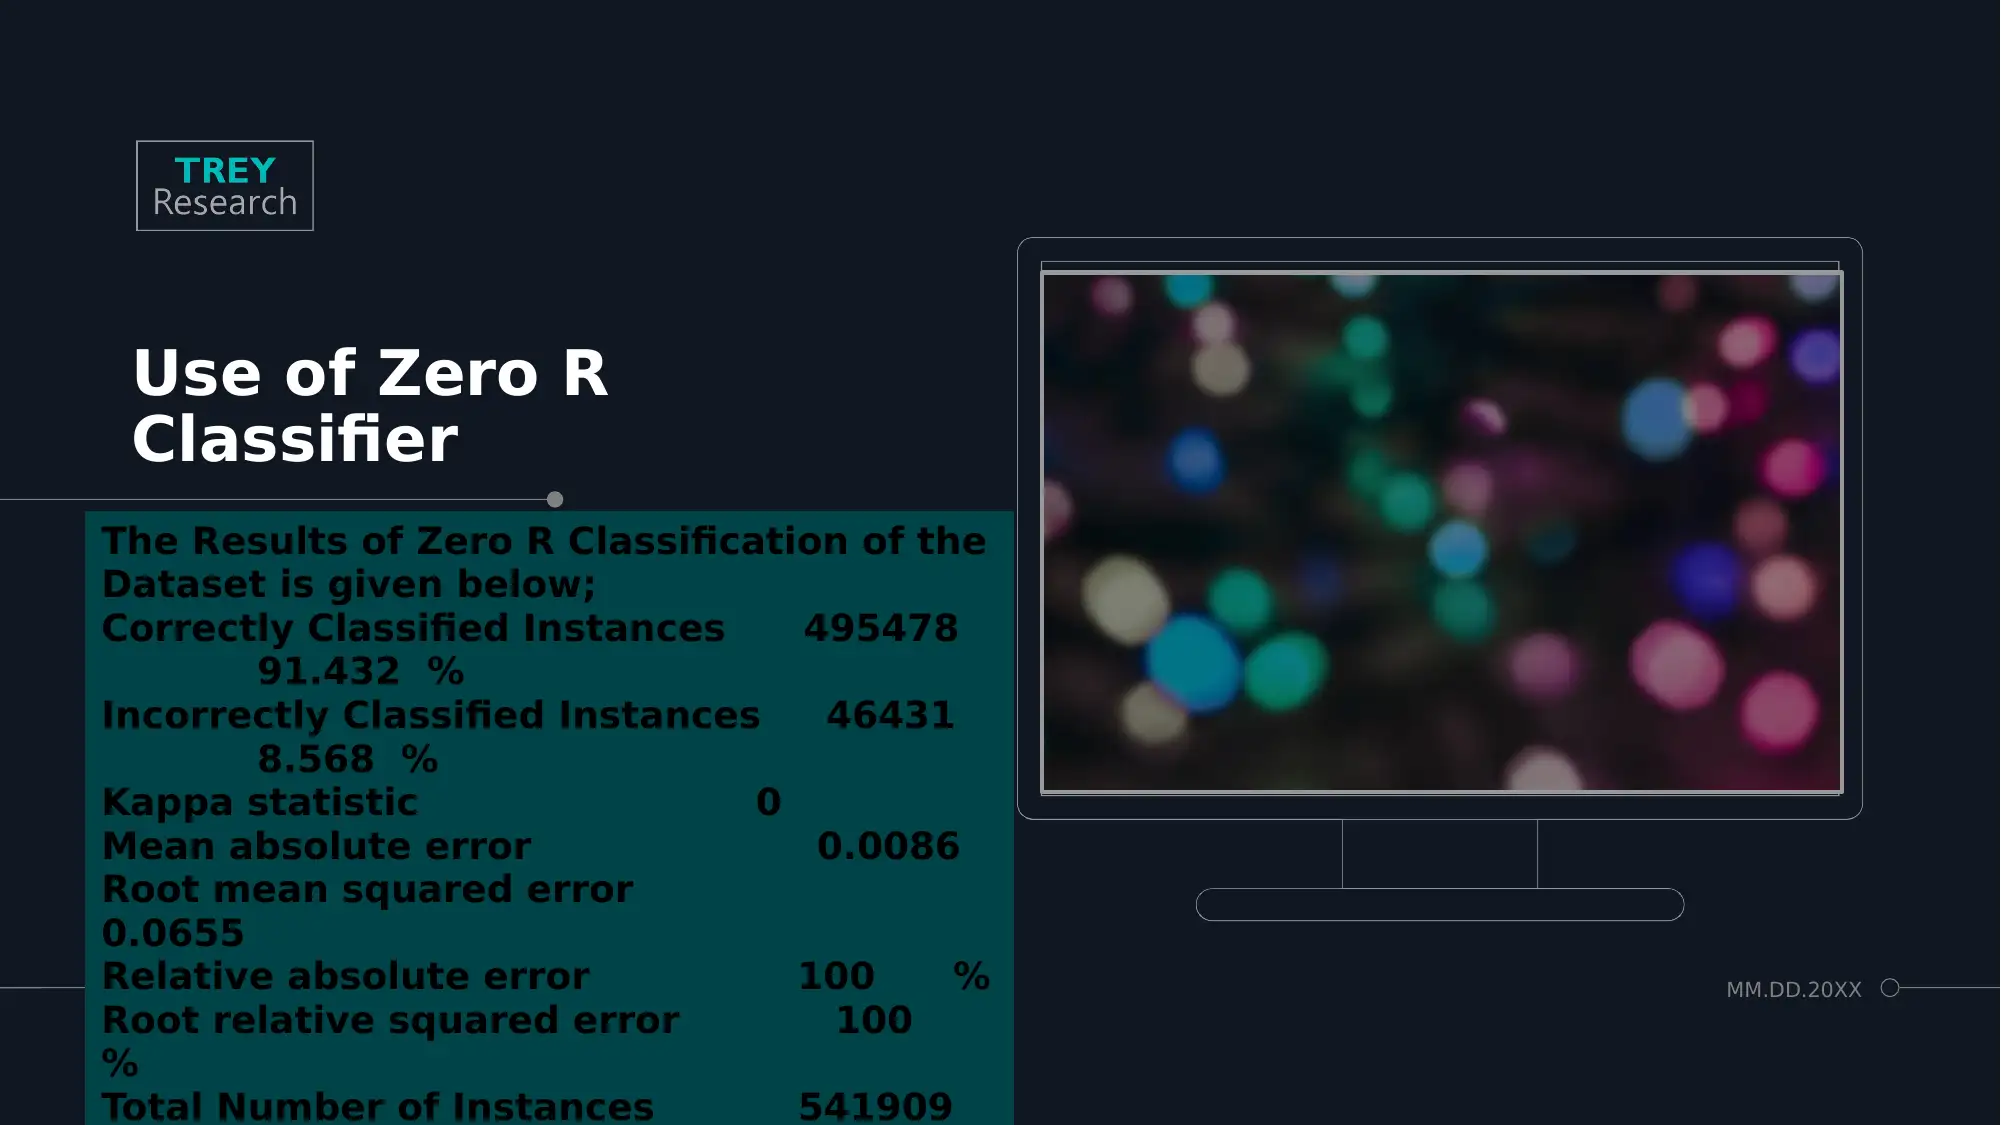
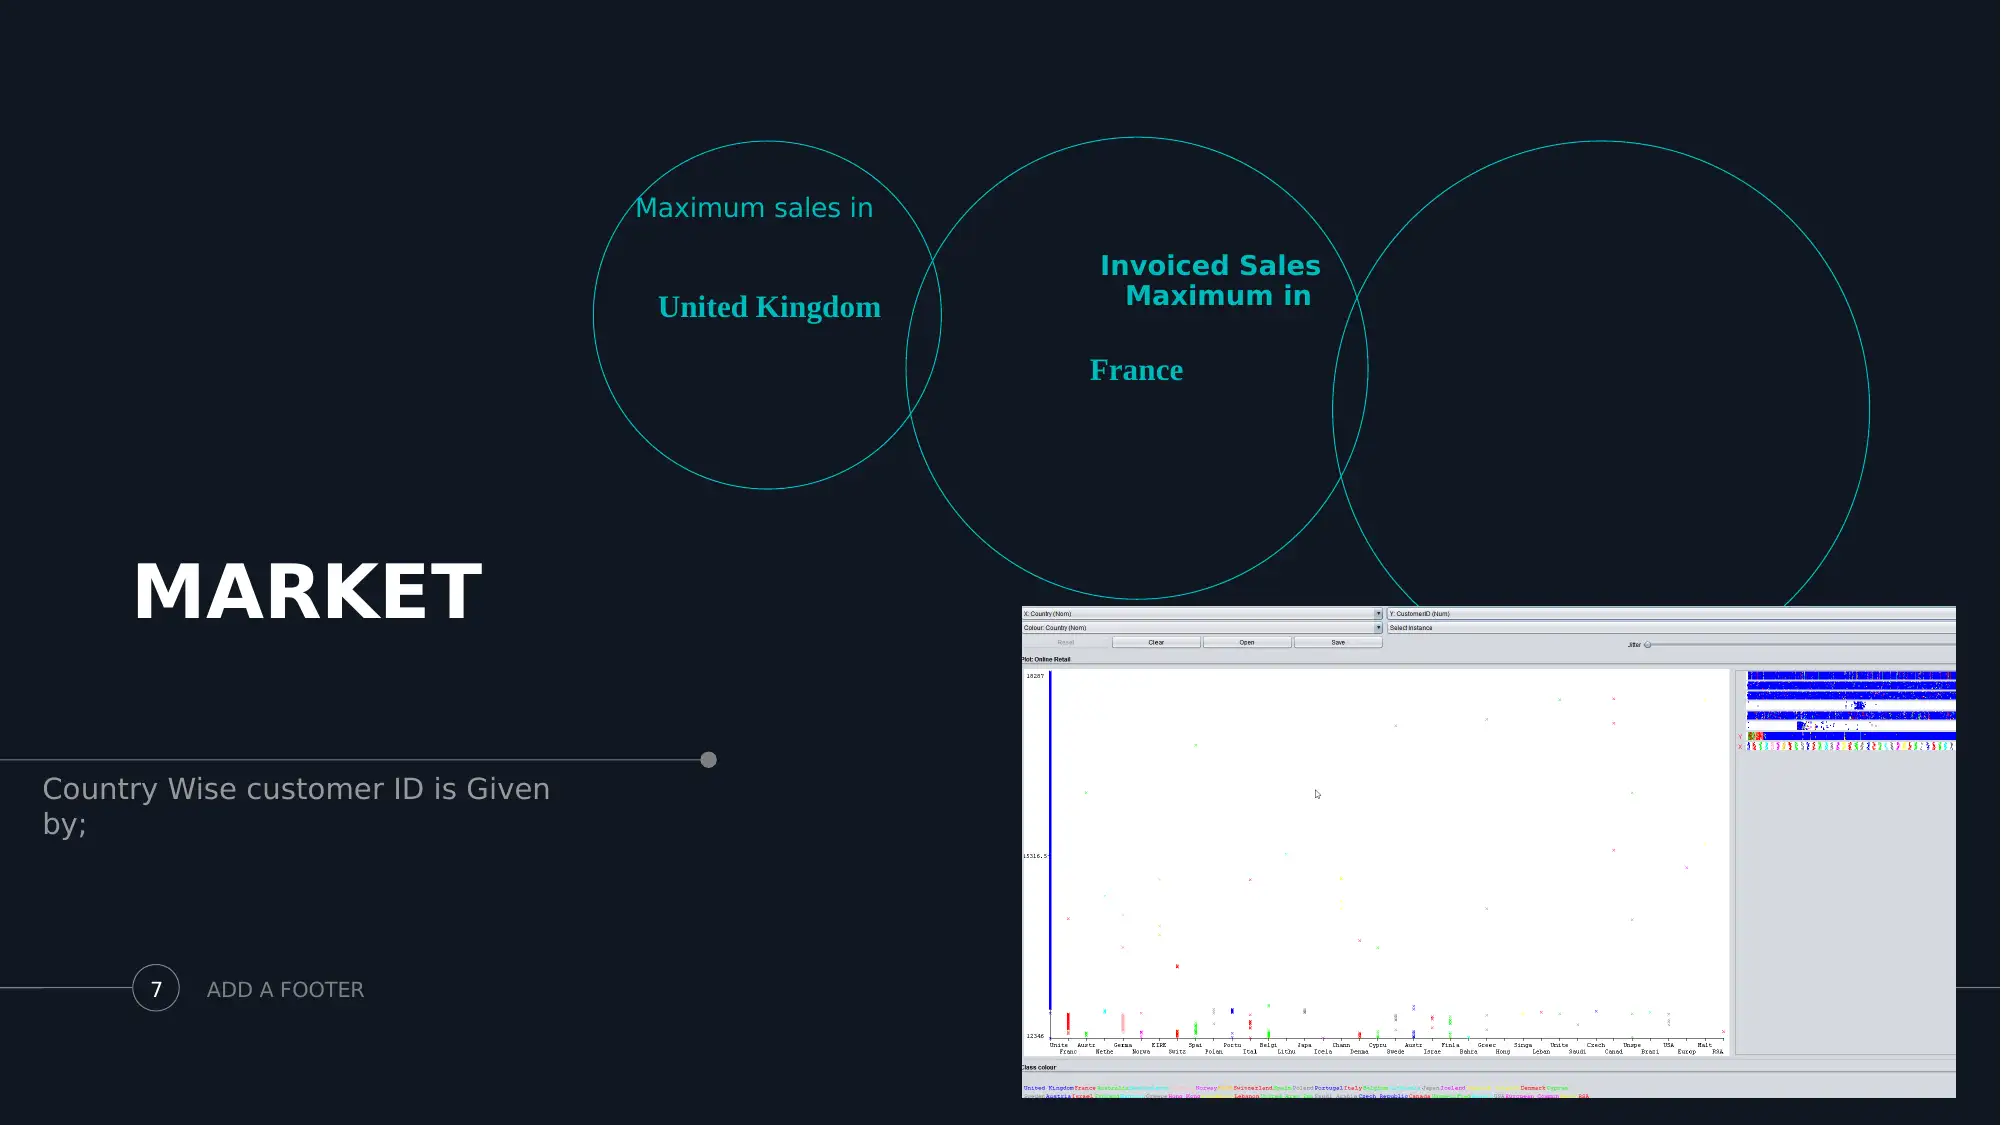
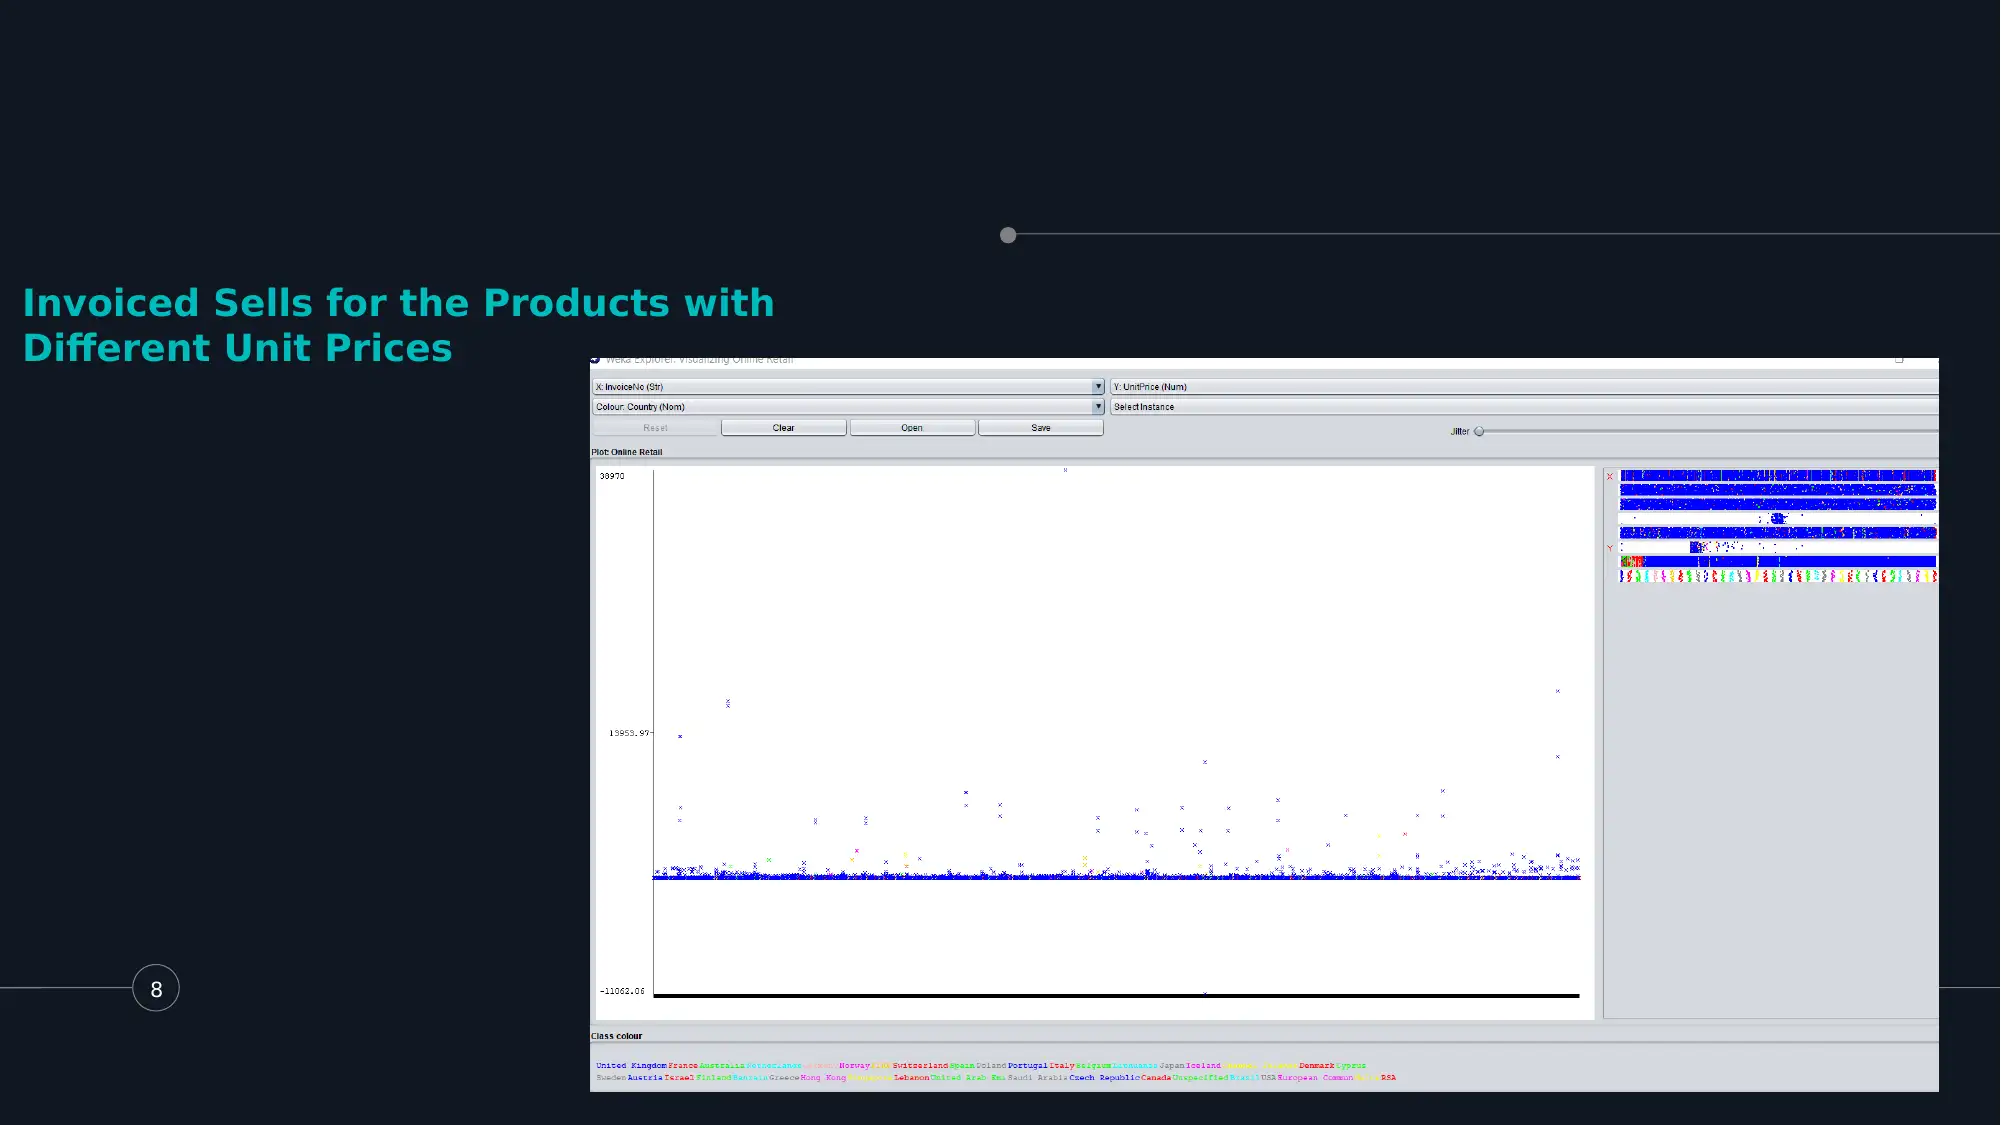
This data analysis project investigates patterns and insights from an online retail store dataset containing 541910 rows of sales data. The project uses Weka to explore factors influencing product sales, identify countries with maximum sales, analyze the relationship between unit price and total sales, and determine the maximum quantity of products sold in different countries. The analysis includes handling missing values, applying the Zero R classifier, and visualizing attribute relationships. Key findings highlight maximum sales in the United Kingdom and France, along with insights into customer ID distribution and invoiced sales for products with varying unit prices. The project aims to achieve wisdom-level business analytics following the CRISP-DM framework.
Document Page
Online Retail Store Data Analysis
Weka Based Data Analysis Project
tabler-icon-diamond-filled.svg

Paraphrase This Document

Need a fresh take? Get an instant paraphrase of this document with our AI Paraphraser
Document Page
Selected Dataset
The Selected dataset is Collected From
http://storm.cis.fordham.edu/~gweiss/data-
mining/datasets.html.
In this data analysis project, different patterns in the
datasets and Insights are Investigated using Weka
The Dataset Contains 541910 Rows of
Sales data about Different Product sales.
The Dataset Contains 8 Distinct columns that stores attributes
like Invoice Number, Stock Code, Quantity ordered, Invoice
Date , Unit Price, Customer ID and Country .
Document Page
3
PROBLEM
What are most important factors
in the Sells of any Particular
Product?o The Country in which Maximum
number of Sales has recorded?
o Relation Between the unit price
and total sales of Different
Products .
o Maximum quantity of Products
sold in which countries?
MM.DD.20XX
Document Page
ADD A FOOTER4
SOLUTION
o There are total 8 fields for every row.
o In the Investigation of Missing Values the maximum
number of Missing values are in Customer ID
Column (135080 Sales records with out customer ID)
o Compared to the other attributes the plots are
generated using comparison against each other.
o The Histogram at the side shows the distribution in
the different countries.
MM.DD.20XX
tabler-icon-diamond-filled.svg

Paraphrase This Document

Need a fresh take? Get an instant paraphrase of this document with our AI Paraphraser
Document Page
ADD A FOOTER5
Use of Zero R
Classifier
MM.DD.20XX
The Results of Zero R Classification of the
Dataset is given below;
Correctly Classified Instances 495478
91.432 %
Incorrectly Classified Instances 46431
8.568 %
Kappa statistic 0
Mean absolute error 0.0086
Root mean squared error
0.0655
Relative absolute error 100 %
Root relative squared error 100
%
Total Number of Instances 541909
Document Page
ADD A FOOTER6
DIVIDER
The information from the dataset
can be extracted considering two
or more than two associative
relation of different attributes of the
dataset.
In this process, we have made an
attempt to visualize the impact
MM.DD.20XX
Document Page
ADD A FOOTER7
MARKET
Maximum sales in
United Kingdom
Invoiced Sales
Maximum in
France
Country Wise customer ID is Given
by;
MM.DD.20XX
tabler-icon-diamond-filled.svg

Paraphrase This Document

Need a fresh take? Get an instant paraphrase of this document with our AI Paraphraser
Document Page
8 MM.DD.20XX
Invoiced Sells for the Products with
Different Unit Prices
chevron_up_icon
1 out of 8
circle_padding
hide_on_mobile
zoom_out_icon
[object Object]