Decision Making: Survey Analysis on Retail Impact & Tech Influence
VerifiedAdded on 2024/05/21
|39
|6007
|55
Report
AI Summary
This report investigates the influence of technological innovation in multichannel shopping on high street shops and malls, employing a survey-based approach to gather data from students. The survey methodology, sampling frame, and questionnaire design are detailed, followed by a summary and analysis of the collected data using statistical measures such as arithmetic mean, median, mode, quartiles, percentiles, and correlation coefficients. Graphs and trend lines are prepared to draw valid conclusions about the survey results, including a discussion of the impact over a three-year period. The report also covers the use of information processing tools and financial tools like NPV and IRR for decision-making, culminating in a formal report suitable for publication in a retail magazine. Desklib offers similar solved assignments and resources for students.

BUSINESS DECISION MAKING
Paraphrase This Document
Need a fresh take? Get an instant paraphrase of this document with our AI Paraphraser
Contents
INTRODUCTION..........................................................................................................................3
TASK 1 – PLANNING THE SURVEY...............................................................................................4
1.1 CREATE A PLAN FOR COLLECTING DATA FROM STUDENTS ACROSS ALL CAMPUSES.4
1.2 PRESENT THE SURVEY METHODOLOGY AND SAMPLING FRAME USED.....................6
1.3 DESIGN A QUESTIONNAIRE FOR COLLECTING DATA...................................................7
QUESTIONNAIRE................................................................................................................7
TASK 2.......................................................................................................................................11
2.1 SUMMARISE THE DATA COLLECTED FROM THE SURVEY USING REPRESENTATIVE
VALUES (ARITHMETIC MEAN, MEDIAN AND MODE)...........................................................11
2.2 ANALYSE THE RESULTS OF THE SURVEY AND DRAW CONCLUSIONS............................13
2.3 ANALYSE THE DATA USING MEASURES OF DISPERSION................................................14
2.4 EXPLAIN HOW QUARTILES, PERCENTILES AND THE CORRELATION COEFFICIENT ARE
USED TO DRAW CONCLUSIONS IN A BUSINESS CONTEXT...................................................15
Task 3........................................................................................................................................16
3.1 PREPARE GRAPHS TO HELP DRAW VALID CONCLUSIONS ON THE SURVEY..................16
3.2 CREATE TREND LINES IN SPREADSHEET GRAPHS TO SHOW THE LEVEL OF IMPACT
OVER A MINIMUM OF 3 YEAR..............................................................................................26
3.3 PREPARE A POSTER PRESENTATION IN CLASS OF YOUR FINDINGS...............................29
3.4 WRITE A FORMAL REPORT ON PUBLICATION IN THE RETAIL MAGAZINE.....................30
Task 4........................................................................................................................................31
4.1 USE APPROPRIATE INFORMATION PROCESSING TOOLS...............................................31
4.2 PREPARE A PROJECT PLAN FOR AN ACTIVITY AND DETERMINE THE CRITICAL PATH. . .32
4.3 USING THE FINANCIAL TOOLS FOR DECISION MAKING.................................................33
a) NPV CALCULATION.................................................................................................33
b) IRR CALCULATION..................................................................................................34

CONCLUSION............................................................................................................................35
REFERENCES.............................................................................................................................36
REFERENCES.............................................................................................................................36
⊘ This is a preview!⊘
Do you want full access?
Subscribe today to unlock all pages.
Trusted by 1+ million students worldwide

INTRODUCTION
The most important that should be focused on the organizations while initiating to do
something is decision-making process. The decision-making process in business
helps the organizations to complete the business activities in an appropriate way that
will reduce the cost and time implicated (Ferrell and Fraedrich, 2015). This process
is helpful to organizations in generating all the possible alternatives to a single
problem and selecting the optimal one of them. This assignment is based on
understanding the influence marked by the developing technology that is used by
multichannel shopping on the high street shops and malls (Sharma, et. al. 2014).
This assignment will generate a proper decision-making process on the basis of
focused topic and make use of statistical data and measures such as mean, median,
mode, quartile deviations, correlation and percentiles.
Paraphrase This Document
Need a fresh take? Get an instant paraphrase of this document with our AI Paraphraser
TASK 1 – PLANNING THE SURVEY
1.1 CREATE A PLAN FOR COLLECTING DATA FROM STUDENTS ACROSS
ALL CAMPUSES
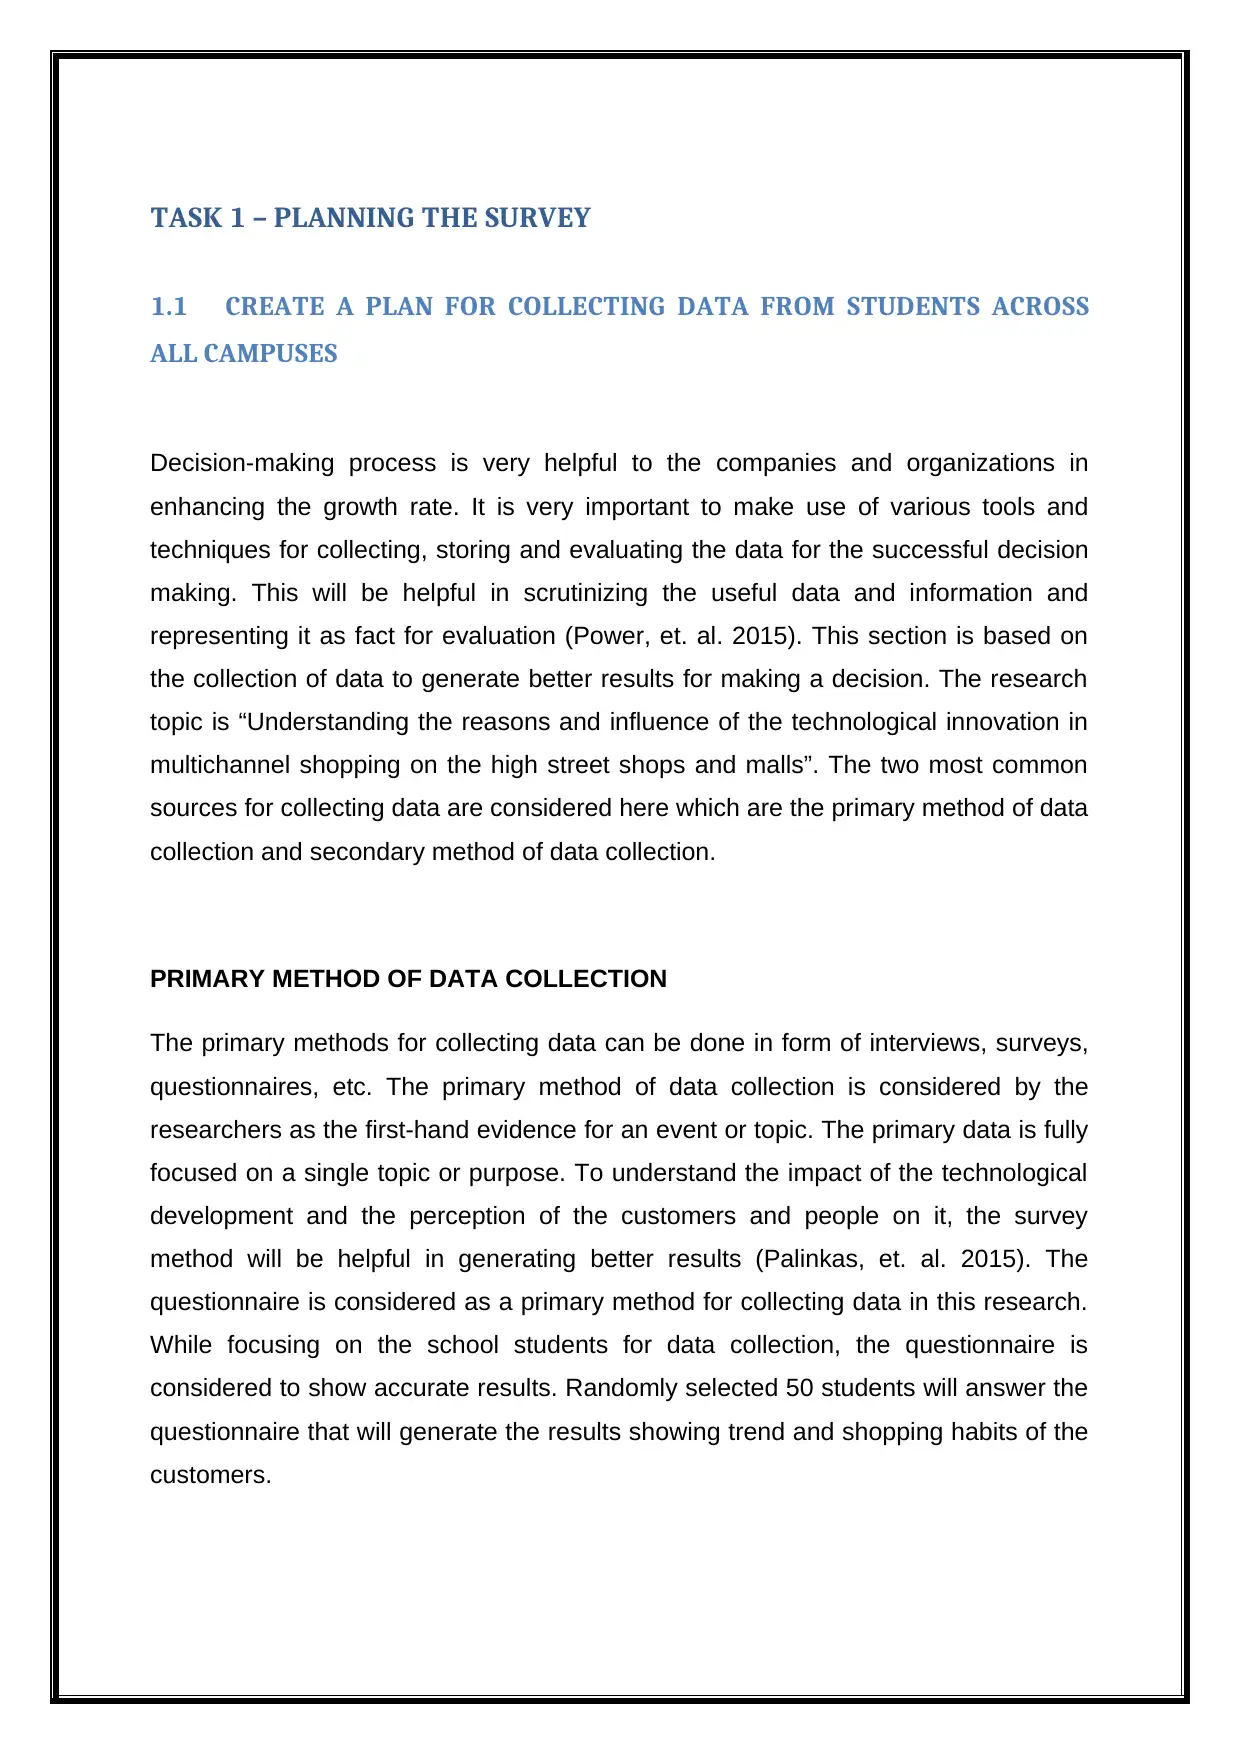
Decision-making process is very helpful to the companies and organizations in
enhancing the growth rate. It is very important to make use of various tools and
techniques for collecting, storing and evaluating the data for the successful decision
making. This will be helpful in scrutinizing the useful data and information and
representing it as fact for evaluation (Power, et. al. 2015). This section is based on
the collection of data to generate better results for making a decision. The research
topic is “Understanding the reasons and influence of the technological innovation in
multichannel shopping on the high street shops and malls”. The two most common
sources for collecting data are considered here which are the primary method of data
collection and secondary method of data collection.
PRIMARY METHOD OF DATA COLLECTION
The primary methods for collecting data can be done in form of interviews, surveys,
questionnaires, etc. The primary method of data collection is considered by the
researchers as the first-hand evidence for an event or topic. The primary data is fully
focused on a single topic or purpose. To understand the impact of the technological
development and the perception of the customers and people on it, the survey
method will be helpful in generating better results (Palinkas, et. al. 2015). The
questionnaire is considered as a primary method for collecting data in this research.
While focusing on the school students for data collection, the questionnaire is
considered to show accurate results. Randomly selected 50 students will answer the
questionnaire that will generate the results showing trend and shopping habits of the
customers.
1.1 CREATE A PLAN FOR COLLECTING DATA FROM STUDENTS ACROSS
ALL CAMPUSES
Decision-making process is very helpful to the companies and organizations in
enhancing the growth rate. It is very important to make use of various tools and
techniques for collecting, storing and evaluating the data for the successful decision
making. This will be helpful in scrutinizing the useful data and information and
representing it as fact for evaluation (Power, et. al. 2015). This section is based on
the collection of data to generate better results for making a decision. The research
topic is “Understanding the reasons and influence of the technological innovation in
multichannel shopping on the high street shops and malls”. The two most common
sources for collecting data are considered here which are the primary method of data
collection and secondary method of data collection.
PRIMARY METHOD OF DATA COLLECTION
The primary methods for collecting data can be done in form of interviews, surveys,
questionnaires, etc. The primary method of data collection is considered by the
researchers as the first-hand evidence for an event or topic. The primary data is fully
focused on a single topic or purpose. To understand the impact of the technological
development and the perception of the customers and people on it, the survey
method will be helpful in generating better results (Palinkas, et. al. 2015). The
questionnaire is considered as a primary method for collecting data in this research.
While focusing on the school students for data collection, the questionnaire is
considered to show accurate results. Randomly selected 50 students will answer the
questionnaire that will generate the results showing trend and shopping habits of the
customers.
SECONDARY METHOD OF DATA COLLECTION:
The data that is collected by other researchers in past or the one which was
published previously in some magazine or art gallery is considered as the secondary
data. The secondary data is usually collected from censuses, records of the
organizations or a particular party, governmental departments, previous researchers,
etc. The secondary data is considered as a part of quantitative data. This data is
helpful to researchers in generating appropriate results (Heeringa, et. al. 2017).
Apart from questionnaire as a primary data, this assignment is also based on the
facts and figures collected by the previous researchers on this topic which includes
the articles published in journals by UK government, retail price surveys, changing
trends, etc. This is helpful in targeting the correct population.
⊘ This is a preview!⊘
Do you want full access?
Subscribe today to unlock all pages.
Trusted by 1+ million students worldwide
1.2 PRESENT THE SURVEY METHODOLOGY AND SAMPLING FRAME USED
A surveying method is a detailed approach of collecting the data from potential
customers and market to analyse the collected data and recover the valuable
information that will be helpful in properly implementing the decision-making process
(Moser and Kalton, 2017). In the context of this research project of understanding
the innovation implication, a survey is conducted on 100 students having the
shopping habit and investment nature. This will be helpful in the understanding
periodical changes in the market and shopping nature of the consumers. Apart from
this, it will also be helpful in understanding the socio-economic impact.
The most important and crucial features of data collection methods are interview
questions and questionnaire that generated a sample framework (Sullivan-Bolyai, et.
al. 2014). The designed questionnaire in this section sequence will describe various
questions to be asked that will derive required and suitable data according to the
topic. About n number of students are nominated from the whole populace who will
answer the survey. The sample size of this survey is described as follows:
Miscalculation chances: 5%
Positive variance or confidence interval: 95 %
Total populace: 2000 students
Responsive population: 60%
A sample of recommendation: 100 students
From about 2000 students across all the universities, about 100 students are chosen
to answer the questionnaire as a result of the sampling method.
Paraphrase This Document
Need a fresh take? Get an instant paraphrase of this document with our AI Paraphraser
1.3 DESIGN A QUESTIONNAIRE FOR COLLECTING DATA
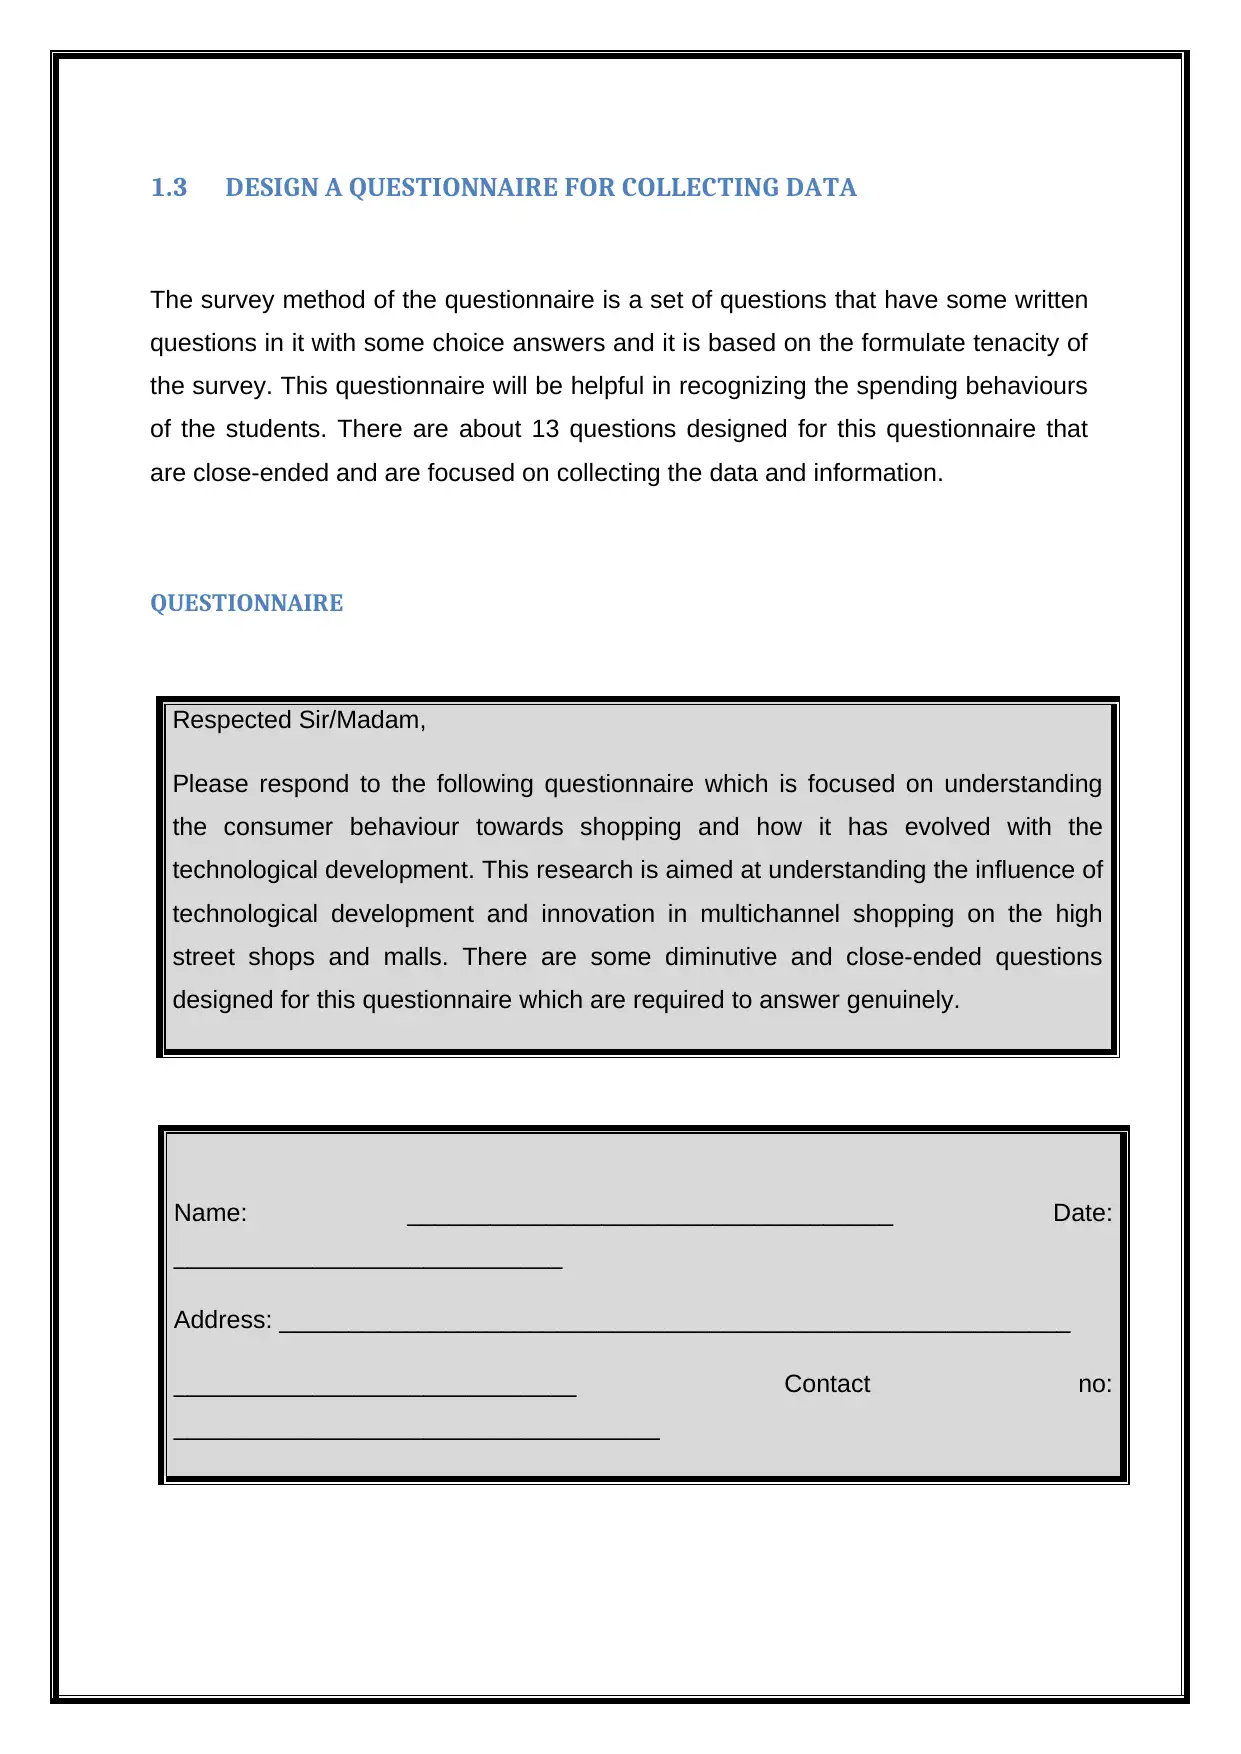
The survey method of the questionnaire is a set of questions that have some written
questions in it with some choice answers and it is based on the formulate tenacity of
the survey. This questionnaire will be helpful in recognizing the spending behaviours
of the students. There are about 13 questions designed for this questionnaire that
are close-ended and are focused on collecting the data and information.
QUESTIONNAIRE
Respected Sir/Madam,
Please respond to the following questionnaire which is focused on understanding
the consumer behaviour towards shopping and how it has evolved with the
technological development. This research is aimed at understanding the influence of
technological development and innovation in multichannel shopping on the high
street shops and malls. There are some diminutive and close-ended questions
designed for this questionnaire which are required to answer genuinely.
Name: ___________________________________ Date:
____________________________
Address: _________________________________________________________
_____________________________ Contact no:
___________________________________
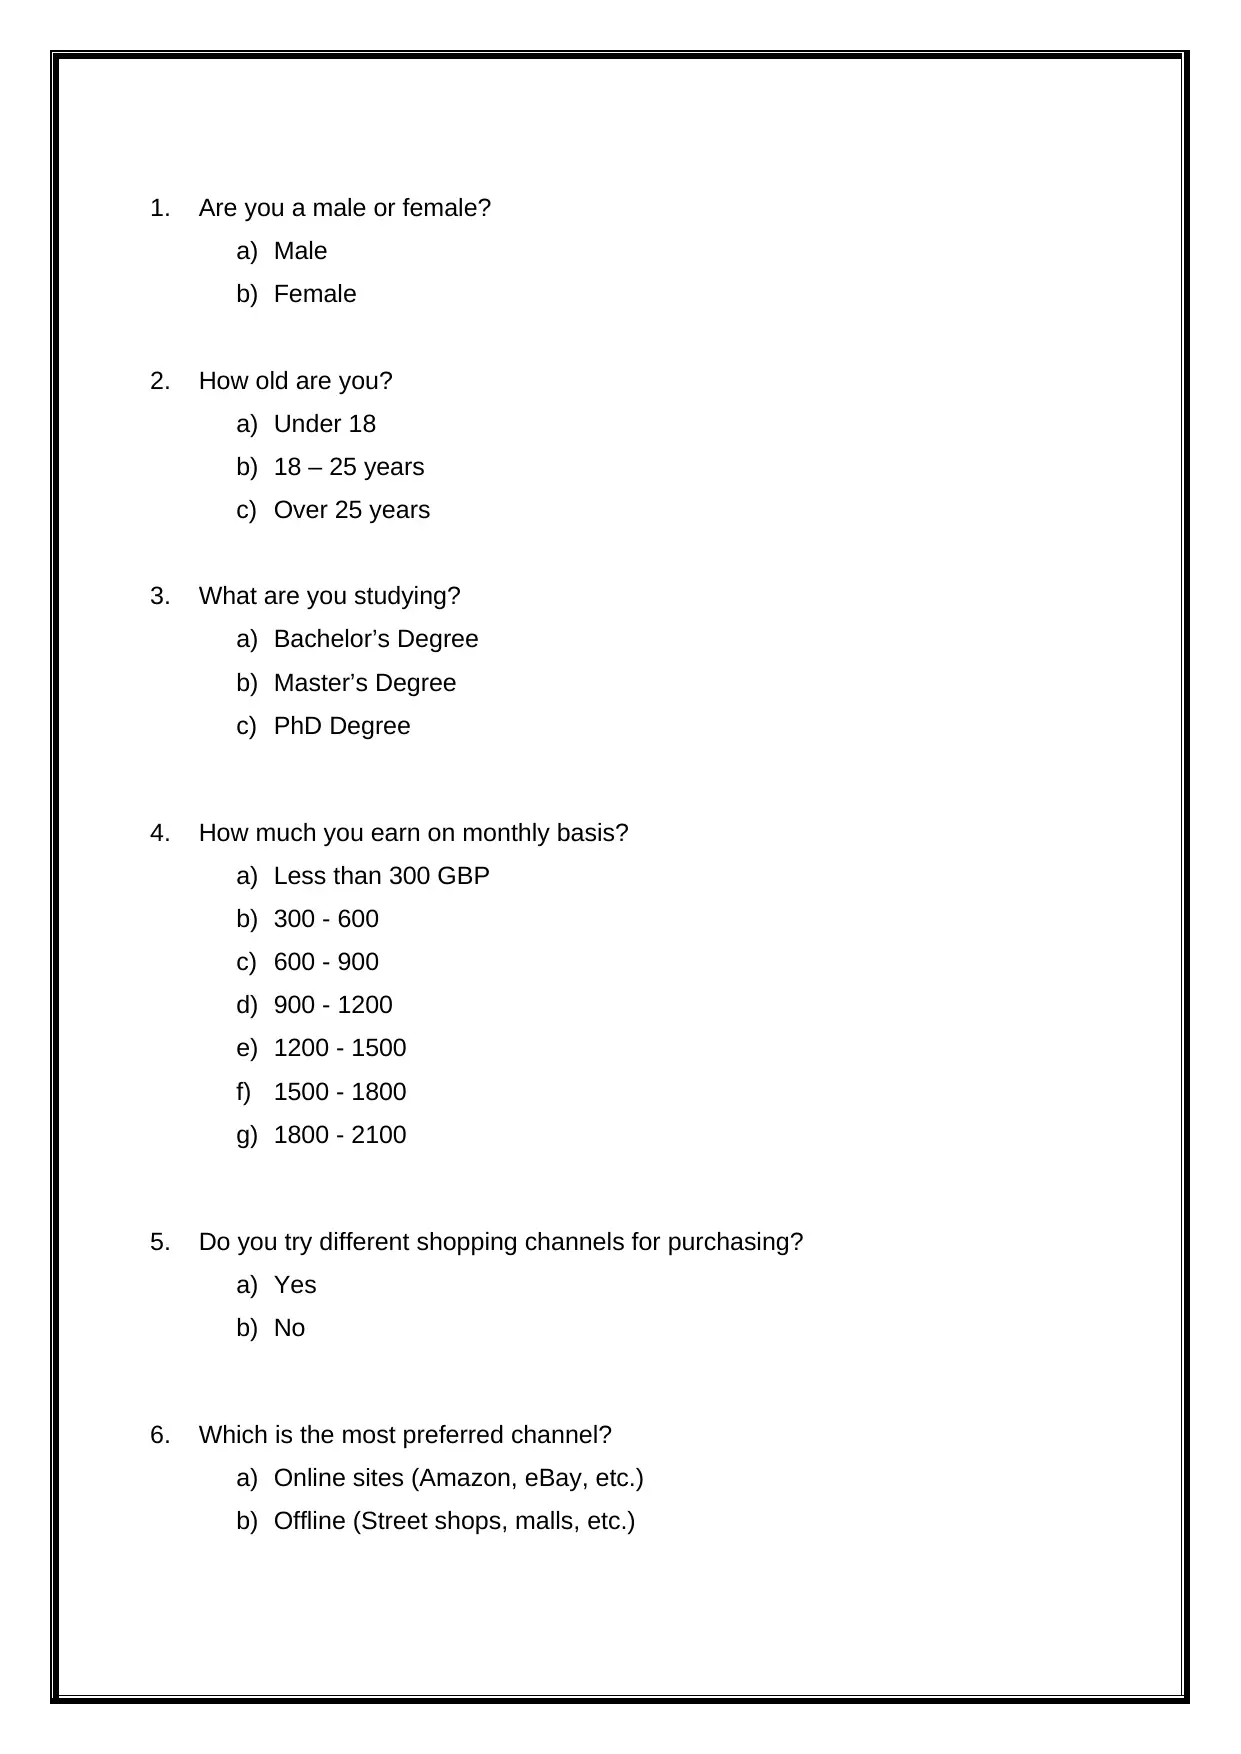
1. Are you a male or female?
a) Male
b) Female
2. How old are you?
a) Under 18
b) 18 – 25 years
c) Over 25 years
3. What are you studying?
a) Bachelor’s Degree
b) Master’s Degree
c) PhD Degree
4. How much you earn on monthly basis?
a) Less than 300 GBP
b) 300 - 600
c) 600 - 900
d) 900 - 1200
e) 1200 - 1500
f) 1500 - 1800
g) 1800 - 2100
5. Do you try different shopping channels for purchasing?
a) Yes
b) No
6. Which is the most preferred channel?
a) Online sites (Amazon, eBay, etc.)
b) Offline (Street shops, malls, etc.)
⊘ This is a preview!⊘
Do you want full access?
Subscribe today to unlock all pages.
Trusted by 1+ million students worldwide
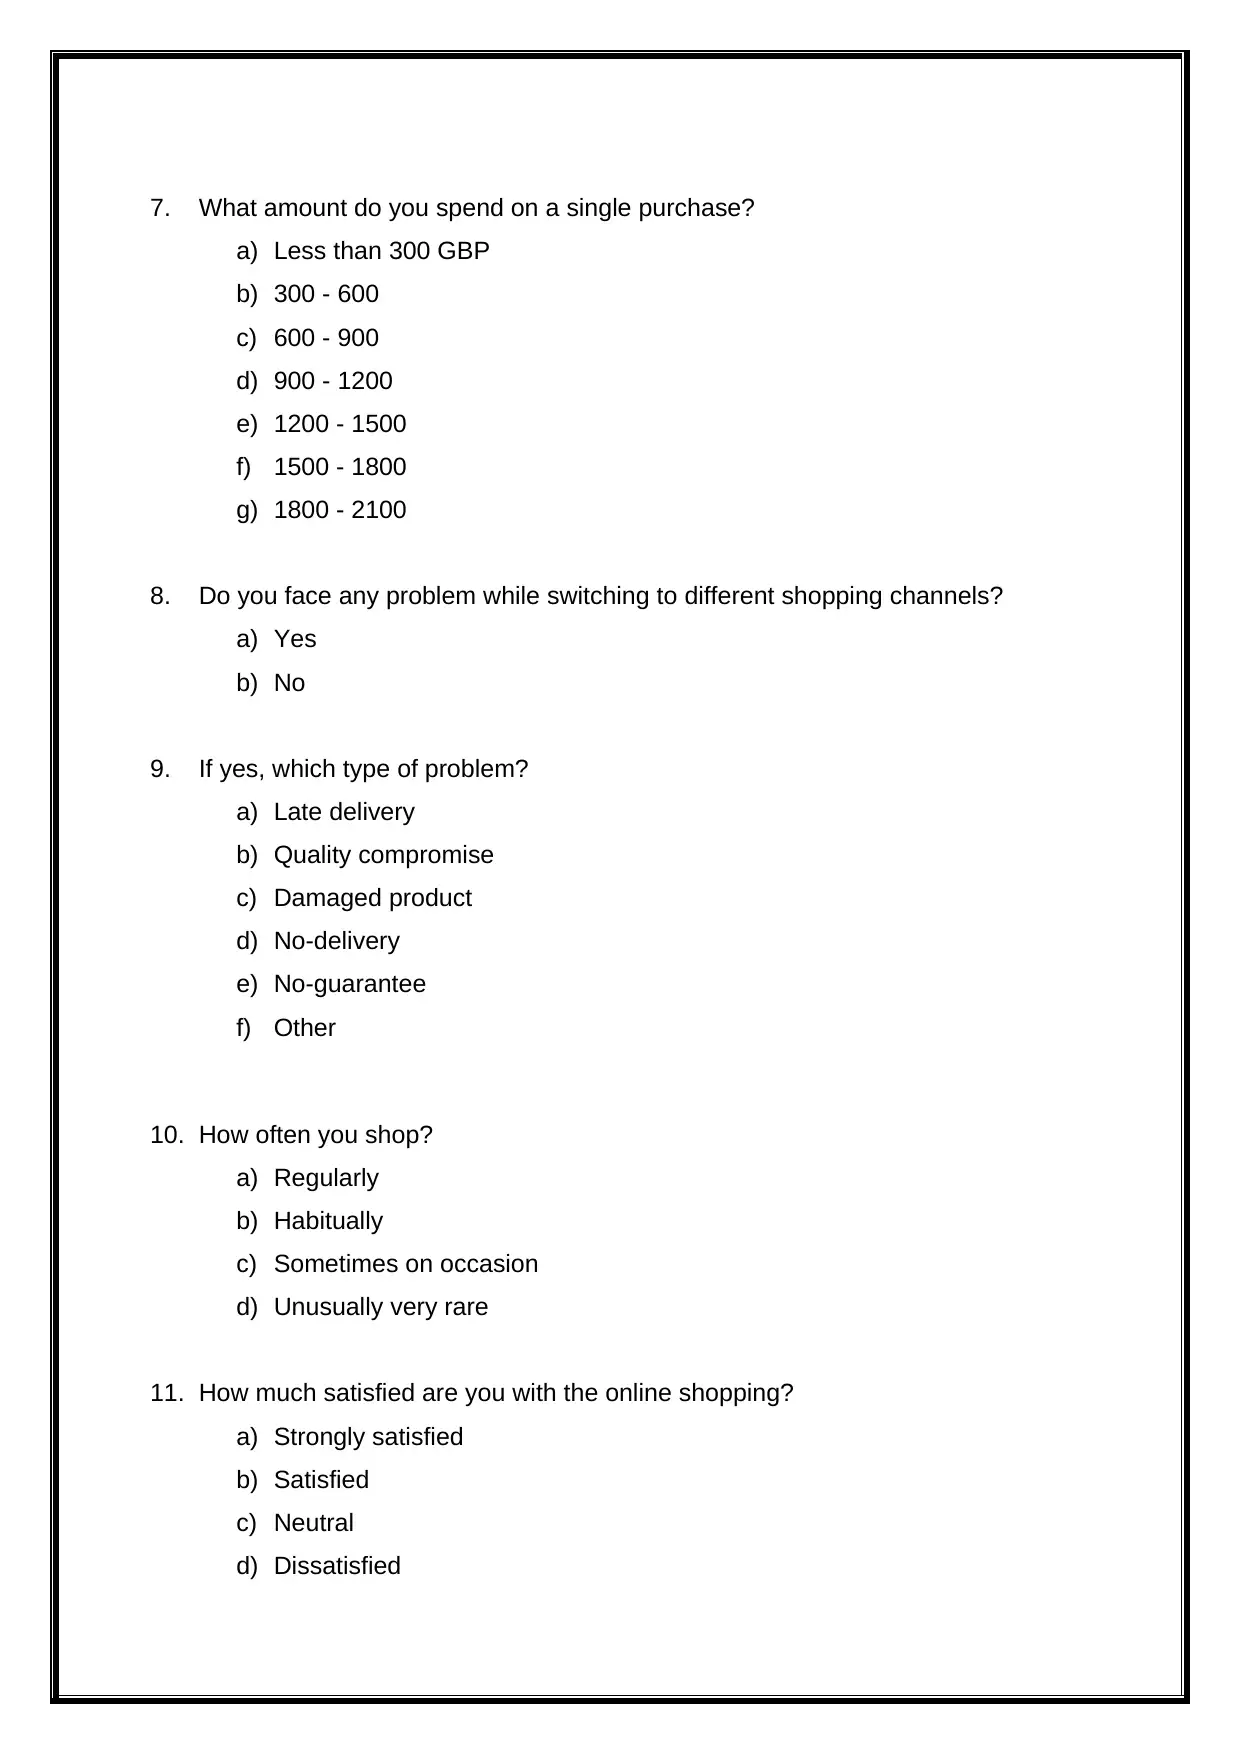
7. What amount do you spend on a single purchase?
a) Less than 300 GBP
b) 300 - 600
c) 600 - 900
d) 900 - 1200
e) 1200 - 1500
f) 1500 - 1800
g) 1800 - 2100
8. Do you face any problem while switching to different shopping channels?
a) Yes
b) No
9. If yes, which type of problem?
a) Late delivery
b) Quality compromise
c) Damaged product
d) No-delivery
e) No-guarantee
f) Other
10. How often you shop?
a) Regularly
b) Habitually
c) Sometimes on occasion
d) Unusually very rare
11. How much satisfied are you with the online shopping?
a) Strongly satisfied
b) Satisfied
c) Neutral
d) Dissatisfied
Paraphrase This Document
Need a fresh take? Get an instant paraphrase of this document with our AI Paraphraser
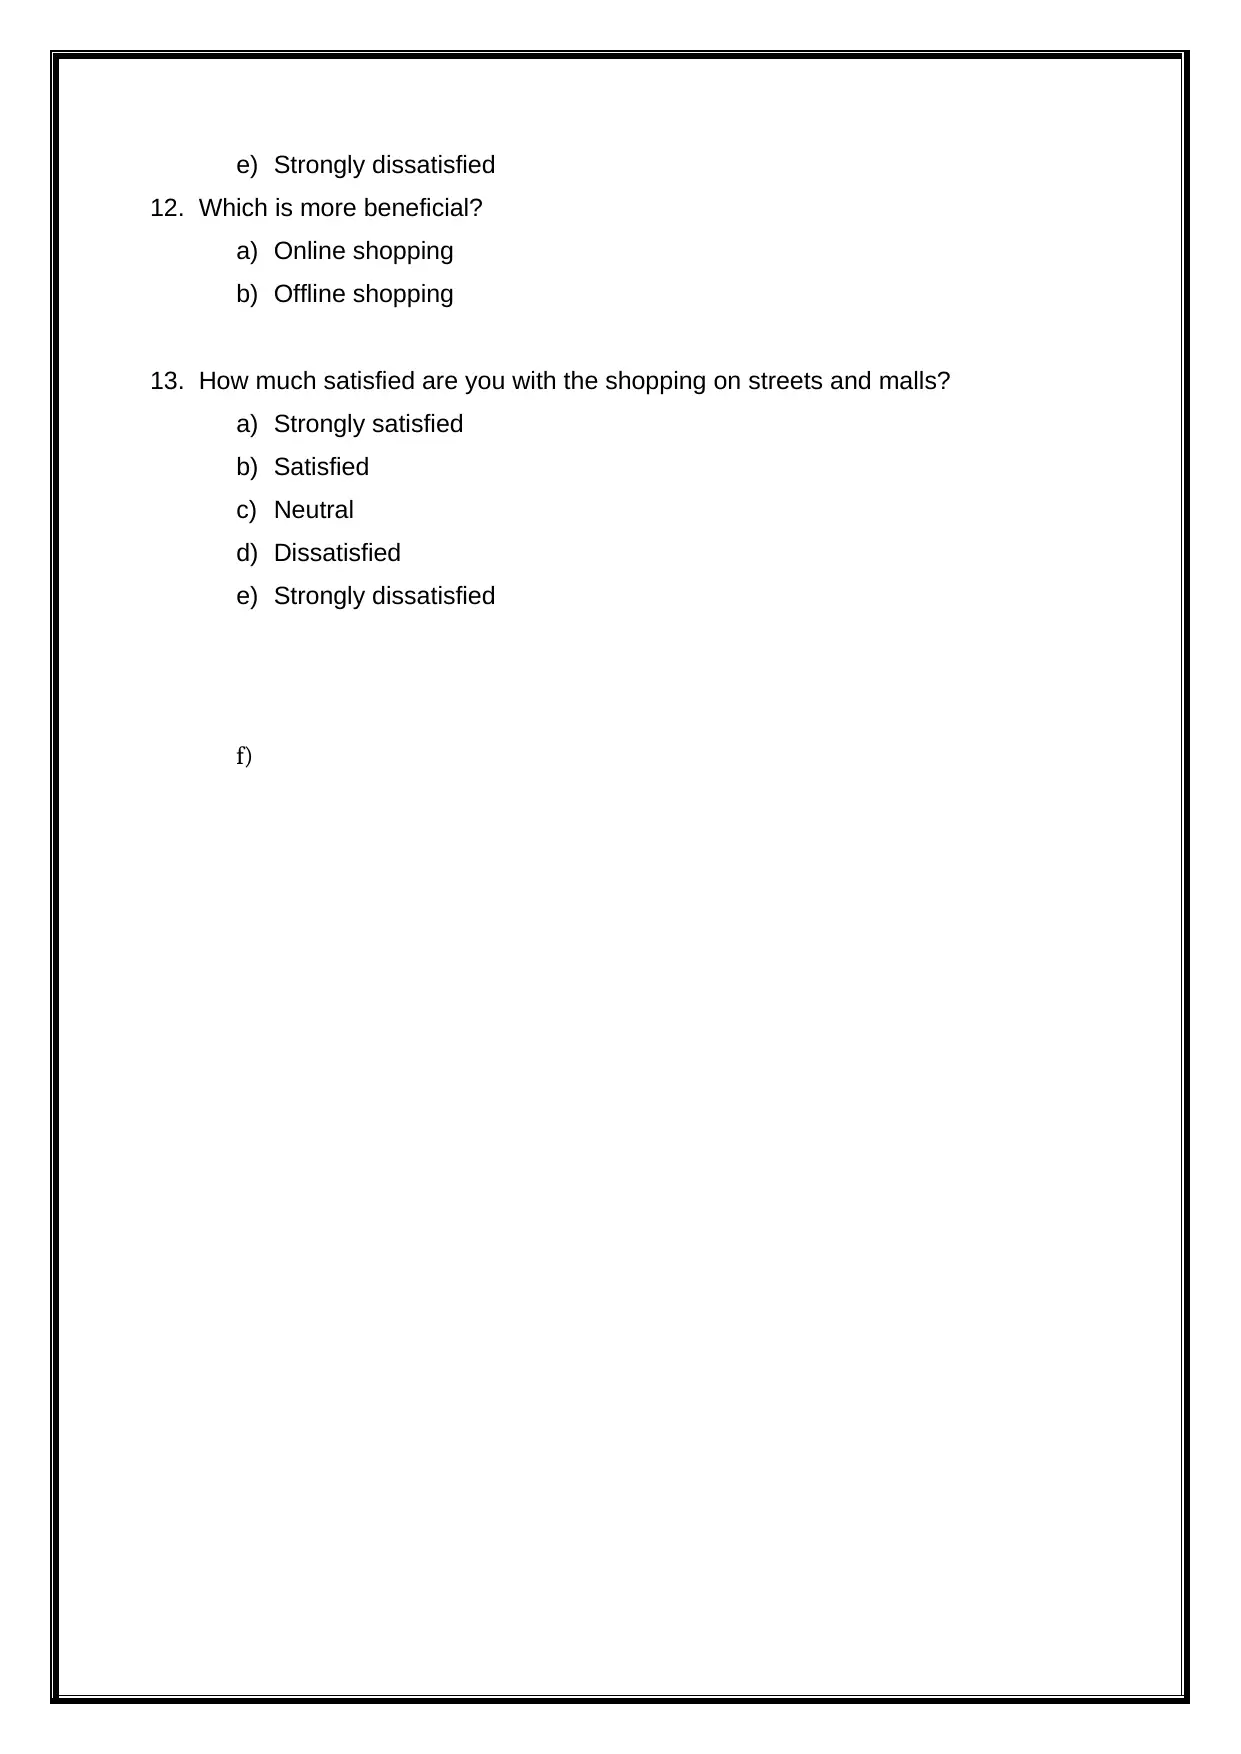
e) Strongly dissatisfied
12. Which is more beneficial?
a) Online shopping
b) Offline shopping
13. How much satisfied are you with the shopping on streets and malls?
a) Strongly satisfied
b) Satisfied
c) Neutral
d) Dissatisfied
e) Strongly dissatisfied
f)
12. Which is more beneficial?
a) Online shopping
b) Offline shopping
13. How much satisfied are you with the shopping on streets and malls?
a) Strongly satisfied
b) Satisfied
c) Neutral
d) Dissatisfied
e) Strongly dissatisfied
f)
TASK 2
2.1 SUMMARISE THE DATA COLLECTED FROM THE SURVEY USING
REPRESENTATIVE VALUES (ARITHMETIC MEAN, MEDIAN AND MODE)
The questionnaire designed above has tried to cover all the areas of online and
offline shopping and the satisfactory level customers have with both types of
shopping concept. The questionnaire was conducted by 100 university students
describing their shopping habits and changes in the habits because of the
developing technology and digital shopping methods. The focus was only students
belonging to age group of young generation from about 15 to 30 perusing either
graduation or post-graduation or PhD. Some undergraduates were also chosen. The
girls and boys were selected in equal ratio to generate more accurate results of the
survey. 50 male people and 50 female people responded to this survey. 26 people
were under 18, 37 people were belonging to the age group of 18 to 25 years and 37
people were more than 25 years old. 13 students earn less than 300 personally but
when asked, come of them were given pocket money from their parents to spend.
The survey resulted that the students pursuing master’s degree are more likely to
spend on shopping through different channels. There is no huge difference between
the online and offline shopping by them. All of them are most likely to prefer both
types of channels. Still, a little difference in the preference over online and offline
shopping, 54 people on 100 prefers online shopping services.
Different respondents have described issues that they have faced while shopping
online. Some of them have described the problem of damaged products received at
the time of delivery and some of them told that they have not received the product
ever. Some of them have responded that they have received the delivery of the
product very late. Some of the students described that they were not offered the
quality of the products same that was shown and described in the picture.
⊘ This is a preview!⊘
Do you want full access?
Subscribe today to unlock all pages.
Trusted by 1+ million students worldwide
1 out of 39
Related Documents


Your All-in-One AI-Powered Toolkit for Academic Success.
+13062052269
info@desklib.com
Available 24*7 on WhatsApp / Email
![[object Object]](/_next/static/media/star-bottom.7253800d.svg)
Unlock your academic potential
Copyright © 2020–2026 A2Z Services. All Rights Reserved. Developed and managed by ZUCOL.