Profit Analysis of Brick and Mortar Retail Business with Online Sales
VerifiedAdded on 2023/06/05
|19
|3230
|302
Report
AI Summary
This report investigates the profit and sales performance of a brick and mortar retail shop, with a focus on the impact of recent online sales integration. Key findings highlight women's clothing and men's shoes as major profit drivers, while women's clothing also represents the highest cost segment. Credit card payments are the dominant payment method. Customer loyalty is linked to frequent store visits, and gender-based analysis reveals higher loyalty among male customers. The study also examines the positive impact of online sales on overall profit. The report utilizes various analytical tools such as ANOVA, decision trees, and descriptive statistics to provide a comprehensive overview of the business's financial landscape.
19
Profit Analysis of Retail Business –
The Brick and Mortar Case Scenario
Name:
Student Number:
Tutor Information:
Word Count:
Profit Analysis of Retail Business –
The Brick and Mortar Case Scenario
Name:
Student Number:
Tutor Information:
Word Count:
Paraphrase This Document
Need a fresh take? Get an instant paraphrase of this document with our AI Paraphraser
19
Executive Summary
The present report has been commissioned to investigate the profit and sales scenario of the
Brick and Mortar shop. The shop has started doing online business from the last year, and special
attention was given to analyze the effect on sales. This research illustrates that women clothing
and men’s shoes were the major products behind the profit of the shop. Cost of women clothing
was the maximum amongst different product segments. Credit payment was the primarily used
payment system in the store. Further investigation was made about the frequency of the
customers visiting the store, and frequent or regular customers’ were found to be loyal towards
the shop and their diverse product ranges present in the store. A gender base study was also
conducted to examine the difference in consumers’ attitude towards products, where males were
found to be more loyal compared to women. Finally, research was conducted for analyzing the
impact of the online sale on the profit level, and the average profit for online sales was found to
be the highest.
19
Table of Contents
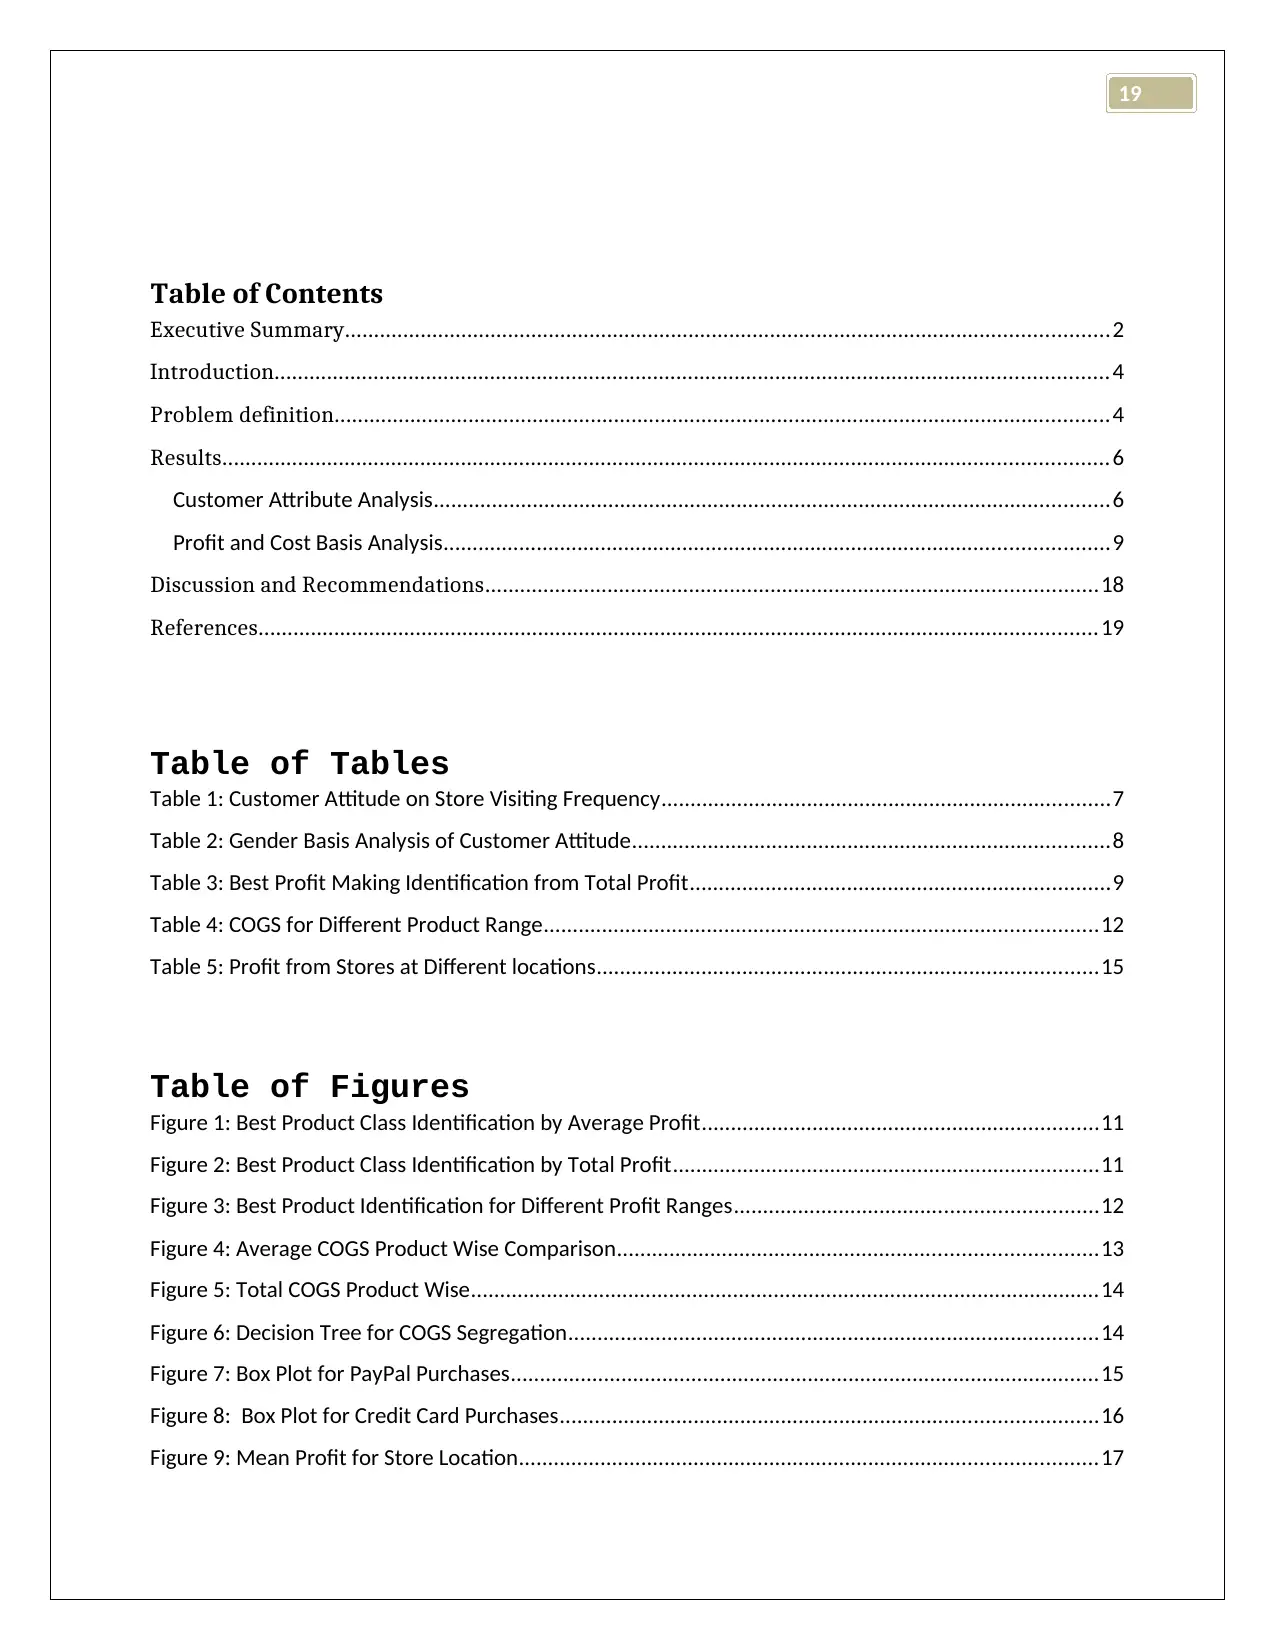
Executive Summary...................................................................................................................................2
Introduction...............................................................................................................................................4
Problem definition.....................................................................................................................................4
Results........................................................................................................................................................6
Customer Attribute Analysis....................................................................................................................6
Profit and Cost Basis Analysis..................................................................................................................9
Discussion and Recommendations.........................................................................................................18
References................................................................................................................................................19
Table of Tables
Table 1: Customer Attitude on Store Visiting Frequency.............................................................................7
Table 2: Gender Basis Analysis of Customer Attitude..................................................................................8
Table 3: Best Profit Making Identification from Total Profit........................................................................9
Table 4: COGS for Different Product Range...............................................................................................12
Table 5: Profit from Stores at Different locations......................................................................................15
Table of Figures
Figure 1: Best Product Class Identification by Average Profit....................................................................11
Figure 2: Best Product Class Identification by Total Profit.........................................................................11
Figure 3: Best Product Identification for Different Profit Ranges..............................................................12
Figure 4: Average COGS Product Wise Comparison..................................................................................13
Figure 5: Total COGS Product Wise............................................................................................................14
Figure 6: Decision Tree for COGS Segregation...........................................................................................14
Figure 7: Box Plot for PayPal Purchases.....................................................................................................15
Figure 8: Box Plot for Credit Card Purchases............................................................................................16
Figure 9: Mean Profit for Store Location...................................................................................................17
Table of Contents
Executive Summary...................................................................................................................................2
Introduction...............................................................................................................................................4
Problem definition.....................................................................................................................................4
Results........................................................................................................................................................6
Customer Attribute Analysis....................................................................................................................6
Profit and Cost Basis Analysis..................................................................................................................9
Discussion and Recommendations.........................................................................................................18
References................................................................................................................................................19
Table of Tables
Table 1: Customer Attitude on Store Visiting Frequency.............................................................................7
Table 2: Gender Basis Analysis of Customer Attitude..................................................................................8
Table 3: Best Profit Making Identification from Total Profit........................................................................9
Table 4: COGS for Different Product Range...............................................................................................12
Table 5: Profit from Stores at Different locations......................................................................................15
Table of Figures
Figure 1: Best Product Class Identification by Average Profit....................................................................11
Figure 2: Best Product Class Identification by Total Profit.........................................................................11
Figure 3: Best Product Identification for Different Profit Ranges..............................................................12
Figure 4: Average COGS Product Wise Comparison..................................................................................13
Figure 5: Total COGS Product Wise............................................................................................................14
Figure 6: Decision Tree for COGS Segregation...........................................................................................14
Figure 7: Box Plot for PayPal Purchases.....................................................................................................15
Figure 8: Box Plot for Credit Card Purchases............................................................................................16
Figure 9: Mean Profit for Store Location...................................................................................................17
⊘ This is a preview!⊘
Do you want full access?
Subscribe today to unlock all pages.
Trusted by 1+ million students worldwide
19
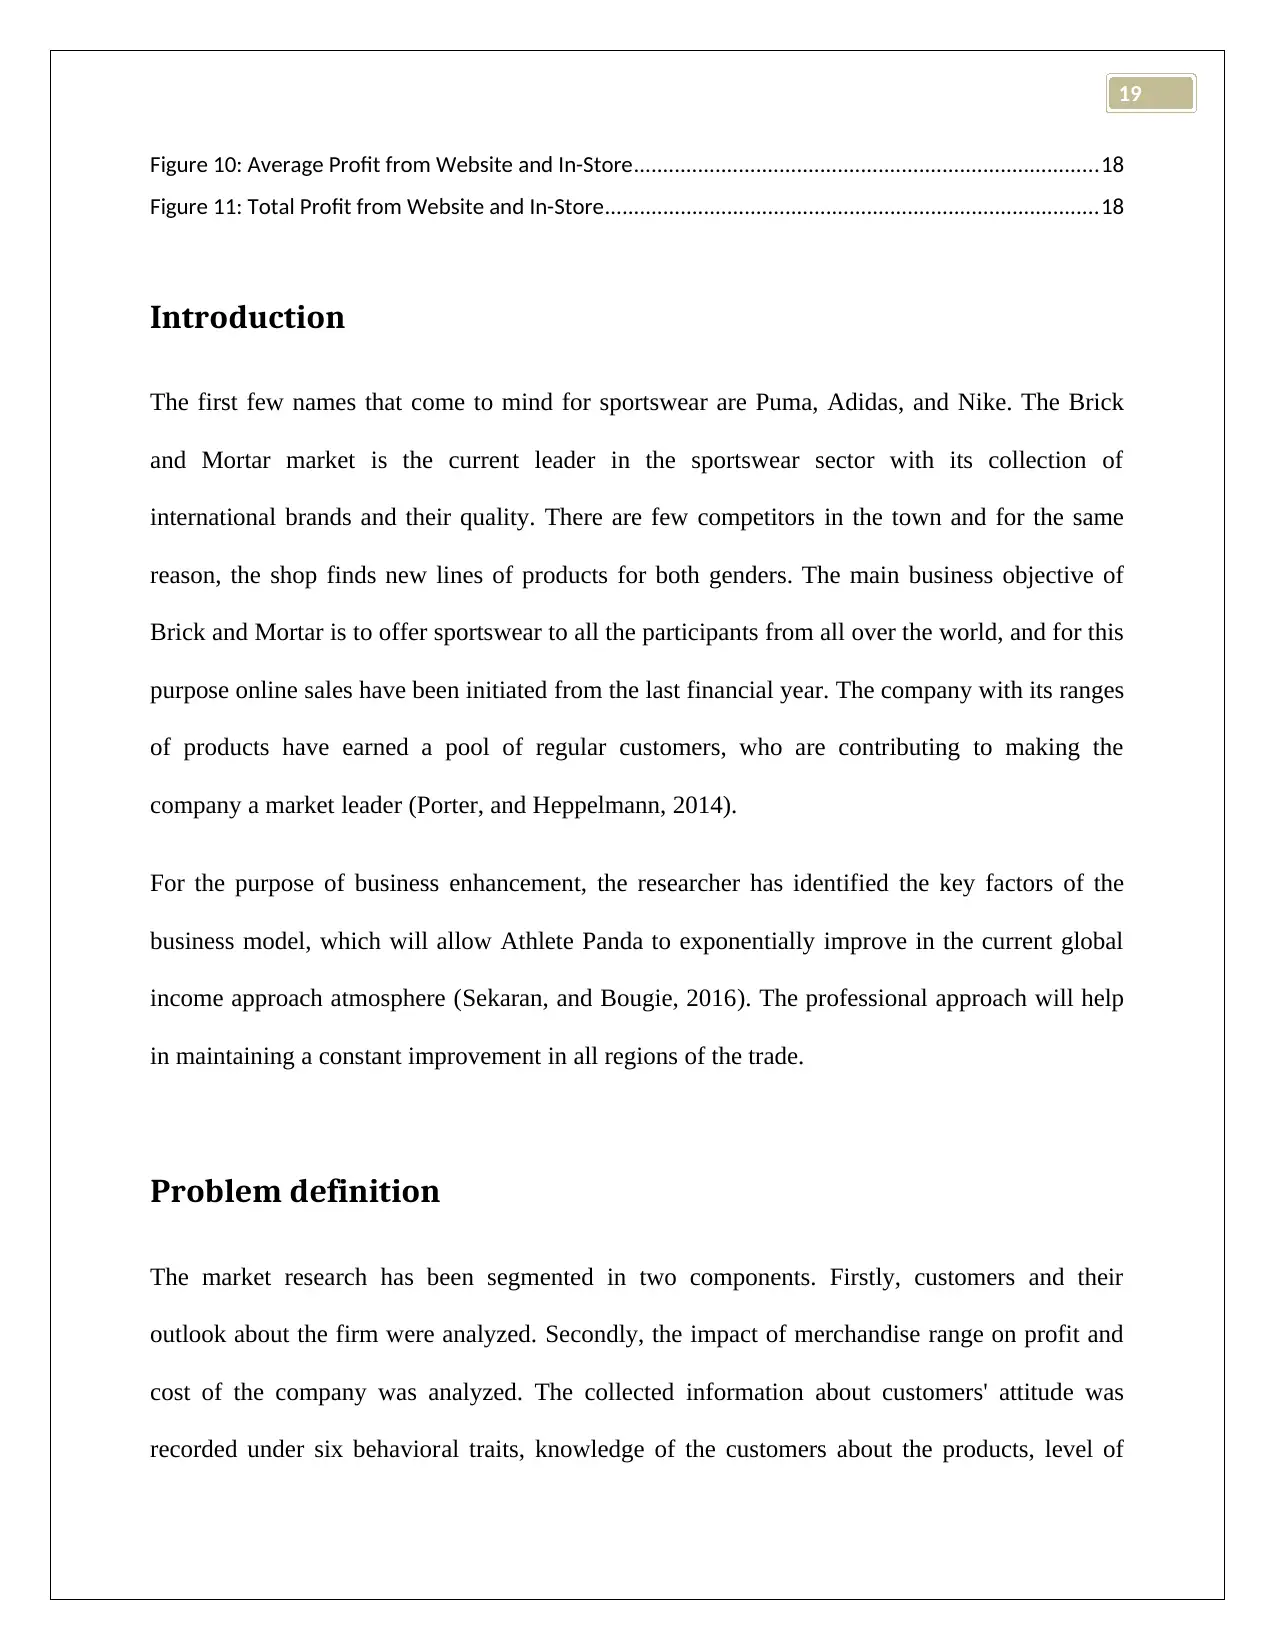
Figure 10: Average Profit from Website and In-Store................................................................................18
Figure 11: Total Profit from Website and In-Store.....................................................................................18
Introduction
The first few names that come to mind for sportswear are Puma, Adidas, and Nike. The Brick
and Mortar market is the current leader in the sportswear sector with its collection of
international brands and their quality. There are few competitors in the town and for the same
reason, the shop finds new lines of products for both genders. The main business objective of
Brick and Mortar is to offer sportswear to all the participants from all over the world, and for this
purpose online sales have been initiated from the last financial year. The company with its ranges
of products have earned a pool of regular customers, who are contributing to making the
company a market leader (Porter, and Heppelmann, 2014).
For the purpose of business enhancement, the researcher has identified the key factors of the
business model, which will allow Athlete Panda to exponentially improve in the current global
income approach atmosphere (Sekaran, and Bougie, 2016). The professional approach will help
in maintaining a constant improvement in all regions of the trade.
Problem definition
The market research has been segmented in two components. Firstly, customers and their
outlook about the firm were analyzed. Secondly, the impact of merchandise range on profit and
cost of the company was analyzed. The collected information about customers' attitude was
recorded under six behavioral traits, knowledge of the customers about the products, level of
Paraphrase This Document
Need a fresh take? Get an instant paraphrase of this document with our AI Paraphraser
19
satisfaction from the purchase, preference for particular products, reason for purchase, loyalty
towards Brick and Mortar, and whether they will recommend the products to other customers
(Oliver, 2014). The information from the company factsheet regarding their last year sales and
profits included information about product variety and payment methods, and especially about
the mode of selling (online or offline sale).
Emphasis was given on two customer-related explicit investigations.
a. Whether the customer groups have any effect on their attitude towards the company, and
b. Whether the outlook of the consumers depends on their gender.
Customers groups and genders were two nominal and categorical variables. The six attribute
scores, and the computed customer attitude (sum of the six attributes) was an interval type
variable. The above two scenarios were investigated with the help analysis of variance
(ANOVA) tool (Mertler, and Reinhart, 2016).
In the second part, the researcher investigated five aspects of the business model based on the
profit and cost of goods, incurred by Brick and Mortar. The merchandise range was scrutinized
along with payment methods utilized by the customers. Finally, the effect of the location of the
store and impact of adoption of the online sale were researched. The following research queries
were framed for the intention of detail scrutiny.
a. Which merchandise was the best profitable range of product?
b. Which merchandise was the source of the highest cost for goods (COGS)?
c. What difference between the two payment methods exists?
d. Whether the store location has a relationship with the sales of the store?
e. Whether online sale has positively affected the profit of the store?
19
Descriptive analysis was espoused for identifying the optimum value of the variables. Highest
and lowest categories were identified from the measure of central tendencies and visual
presentation. Inferential analyses such as paired t-test, Chi-Square test, and ANOVA have been
applied to establish the claims of descriptive analyses. Decision trees also have been utilized for
detail visual presentation for the best product for profit and COGS (Block, and Lau, 2016).
Results
Customer Attribute Analysis
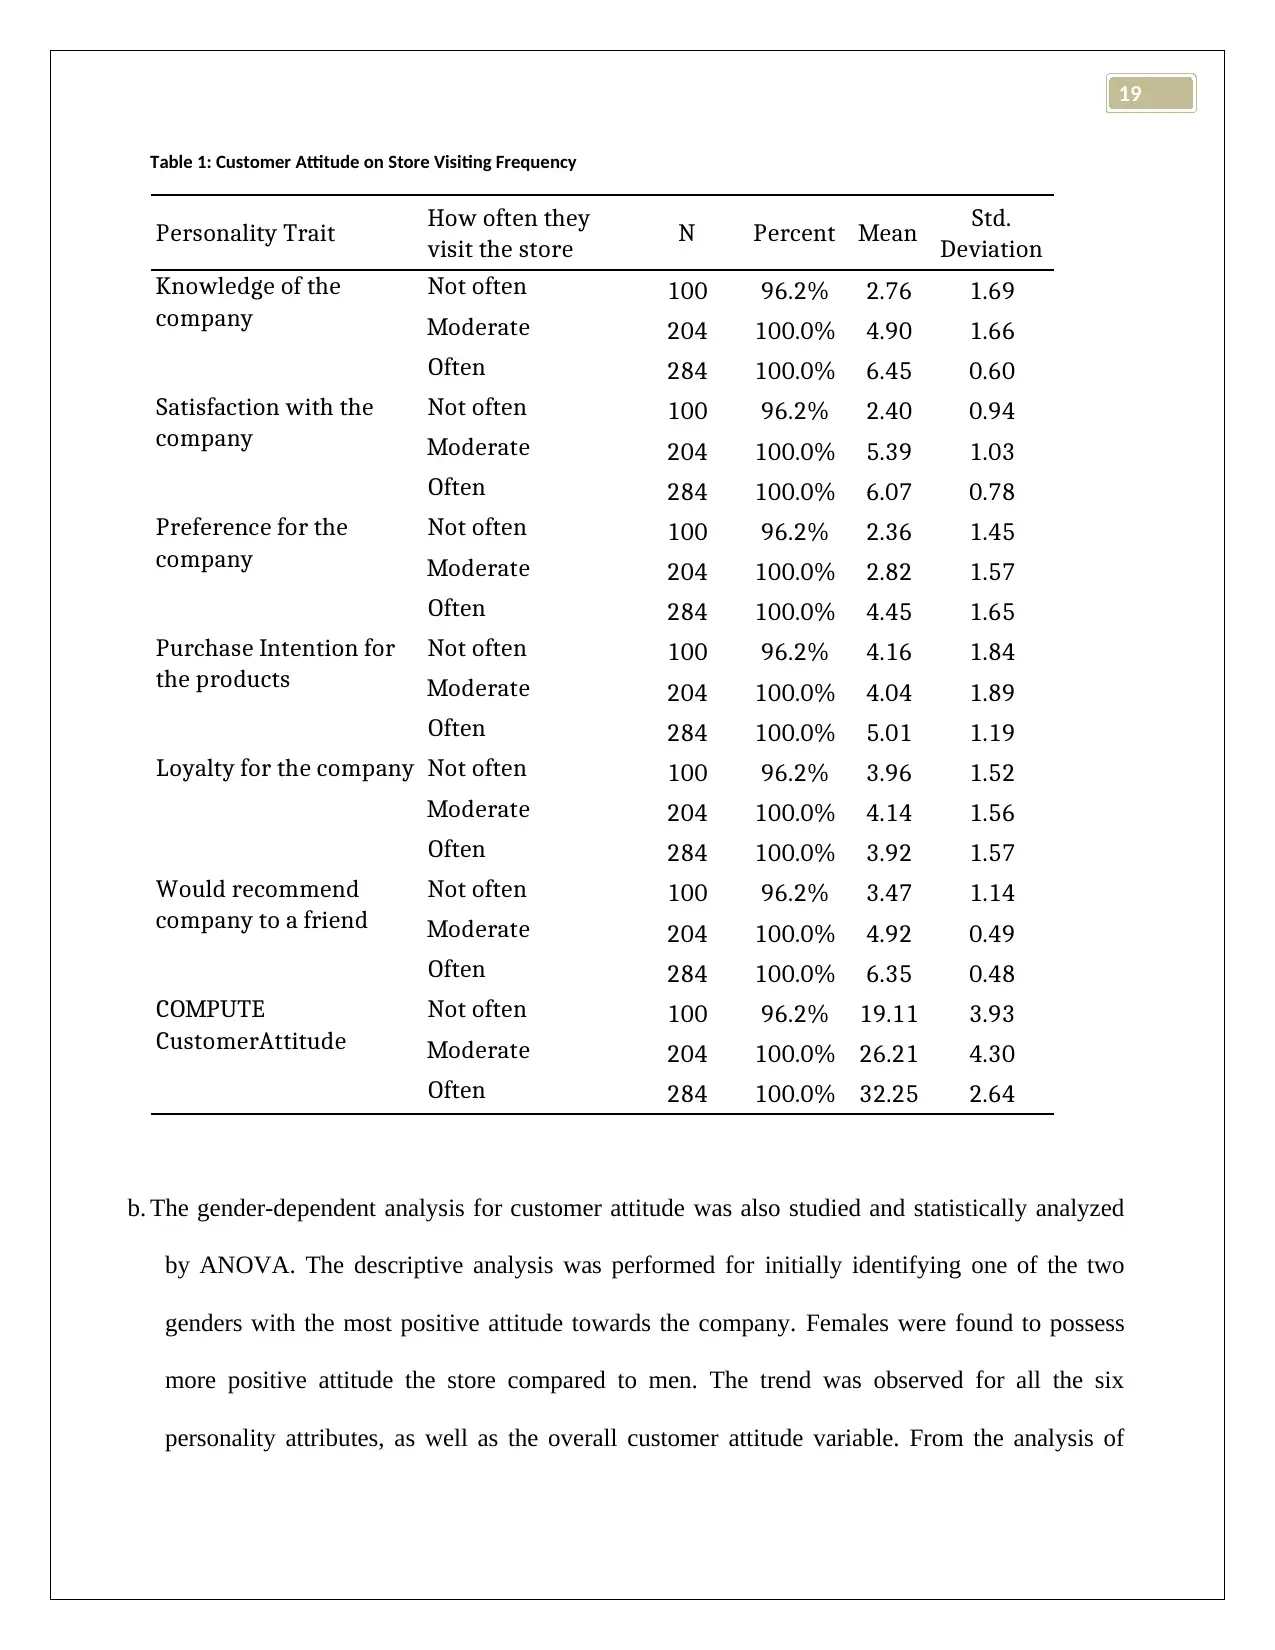
a. The customers' attitude was documented under six attributes. From these six attributes, an overall
customer attitude variable was constructed by the researcher. The descriptive analysis of average
and standard deviation for each attitude and for each type of customers was evaluated and has
been presented in Table 1. From Table 1 it was evident that often visitors were much more loyal
and the overall attitude score was also highest amongst the three groups. These claims were
statistically established by ANOVA conducted for each attitude level. There was evidence of
significant variation between the three user groups for overall customer attitude (F = 495.80, P <
0.05). Similar substantiation was noted for knowledge of the company (F= 315.40, P < 0.05),
satisfaction with the company (F = 538.03, P < 0.05), preference for the company (F = 89.97, P <
0.05), purchase intention for the products (F = 25.83, P < 0.05), and recommendation of the store
to a friend (F = 829.18, P < 0 .05) at 5% level of significance. But, interestingly, no clear user
group was identified for the loyalty for the company (F = 1.33, P =0.26).
Descriptive analysis was espoused for identifying the optimum value of the variables. Highest
and lowest categories were identified from the measure of central tendencies and visual
presentation. Inferential analyses such as paired t-test, Chi-Square test, and ANOVA have been
applied to establish the claims of descriptive analyses. Decision trees also have been utilized for
detail visual presentation for the best product for profit and COGS (Block, and Lau, 2016).
Results
Customer Attribute Analysis
a. The customers' attitude was documented under six attributes. From these six attributes, an overall
customer attitude variable was constructed by the researcher. The descriptive analysis of average
and standard deviation for each attitude and for each type of customers was evaluated and has
been presented in Table 1. From Table 1 it was evident that often visitors were much more loyal
and the overall attitude score was also highest amongst the three groups. These claims were
statistically established by ANOVA conducted for each attitude level. There was evidence of
significant variation between the three user groups for overall customer attitude (F = 495.80, P <
0.05). Similar substantiation was noted for knowledge of the company (F= 315.40, P < 0.05),
satisfaction with the company (F = 538.03, P < 0.05), preference for the company (F = 89.97, P <
0.05), purchase intention for the products (F = 25.83, P < 0.05), and recommendation of the store
to a friend (F = 829.18, P < 0 .05) at 5% level of significance. But, interestingly, no clear user
group was identified for the loyalty for the company (F = 1.33, P =0.26).
⊘ This is a preview!⊘
Do you want full access?
Subscribe today to unlock all pages.
Trusted by 1+ million students worldwide
19
Table 1: Customer Attitude on Store Visiting Frequency
Personality Trait How often they
visit the store N Percent Mean Std.
Deviation
Not often 100 96.2% 2.76 1.69
Moderate 204 100.0% 4.90 1.66
Often 284 100.0% 6.45 0.60
Not often 100 96.2% 2.40 0.94
Moderate 204 100.0% 5.39 1.03
Often 284 100.0% 6.07 0.78
Not often 100 96.2% 2.36 1.45
Moderate 204 100.0% 2.82 1.57
Often 284 100.0% 4.45 1.65
Not often 100 96.2% 4.16 1.84
Moderate 204 100.0% 4.04 1.89
Often 284 100.0% 5.01 1.19
Not often 100 96.2% 3.96 1.52
Moderate 204 100.0% 4.14 1.56
Often 284 100.0% 3.92 1.57
Not often 100 96.2% 3.47 1.14
Moderate 204 100.0% 4.92 0.49
Often 284 100.0% 6.35 0.48
Not often 100 96.2% 19.11 3.93
Moderate 204 100.0% 26.21 4.30
Often 284 100.0% 32.25 2.64
COMPUTE
CustomerAttitude
Knowledge of the
company
Satisfaction with the
company
Preference for the
company
Purchase Intention for
the products
Loyalty for the company
Would recommend
company to a friend
b. The gender-dependent analysis for customer attitude was also studied and statistically analyzed
by ANOVA. The descriptive analysis was performed for initially identifying one of the two
genders with the most positive attitude towards the company. Females were found to possess
more positive attitude the store compared to men. The trend was observed for all the six
personality attributes, as well as the overall customer attitude variable. From the analysis of
Paraphrase This Document
Need a fresh take? Get an instant paraphrase of this document with our AI Paraphraser
19
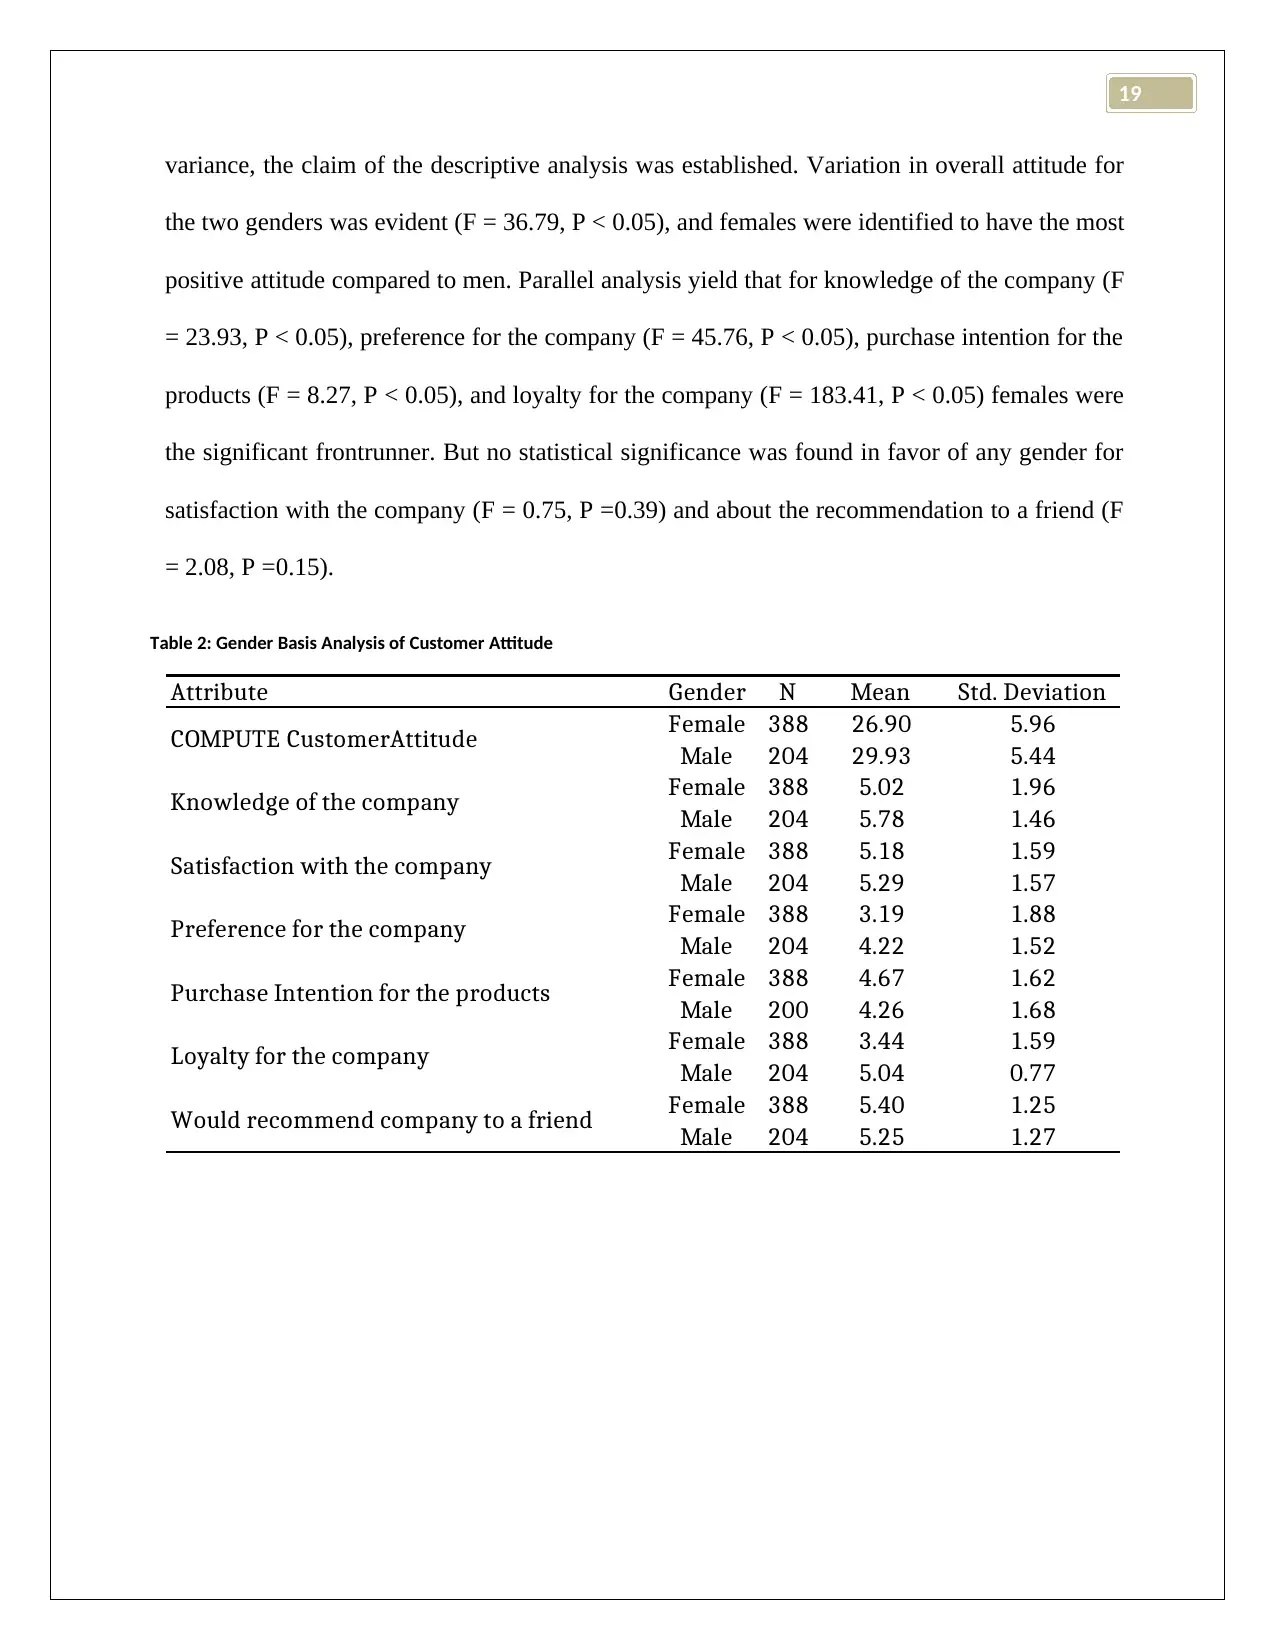
variance, the claim of the descriptive analysis was established. Variation in overall attitude for
the two genders was evident (F = 36.79, P < 0.05), and females were identified to have the most
positive attitude compared to men. Parallel analysis yield that for knowledge of the company (F
= 23.93, P < 0.05), preference for the company (F = 45.76, P < 0.05), purchase intention for the
products (F = 8.27, P < 0.05), and loyalty for the company (F = 183.41, P < 0.05) females were
the significant frontrunner. But no statistical significance was found in favor of any gender for
satisfaction with the company (F = 0.75, P =0.39) and about the recommendation to a friend (F
= 2.08, P =0.15).
Table 2: Gender Basis Analysis of Customer Attitude
Attribute Gender N Mean Std. Deviation
Female 388 26.90 5.96
Male 204 29.93 5.44
Female 388 5.02 1.96
Male 204 5.78 1.46
Female 388 5.18 1.59
Male 204 5.29 1.57
Female 388 3.19 1.88
Male 204 4.22 1.52
Female 388 4.67 1.62
Male 200 4.26 1.68
Female 388 3.44 1.59
Male 204 5.04 0.77
Female 388 5.40 1.25
Male 204 5.25 1.27
Would recommend company to a friend
COMPUTE CustomerAttitude
Knowledge of the company
Satisfaction with the company
Preference for the company
Purchase Intention for the products
Loyalty for the company
19
Profit and Cost Basis Analysis
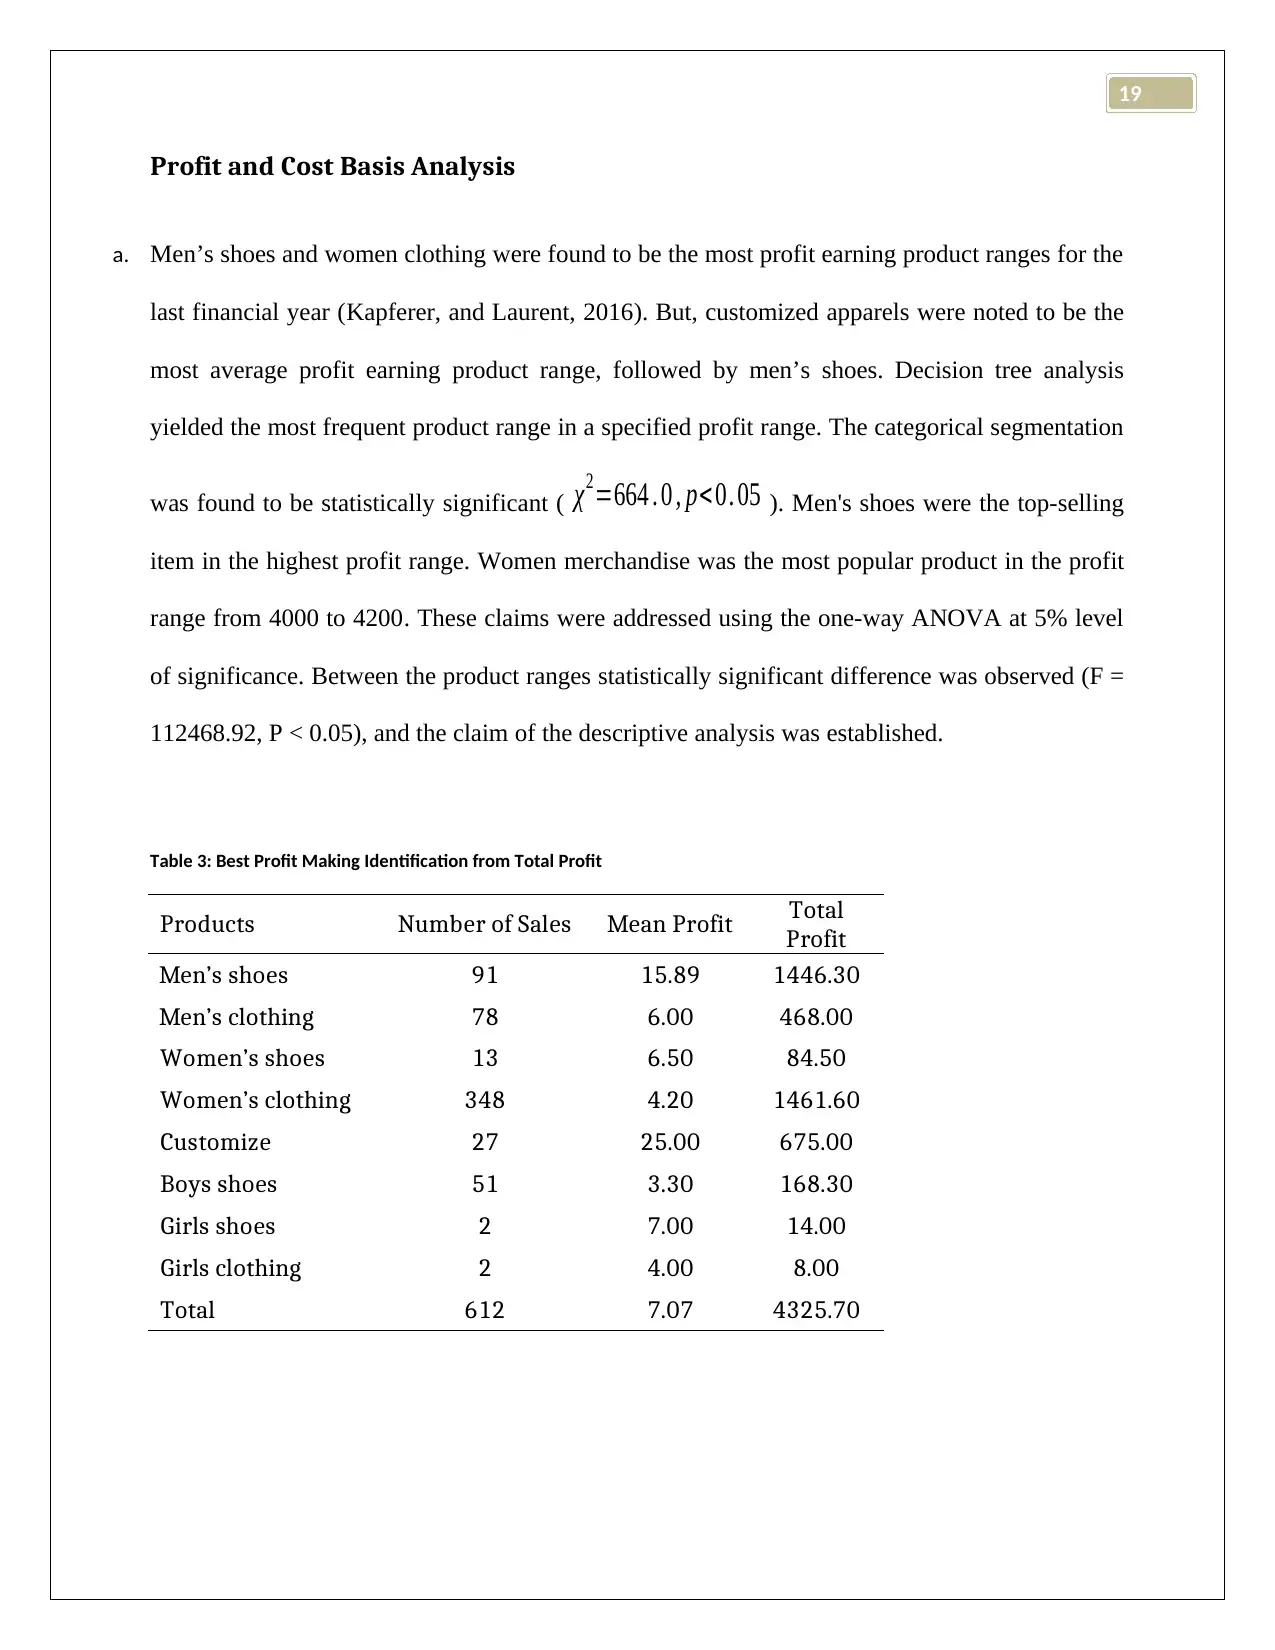
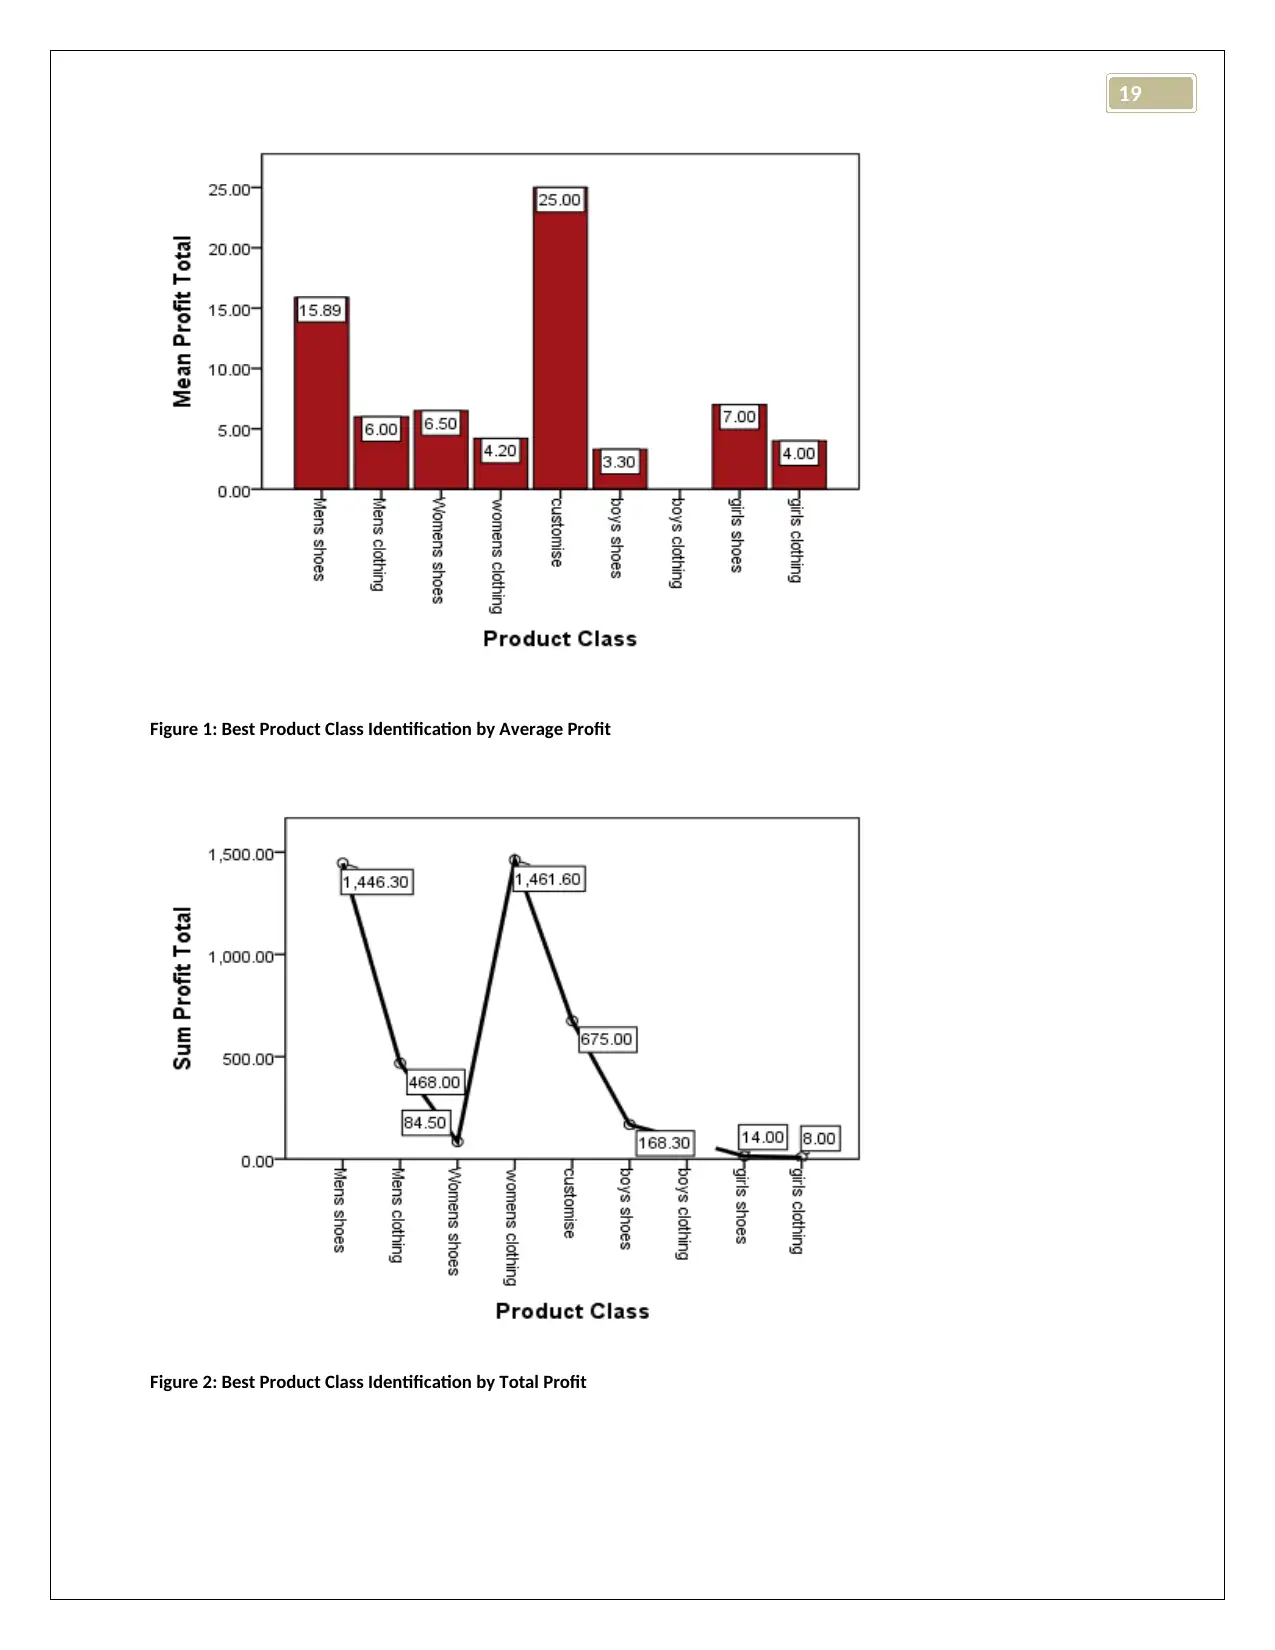
a. Men’s shoes and women clothing were found to be the most profit earning product ranges for the
last financial year (Kapferer, and Laurent, 2016). But, customized apparels were noted to be the
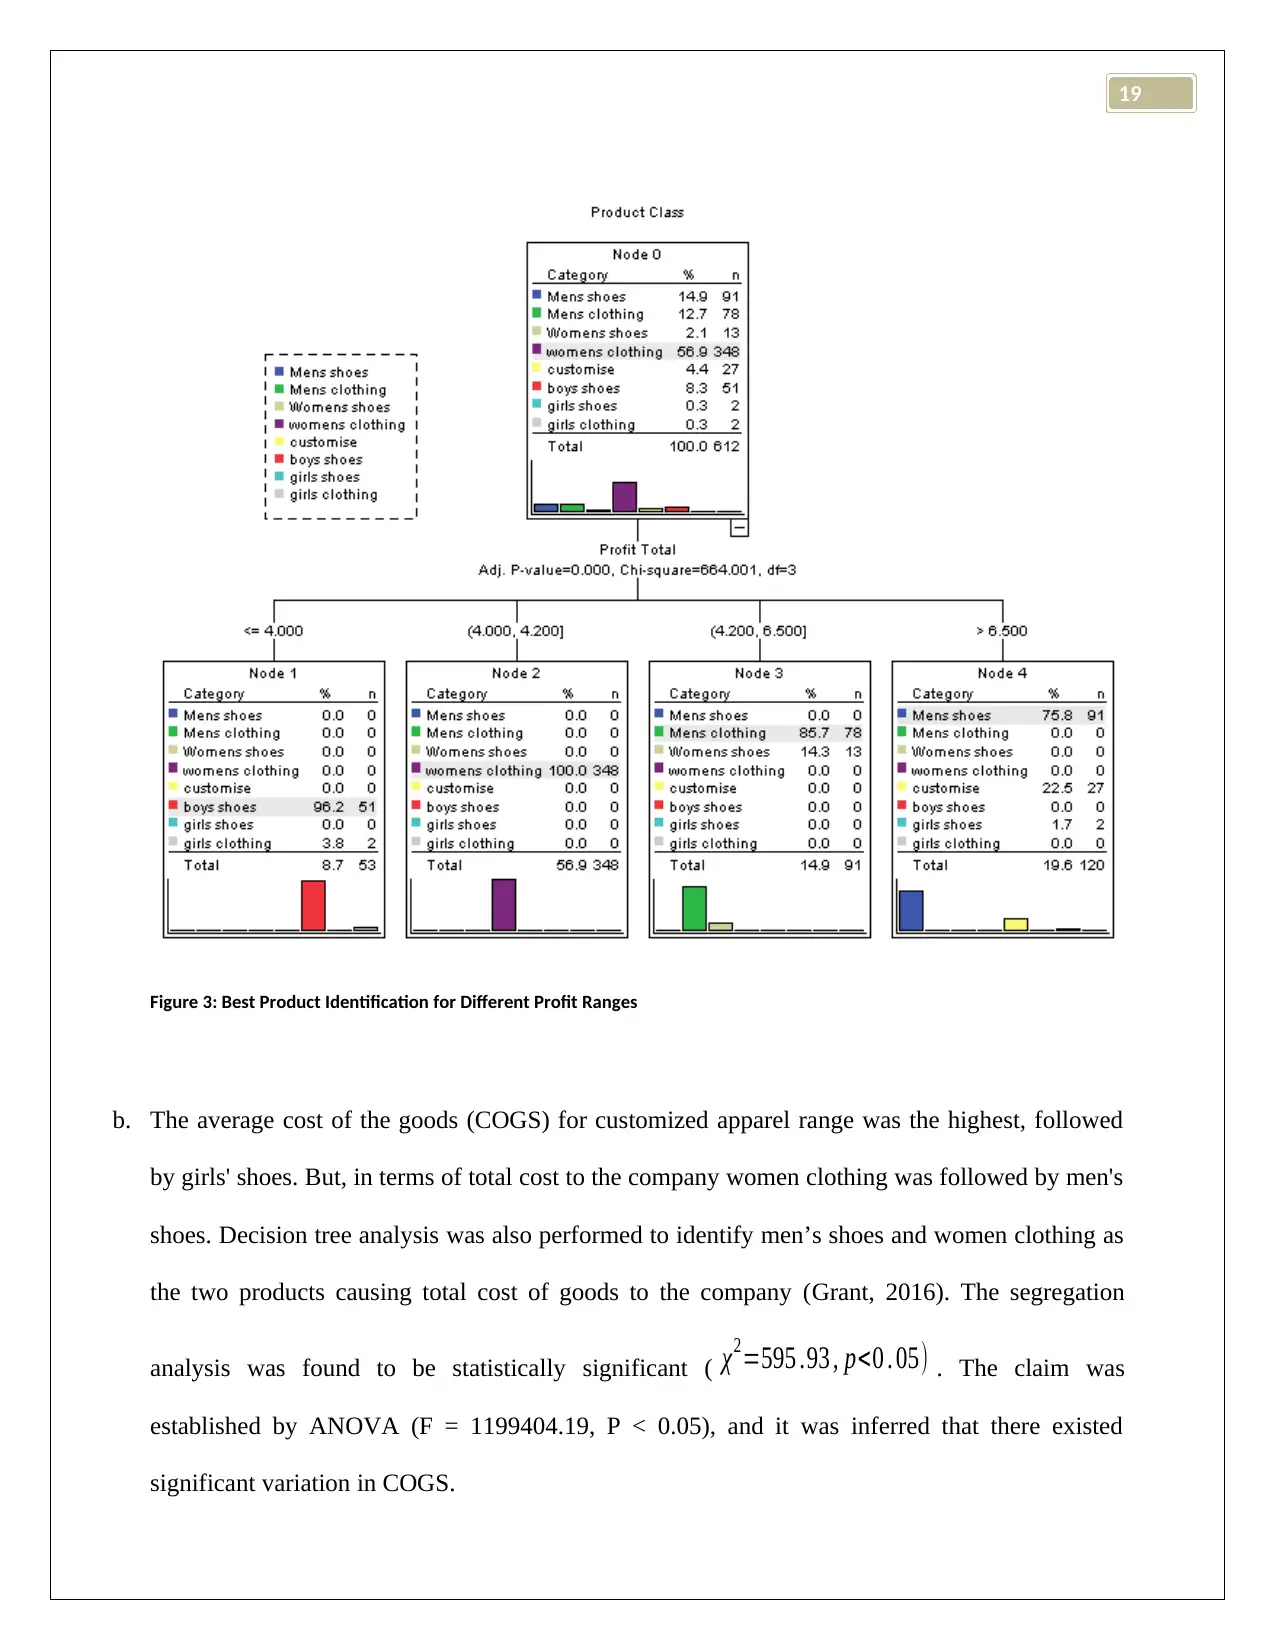
most average profit earning product range, followed by men’s shoes. Decision tree analysis
yielded the most frequent product range in a specified profit range. The categorical segmentation
was found to be statistically significant ( χ2=664 . 0 , p< 0. 05 ). Men's shoes were the top-selling
item in the highest profit range. Women merchandise was the most popular product in the profit
range from 4000 to 4200. These claims were addressed using the one-way ANOVA at 5% level
of significance. Between the product ranges statistically significant difference was observed (F =
112468.92, P < 0.05), and the claim of the descriptive analysis was established.
Table 3: Best Profit Making Identification from Total Profit
Products Number of Sales Mean Profit Total
Profit
Men’s shoes 91 15.89 1446.30
Men’s clothing 78 6.00 468.00
Women’s shoes 13 6.50 84.50
Women’s clothing 348 4.20 1461.60
Customize 27 25.00 675.00
Boys shoes 51 3.30 168.30
Girls shoes 2 7.00 14.00
Girls clothing 2 4.00 8.00
Total 612 7.07 4325.70
Profit and Cost Basis Analysis
a. Men’s shoes and women clothing were found to be the most profit earning product ranges for the
last financial year (Kapferer, and Laurent, 2016). But, customized apparels were noted to be the
most average profit earning product range, followed by men’s shoes. Decision tree analysis
yielded the most frequent product range in a specified profit range. The categorical segmentation
was found to be statistically significant ( χ2=664 . 0 , p< 0. 05 ). Men's shoes were the top-selling
item in the highest profit range. Women merchandise was the most popular product in the profit
range from 4000 to 4200. These claims were addressed using the one-way ANOVA at 5% level
of significance. Between the product ranges statistically significant difference was observed (F =
112468.92, P < 0.05), and the claim of the descriptive analysis was established.
Table 3: Best Profit Making Identification from Total Profit
Products Number of Sales Mean Profit Total
Profit
Men’s shoes 91 15.89 1446.30
Men’s clothing 78 6.00 468.00
Women’s shoes 13 6.50 84.50
Women’s clothing 348 4.20 1461.60
Customize 27 25.00 675.00
Boys shoes 51 3.30 168.30
Girls shoes 2 7.00 14.00
Girls clothing 2 4.00 8.00
Total 612 7.07 4325.70
⊘ This is a preview!⊘
Do you want full access?
Subscribe today to unlock all pages.
Trusted by 1+ million students worldwide
19
Figure 1: Best Product Class Identification by Average Profit
Figure 2: Best Product Class Identification by Total Profit
Figure 1: Best Product Class Identification by Average Profit
Figure 2: Best Product Class Identification by Total Profit
Paraphrase This Document
Need a fresh take? Get an instant paraphrase of this document with our AI Paraphraser
19
Figure 3: Best Product Identification for Different Profit Ranges
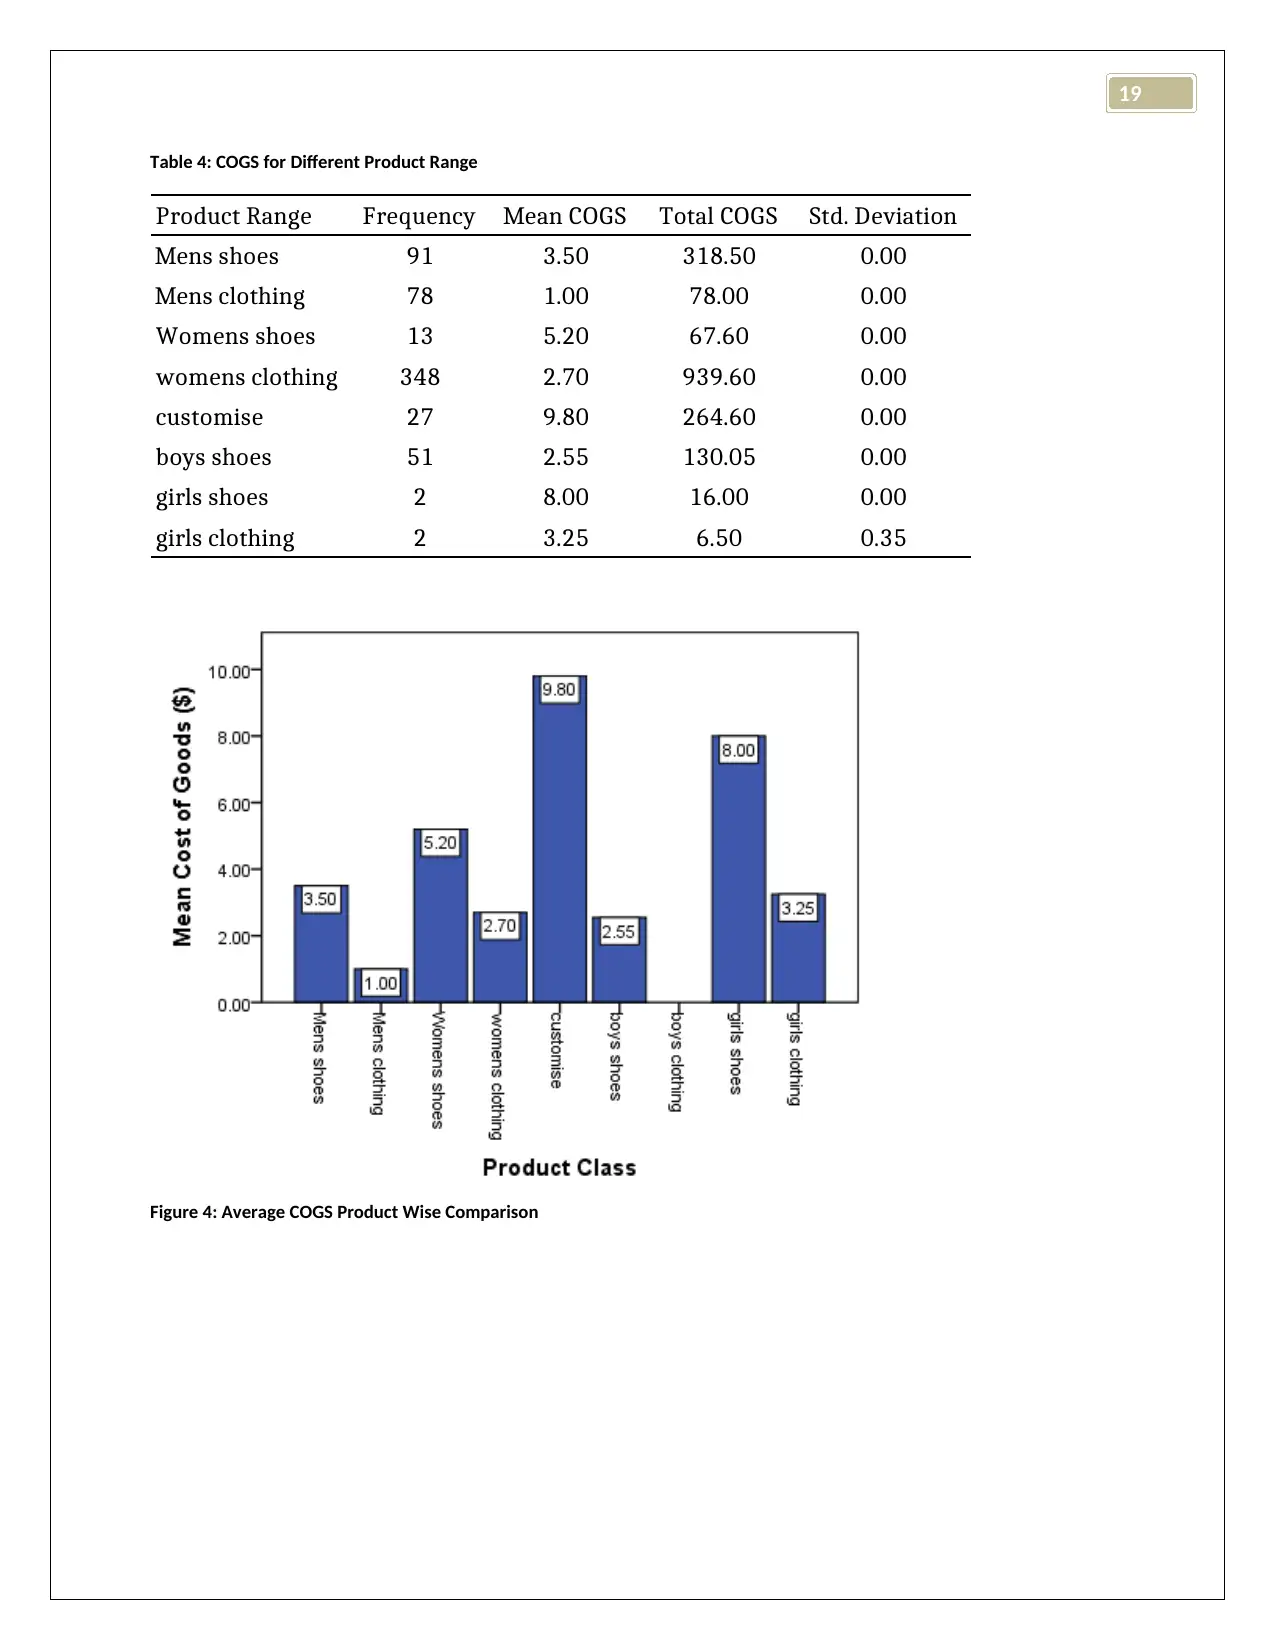
b. The average cost of the goods (COGS) for customized apparel range was the highest, followed
by girls' shoes. But, in terms of total cost to the company women clothing was followed by men's
shoes. Decision tree analysis was also performed to identify men’s shoes and women clothing as
the two products causing total cost of goods to the company (Grant, 2016). The segregation
analysis was found to be statistically significant ( χ2=595 .93 , p<0 . 05) . The claim was
established by ANOVA (F = 1199404.19, P < 0.05), and it was inferred that there existed
significant variation in COGS.
Figure 3: Best Product Identification for Different Profit Ranges
b. The average cost of the goods (COGS) for customized apparel range was the highest, followed
by girls' shoes. But, in terms of total cost to the company women clothing was followed by men's
shoes. Decision tree analysis was also performed to identify men’s shoes and women clothing as
the two products causing total cost of goods to the company (Grant, 2016). The segregation
analysis was found to be statistically significant ( χ2=595 .93 , p<0 . 05) . The claim was
established by ANOVA (F = 1199404.19, P < 0.05), and it was inferred that there existed
significant variation in COGS.
19
Table 4: COGS for Different Product Range
Product Range Frequency Mean COGS Total COGS Std. Deviation
Mens shoes 91 3.50 318.50 0.00
Mens clothing 78 1.00 78.00 0.00
Womens shoes 13 5.20 67.60 0.00
womens clothing 348 2.70 939.60 0.00
customise 27 9.80 264.60 0.00
boys shoes 51 2.55 130.05 0.00
girls shoes 2 8.00 16.00 0.00
girls clothing 2 3.25 6.50 0.35
Figure 4: Average COGS Product Wise Comparison
⊘ This is a preview!⊘
Do you want full access?
Subscribe today to unlock all pages.
Trusted by 1+ million students worldwide
1 out of 19
Related Documents


Your All-in-One AI-Powered Toolkit for Academic Success.
+13062052269
info@desklib.com
Available 24*7 on WhatsApp / Email
![[object Object]](/_next/static/media/star-bottom.7253800d.svg)
Unlock your academic potential
Copyright © 2020–2026 A2Z Services. All Rights Reserved. Developed and managed by ZUCOL.