Retail Sales Data Analysis: Forecasting, Insights, and Trends Report
VerifiedAdded on 2023/01/09
|17
|4320
|60
Report
AI Summary
This report, titled 'Analytics for Managers Assessment 2: Analysis Report,' delves into the analysis of retail sales data, utilizing a supermarket dataset to address three key problems: sales analysis and forecasting, customer engagement insights, and retail sales classification. The report employs data-driven techniques such as regression analysis, cluster analysis, and sales trend analysis with visual aids to solve these problems. Regression analysis is implemented to solve sales forecasting issues, while cluster analysis is used for customer engagement insights, and sales trend analysis is employed for visual representation of the data. The report justifies the techniques used and provides recommendations for their implementation, including how to enhance decision-making for managers in the retail sector. The report uses Microsoft Excel and R Studio to analyze the data and presents findings to improve strategic decisions and understand market trends. The ultimate goal is to help managers grasp industry environments, predict demand trends, and mitigate risks within the retail industry.
ANALYTICS FOR MANAGERS
ASSESSMENT 2 : ANALYSIS
REPORT
ASSESSMENT 2 : ANALYSIS
REPORT
Paraphrase This Document
Need a fresh take? Get an instant paraphrase of this document with our AI Paraphraser
TABLE OF CONTENTS
TABLE OF CONTENTS................................................................................................................2
1.Introduction...................................................................................................................................1
1.1 Supermarket Dataset..............................................................................................................2
2. Three problems in the retail sales datasets..................................................................................4
2.1 Sales Analysis and Forecast...................................................................................................4
2.2 Insights of customer engagement in various industries.........................................................5
2.3 Retail Sales Classification.....................................................................................................6
3. Data driven techniques for resolving three problems of retail sales data....................................7
3.1 Regression Analysis for solving sales analysis and forecasting............................................7
3.2 Cluster Analysis for solving customer engagement in retail industry...................................7
3.3 Sales Trend Analysis and the Visual Analysis......................................................................8
4. Justification and Recommendations............................................................................................8
4.1 Implementation of the Regression Analysis..........................................................................8
4.2 Implementation of the Cluster Analysis..............................................................................10
4.3 Implementation of the Sales trend analysis and the Visual analysis...................................11
Conclusion.....................................................................................................................................13
REFERENCES..............................................................................................................................15
1.Introduction
In each area of management significant amount of the data are gathered and generated and
used in different forms for taking decisions and giving insights to the users. Intrinsic business
analysis could be defined as the tools, competencies, methods for the iterative analysis. Also,
reviews previous results of the industry for obtaining higher insights and improving the strategies
and procedures. It helps the management to decide about the database that are relevant and
important for decisions and how they could be manipulate for resolving the challenges and
improving competitiveness, performance and the sales. Efficient and effective business analytics
is dependent over the reliability of information and data, market and technical understanding of
the experts and analysts and the organisational commitments using analytics for deriving insights
for facilitating the strategic decisions.
According to Edwards & et.al., (2017) where market objective of analysis is researched and
identified, analysis methodology is framed and the information is compiled for validating
research. Management of data also includes processing, downloading and the update to new and
regular services inclusive of the centralised database. Thus computational approach varies from
the realistic mathematical tables to the sophisticated analysis as well as applications of predictive
simulation. Business analytics is therefore said to be prescriptive method where data could be
gathered, different patterns recognised and the models designed for describing the recent events,
forecasting future events and the also suggest steps for maximising outcomes.
Present report illustrates the potential data driven methods to selected data for addressing the
associated with the decision making process of the managers that helps the managers and
company executives in grasping the industry environment, predicting demand trends and
mitigating risks. Understanding the industry trends are very essential for the companies before
taking strategic decisions and planning for the future demand and productions. For effective
decision making regarding the sector in supermarket industry that are performing well and those
showing negative trend (Robertson & et.al., (2017). Report will provide datasets used in the
report, 3 data problems that are uncovered from dataset and methodology employed for
processing and extracting required insights from data with justification and evaluation of the
techniques used and the recommendations.
1
⊘ This is a preview!⊘
Do you want full access?
Subscribe today to unlock all pages.
Trusted by 1+ million students worldwide
1.1 Supermarket Dataset
The report uses information of actual retail sales values by the quarter by industry, actual
sales by geographical region and seasonally adjusted retail sales value by the industry. For
research and study sales of retail market industry is taken. Data is of three quarters for three
years of retail sales in different industries. Data consists of all the retail goods that are sold in the
country of various industries such as groceries, electronic goods, food and beverage, recreational
goods, clothing footwear, personal accessories, accommodation and many more. Data will help
the managers for analysing sales forecasts, customer engagement insights as well as trending
consumer goods for improving sales challenges by using business analytics. Below table shows
the information about actual sales in retail industry of 3 quarters.
Present report will be illustrating how data driven techniques could be applied in the business
analytics using software like Microsoft excel which is spreadsheet. It is used for making
statistical graphs and computation for implicating the results before final recommendations and
conclusion.
2. Three problems in the retail sales datasets
Advancement of the business analytics allows retailers for drawing large volumes of the
consumer data that helps them in developing customised goods and contributing to maintain
customer loyalty by data mining. Section provides different sale problems in retail industry sales.
2.1 Sales Analysis and Forecast
Sales forecasts and analysis is method used for making predictions for potential demands
where the reliable predictions enable the companies in making smarter decisions of the business
and forecasting performance over short term and long term. It enables the managers to identify
how companies could handle the workforce, cash flows and finances. It also allows retailers in
minimising impact of measures like cutting expenses and reorienting market activities by taking
advanced steps.
Challenging part in present database is of analysing customer sales in retail market in
specific industry type, seasonal sales and sales by geographical region as all data is randomly
distributed locating the particulars in spreadsheet from the data providers take considerable time,
translating information and storing all data in spreadsheet. With all buzz providing the precise
measurements as well as interpretations without making expensive errors or mistakes are
2
Paraphrase This Document
Need a fresh take? Get an instant paraphrase of this document with our AI Paraphraser
complicated and methods & processes for forecasting sales is prone to the errors and results are
unsatisfactory often (Southwick & et.al.,( 2018). Technique of regression analysis is used in
excel for resolving the issues that could appropriately provide data about the specific industries
for finding sales forecast.
When retail industries are mailing sales they are also required to go into further details
regarding customer expectations, interests and the possible challenges in the specific retail
industry. This will enable the managers to identify the industry in which they could expand their
business where they are planning to diversify from or along with present business. Retailers and
managers are also required to understand the seasonality of demand and the demand of products
by geographic regions.
Mostly companies face difficulties to achieve practical and precise revenue projections as
they are not having clarity in the revenues from different industries and values. Companies use
inaccurate and unreliable institution based methods of forecasting which leads to poor results to
decide the concerned market industry. Due to this, data precisions are skewed in business
industries and actual revenues are varying from the targeted levels (Weaver, (2016). Data
analytics is used by the organisations for understanding the market trends of different retail
industries for deciding about industry to expand in.
2.2 Insights of customer engagement in various industries.
Knowledge of the market is very important for understanding target audiences as well as
efficiently engaging with the customers. This could be extended over wide range of the
circumstances from beginning new company or the product field to reposition the existing
business or the products from daily planning of the potential developments in market of
development. For using interactions as critical measure of the conduct, firms are required to
connect customer preferences with shifts towards new products to bottom line.
Current datasets are not providing information regarding the industry segmentation like
low, high or medium valued based over geographical locations that could be beneficial in the
customer engagement. Segmentation of the sales refers to process of segregating retail sales into
different categories reflecting consistency of the trend in each industry. Current percentage
change and industry segment is difficult as data processing & maintenance is time consuming
process and also opens door for human errors. Ability of collaborating in excel is also limited as
3
function by multiple users is not permitted concurrently in same row (Rychert & Wilkins,
(2016). It also do not provide about specific industry up sell possibilities. Clustering the data
driven methods using R Studio will mitigate the issue.
Objective behind segmenting the retail industry is of gaining knowledge about the industry
that is showing positive trend and generating increased revenues so that company could
determine about industry to expand in. It will enable the company to frame strategies customers
of particular industry of the market. Results and trends of the sales could also be measured over
time. Comparison could also be made for identifying most successful and growing industry in
the retail sector for making promotions for select customer groups. For instance, if the
supermarkets and groceries market is growing and increasing its market share, company would
be focusing over particular segment of the customers of specific industry. Company will expand
in specific industry and put its efforts and resources to generate sales from that particular
industry sector (Rychert & Wilkins, (2019). They can then seek for different products that could
be sold by the company. It is essential for the company to identify the correct industry in which
to expand based on the geographic location of the company.
Though goal of the company is of optimizing the benefits and profits of company as well
as customers, it is important for company to identify in advance about how the specific
marketing activities will be influencing industries that could not be derived from current dataset
as retails industries are not segmented correctly. Due to this managers will be making choices
based over old knowledge that leads to disappointed consumers as well as bad returns and it
leads to the unsuccessful and inefficient marketing process.
2.3 Retail Sales Classification
As per Bahl & Attanayake, ( 2018) FMCG have lower shelf life as they are perishable and
strong competition from customers. Electronic goods are having higher life and also used over
longer time. FMCG items are generally consumed, imported, low priced and sold in the large
quantities and their turnovers are generally high. Electronic goods are also used and imported but
in small quantities with lower units turnover and higher in value turnover as these goods are high
priced. In current datasets, electronic, departmental stores, grocery stores, food and beverages,
pharmaceuticals, hardware, liquor retailing, accommodation, motor vehicle and fuel retailing but
it is difficult to understand about the industry that is growing highly.
4
⊘ This is a preview!⊘
Do you want full access?
Subscribe today to unlock all pages.
Trusted by 1+ million students worldwide
In FMCG market data are highly relevant due to lower profit margins to maintain customers
and attracting new businesses. For doing so companies are required to reach and consider their
customer related to specific industry. Retail analytics provides comprehensive consumer
experience and visibility into operations of organisation in present sales dataset about which
industry line is moving and growing fast (Retail Sales Industry, (2019). Supermarket would be
insufficient in knowing products and services that could dissatisfy the customers when demands
are not fulfilled.
3. Data driven techniques for resolving three problems of retail sales data
Data driven methods are defined as advancement in operations that are compelled by the
data instead of personal perceptions and knowledge. It encourages organisations to coordinate
and analyse their data for representing the retail sales and industries best. Following points
would be describing data driven methods that could be used for sales dataset problems.
3.1 Regression Analysis for solving sales analysis and forecasting
It is an aggregation of the mathematical technique used for forecasting the relationship
between control dependency and independent variables. Technique is used for forecasting time
series and evaluating relationship between casual effects of the variables. It helps in analysing
impact of the observable factors over different scales like influences of the price increase and
number of advertising events (Williams & Taylor, ( 2018). It assists market analysis and business
experts to extract and determine right selection of the variables used for constructing statistical
models.
Forecasting and sales analysis issues could be resolved using regression analysis. firms are
continuously seeking for improving the statistical capabilities for jumping over rivals. For
example a forecasting model helps companies in keeping right inventory levels for meeting
product demand accurately. Regression analysis provides guidance to evaluate economic
measures with strong predictive potentials. Regression approximate influence that series of the
independent variables are having over other variables by quantifying it in single equation.
Currently, regression analysis everyone to assess the factors are most necessary and which
variable could be overlooked. Benefits of the regression in sales forecasting in retail industry will
encourage marketers in crunching numbers and making smarter choice about the industry at
present and in future.
5
Paraphrase This Document
Need a fresh take? Get an instant paraphrase of this document with our AI Paraphraser
3.2 Cluster Analysis for solving customer engagement in retail industry
It is also known as cluster analysis that is crucial in the data mining. Function of clustering
is of grouping objects collection in a manner that objects in same category are identical than the
objects of other class. Cluster analysis is the exploratory study which attempts for identifying
data structures and are recorded as taxonomy study and segmentation (Retail Sale, (2019). If
classification is historically not established it will classify the homogenous classes of the
instances.
Consequently insights of customer engagement could be solved using the cluster analysis.
it involves use of statistical model in context of the consumer segmentation for discovering
clusters of the related consumers that focus to discover every smallest difference in the
customers in each industry. Objective of marketing cluster analysis is of classifying the
customers for classifying customers more efficiently the customer targeting by personalisation.
3.3 Sales Trend Analysis and the Visual Analysis
It is analysis of past turnover for finding trends and change. It is valuable form of financial
forecasting and budgeting which shown starting of the improvements in near term sales growth
model of company. Sales analysis is convenient way of tracking progress in current sales while
recognising the pattern of sales in particular industry for specific consumers, industries and
geographies. Sales trend analysis could be conducted for solving issue of classification (D'mello
& Saadeh, (2018).
Other approach of solving sales classification is using the visual analysis that consists of
graphical representation. It is the outgrowth of fields of the knowledge visualisation and the
scientific visualisation that is focused over critical thought for the interactive data interface.
Visual analysis provides the management to identify about all the high and lows of different
sectors for making advanced decisions about the sector to be invested.
4. Justification and Recommendations
Below mentioned points will describe implementation of data driven methods for solving
the sales challenge using the business analytics
4.1 Implementation of the Regression Analysis
Following table shows outcomes from regression analysis on implementing data in excel
for solving sales analysis and to forecast the problem
Regression analysis of Actual Value
6
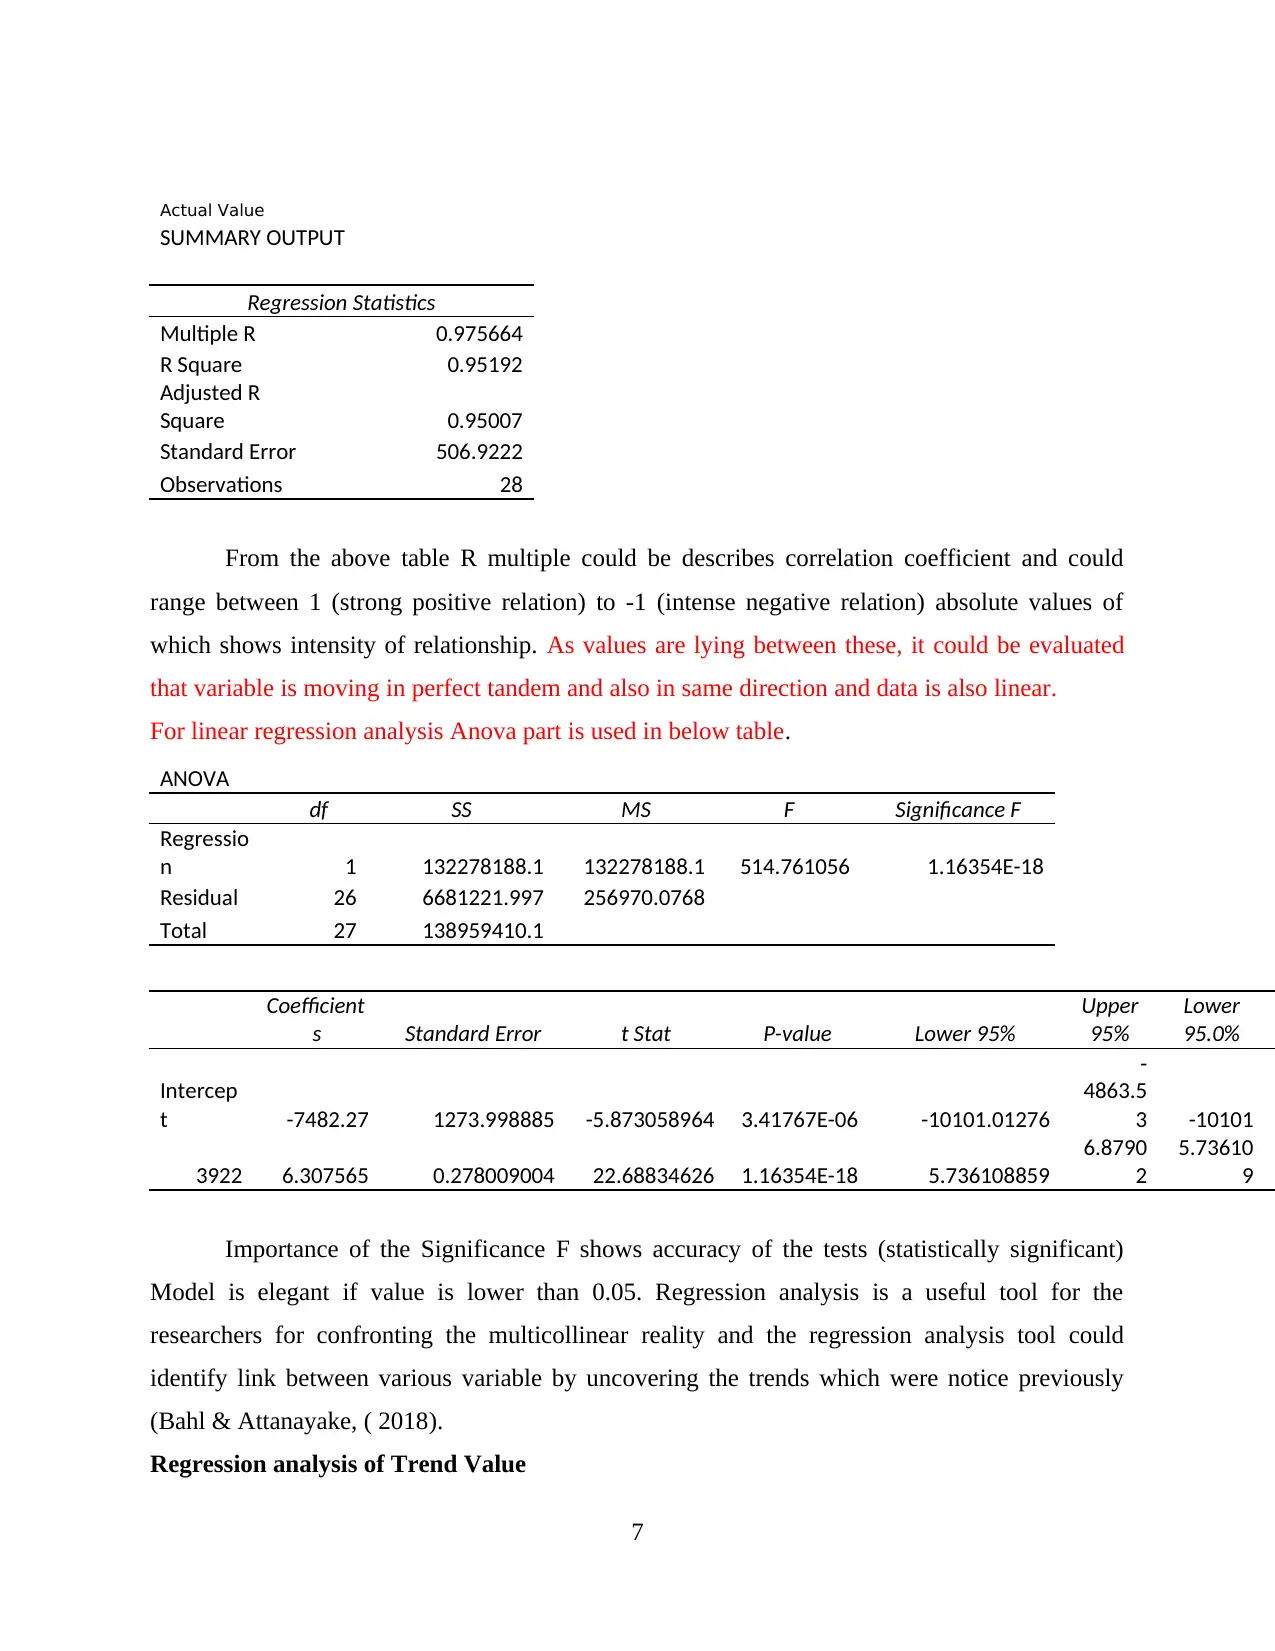
Actual Value
SUMMARY OUTPUT
Regression Statistics
Multiple R 0.975664
R Square 0.95192
Adjusted R
Square 0.95007
Standard Error 506.9222
Observations 28
From the above table R multiple could be describes correlation coefficient and could
range between 1 (strong positive relation) to -1 (intense negative relation) absolute values of
which shows intensity of relationship. As values are lying between these, it could be evaluated
that variable is moving in perfect tandem and also in same direction and data is also linear.
For linear regression analysis Anova part is used in below table.
ANOVA
df SS MS F Significance F
Regressio
n 1 132278188.1 132278188.1 514.761056 1.16354E-18
Residual 26 6681221.997 256970.0768
Total 27 138959410.1
Coefficient
s Standard Error t Stat P-value Lower 95%
Upper
95%
Lower
95.0%
Intercep
t -7482.27 1273.998885 -5.873058964 3.41767E-06 -10101.01276
-
4863.5
3 -10101
3922 6.307565 0.278009004 22.68834626 1.16354E-18 5.736108859
6.8790
2
5.73610
9
Importance of the Significance F shows accuracy of the tests (statistically significant)
Model is elegant if value is lower than 0.05. Regression analysis is a useful tool for the
researchers for confronting the multicollinear reality and the regression analysis tool could
identify link between various variable by uncovering the trends which were notice previously
(Bahl & Attanayake, ( 2018).
Regression analysis of Trend Value
7
⊘ This is a preview!⊘
Do you want full access?
Subscribe today to unlock all pages.
Trusted by 1+ million students worldwide
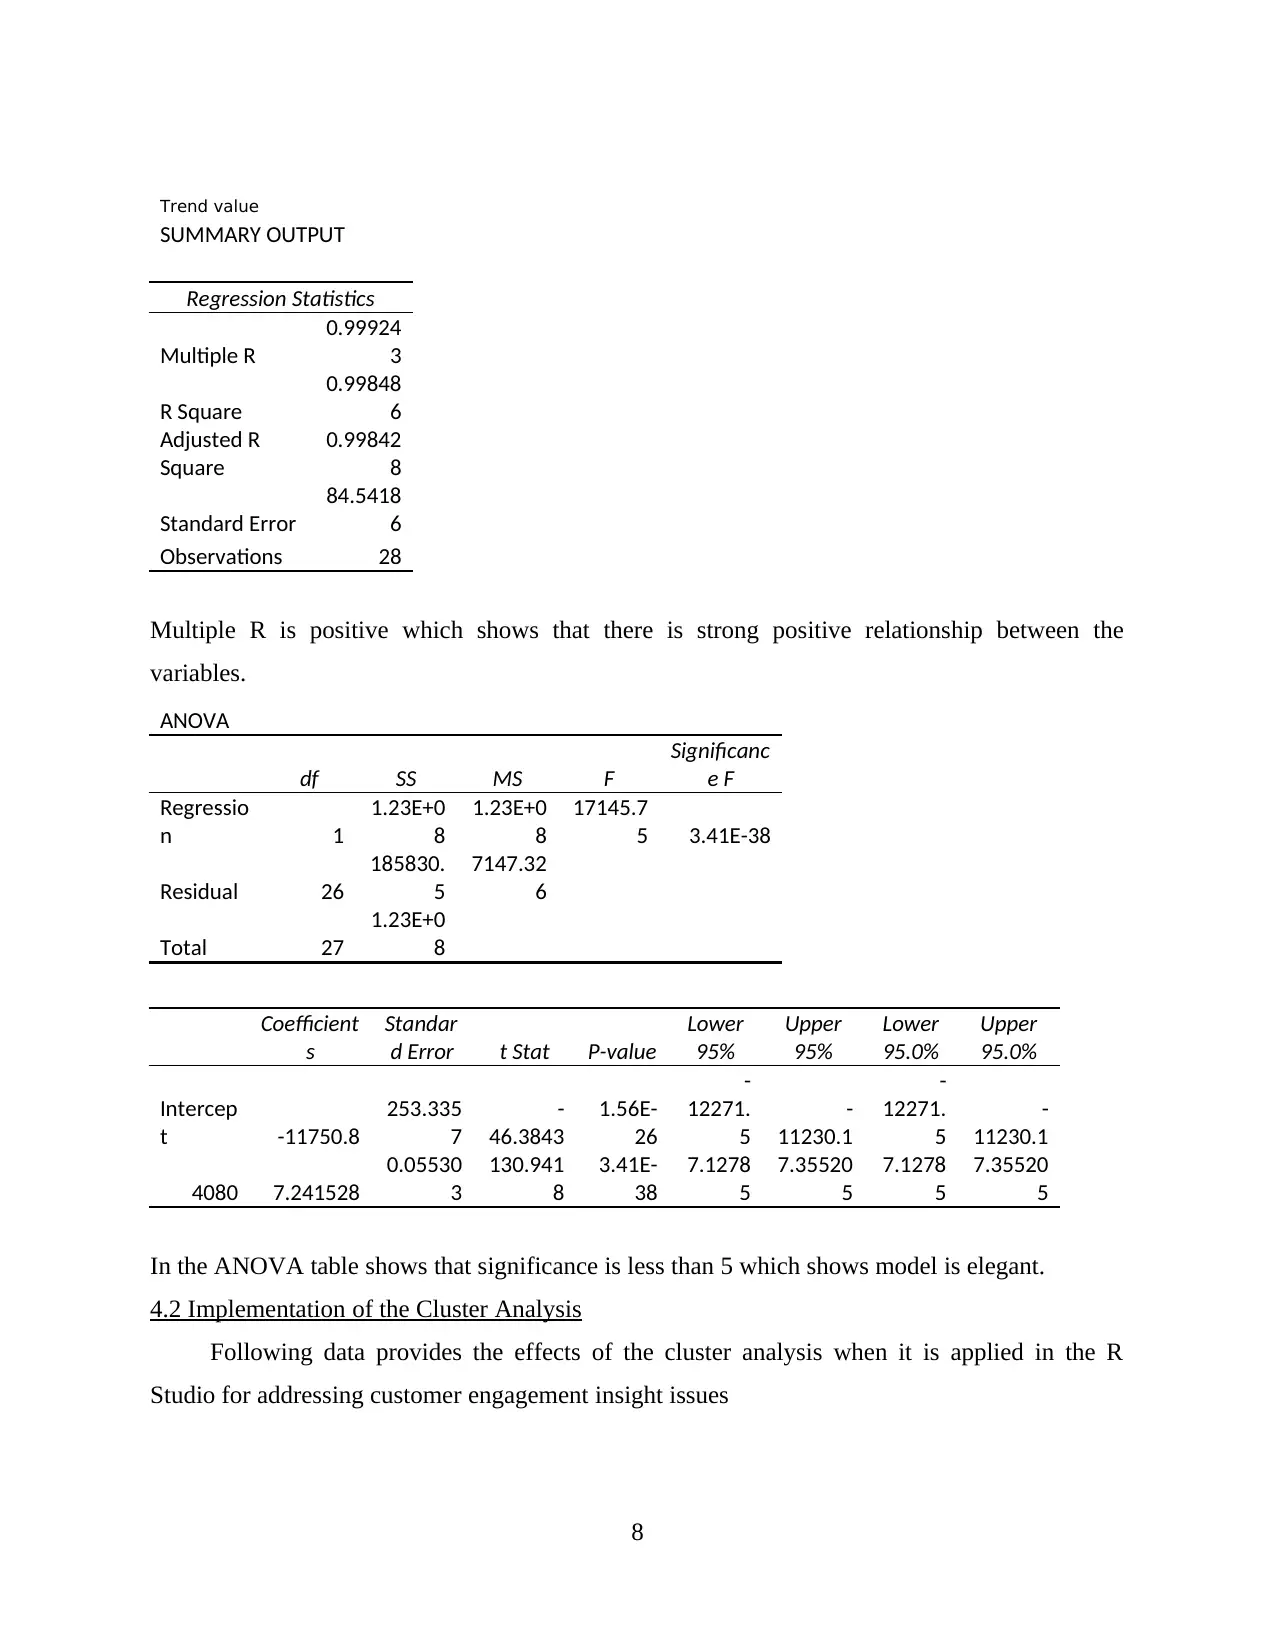
Trend value
SUMMARY OUTPUT
Regression Statistics
Multiple R
0.99924
3
R Square
0.99848
6
Adjusted R
Square
0.99842
8
Standard Error
84.5418
6
Observations 28
Multiple R is positive which shows that there is strong positive relationship between the
variables.
ANOVA
df SS MS F
Significanc
e F
Regressio
n 1
1.23E+0
8
1.23E+0
8
17145.7
5 3.41E-38
Residual 26
185830.
5
7147.32
6
Total 27
1.23E+0
8
Coefficient
s
Standar
d Error t Stat P-value
Lower
95%
Upper
95%
Lower
95.0%
Upper
95.0%
Intercep
t -11750.8
253.335
7
-
46.3843
1.56E-
26
-
12271.
5
-
11230.1
-
12271.
5
-
11230.1
4080 7.241528
0.05530
3
130.941
8
3.41E-
38
7.1278
5
7.35520
5
7.1278
5
7.35520
5
In the ANOVA table shows that significance is less than 5 which shows model is elegant.
4.2 Implementation of the Cluster Analysis
Following data provides the effects of the cluster analysis when it is applied in the R
Studio for addressing customer engagement insight issues
8
Paraphrase This Document
Need a fresh take? Get an instant paraphrase of this document with our AI Paraphraser
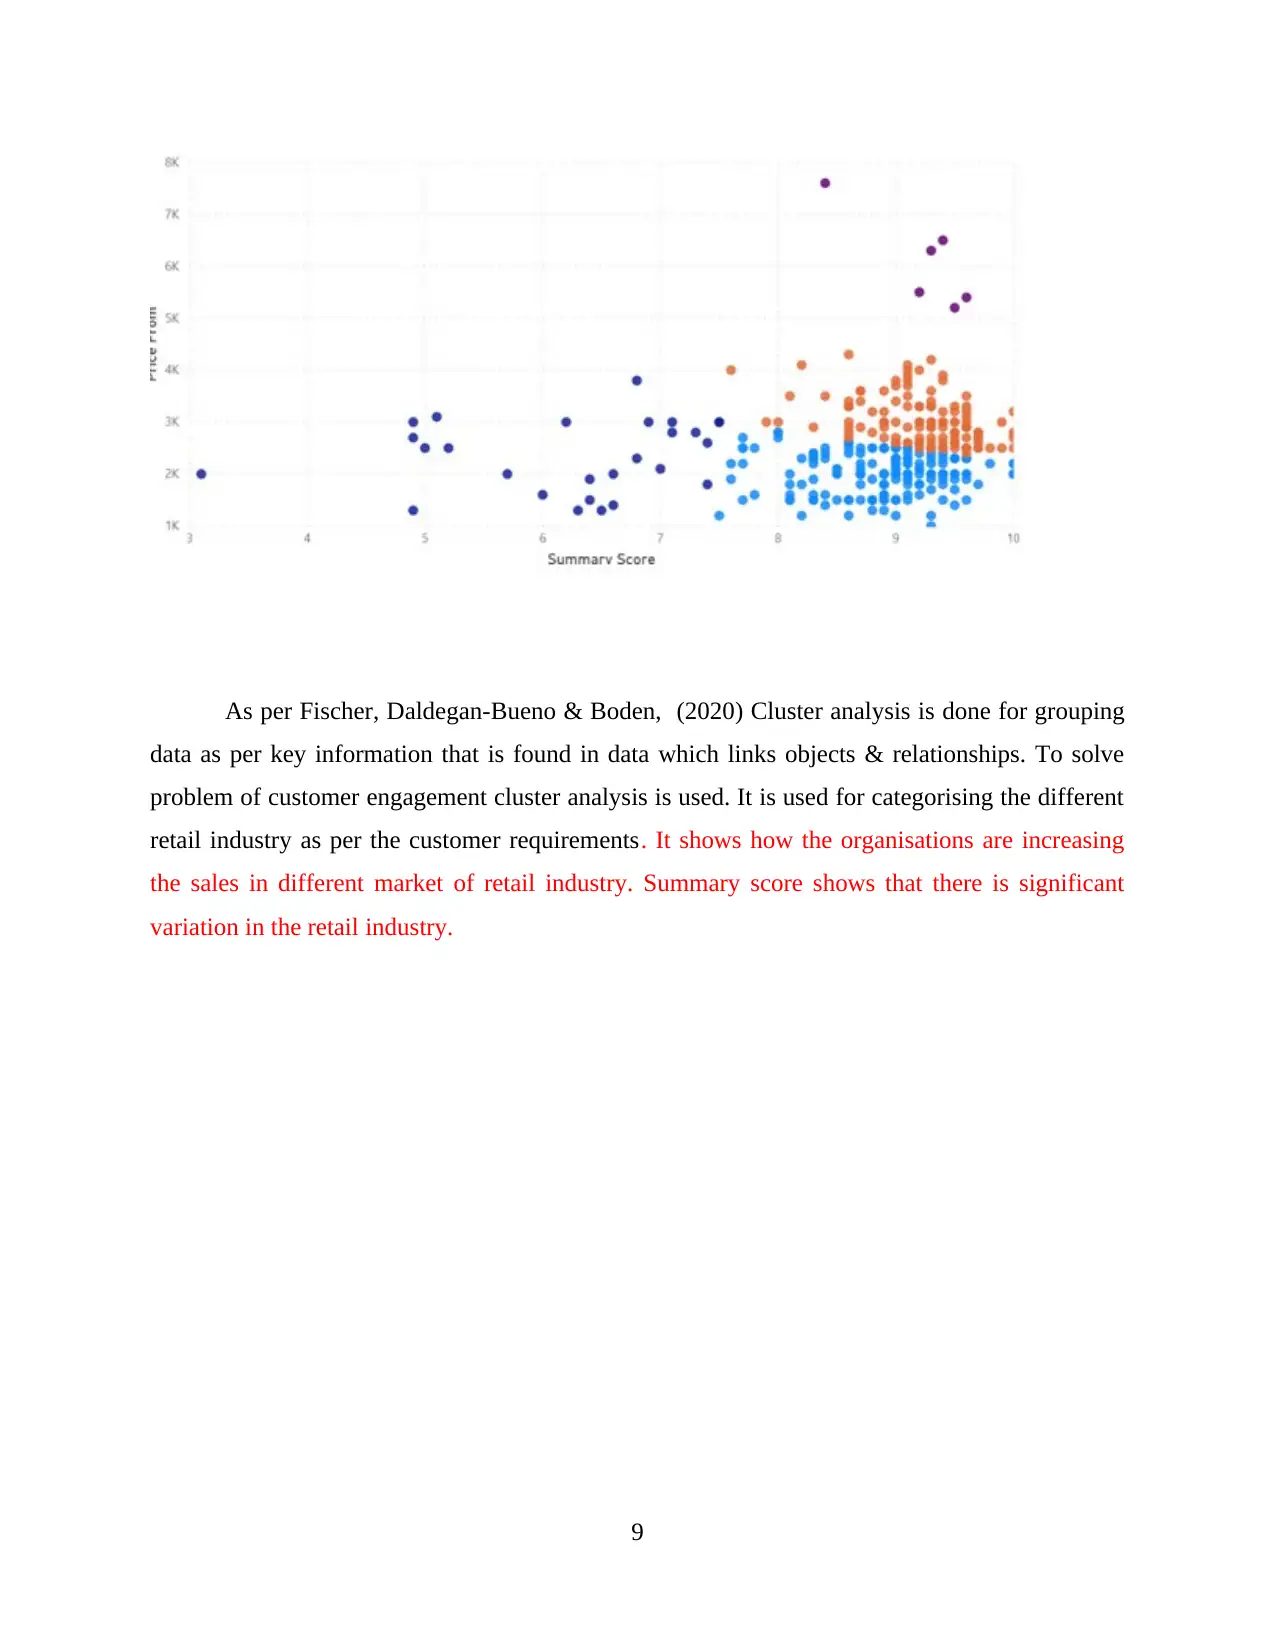
As per Fischer, Daldegan-Bueno & Boden, (2020) Cluster analysis is done for grouping
data as per key information that is found in data which links objects & relationships. To solve
problem of customer engagement cluster analysis is used. It is used for categorising the different
retail industry as per the customer requirements. It shows how the organisations are increasing
the sales in different market of retail industry. Summary score shows that there is significant
variation in the retail industry.
9
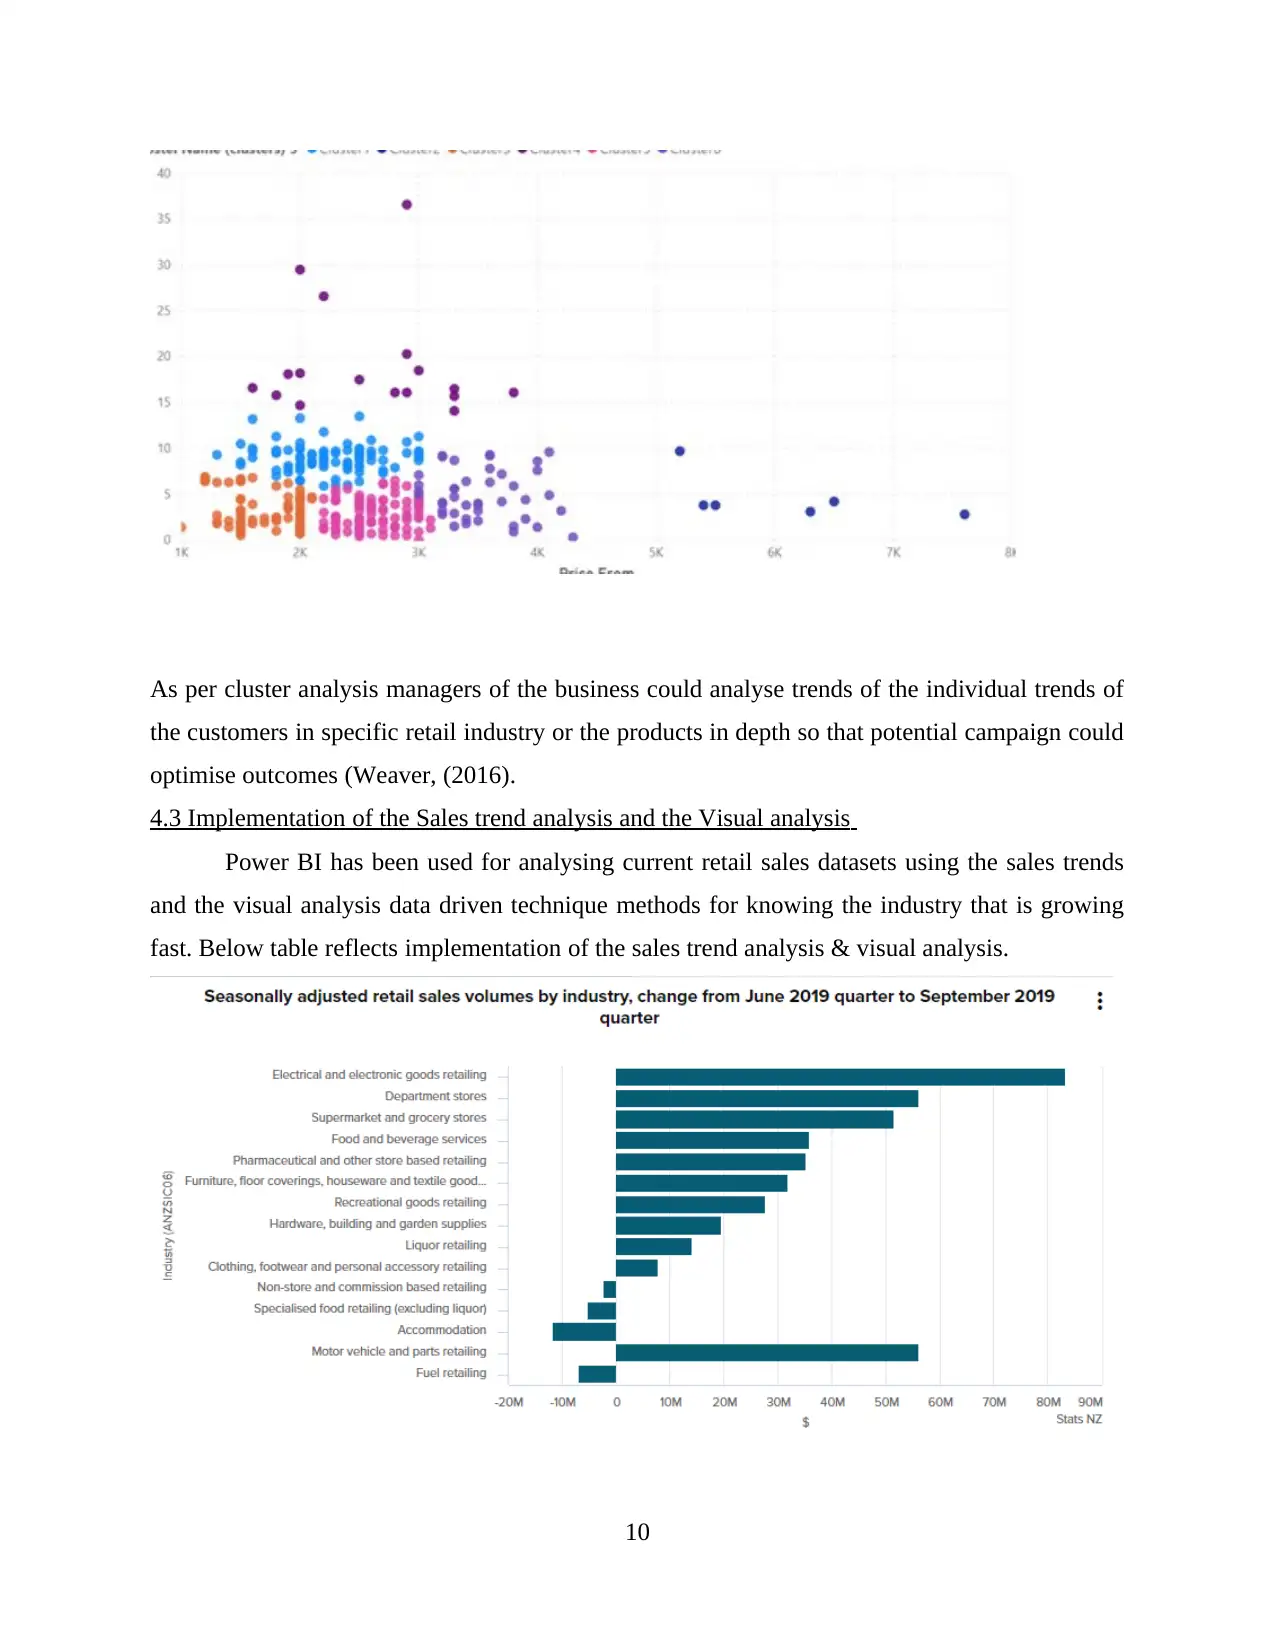
As per cluster analysis managers of the business could analyse trends of the individual trends of
the customers in specific retail industry or the products in depth so that potential campaign could
optimise outcomes (Weaver, (2016).
4.3 Implementation of the Sales trend analysis and the Visual analysis
Power BI has been used for analysing current retail sales datasets using the sales trends
and the visual analysis data driven technique methods for knowing the industry that is growing
fast. Below table reflects implementation of the sales trend analysis & visual analysis.
10
⊘ This is a preview!⊘
Do you want full access?
Subscribe today to unlock all pages.
Trusted by 1+ million students worldwide
1 out of 17
Related Documents


Your All-in-One AI-Powered Toolkit for Academic Success.
+13062052269
info@desklib.com
Available 24*7 on WhatsApp / Email
![[object Object]](/_next/static/media/star-bottom.7253800d.svg)
Unlock your academic potential
Copyright © 2020–2026 A2Z Services. All Rights Reserved. Developed and managed by ZUCOL.