Business Decision Making: UK Retail Sales Revenue Analysis

Verified

Added on  2023/04/22

|22
|1086
|84
Report
AI Summary
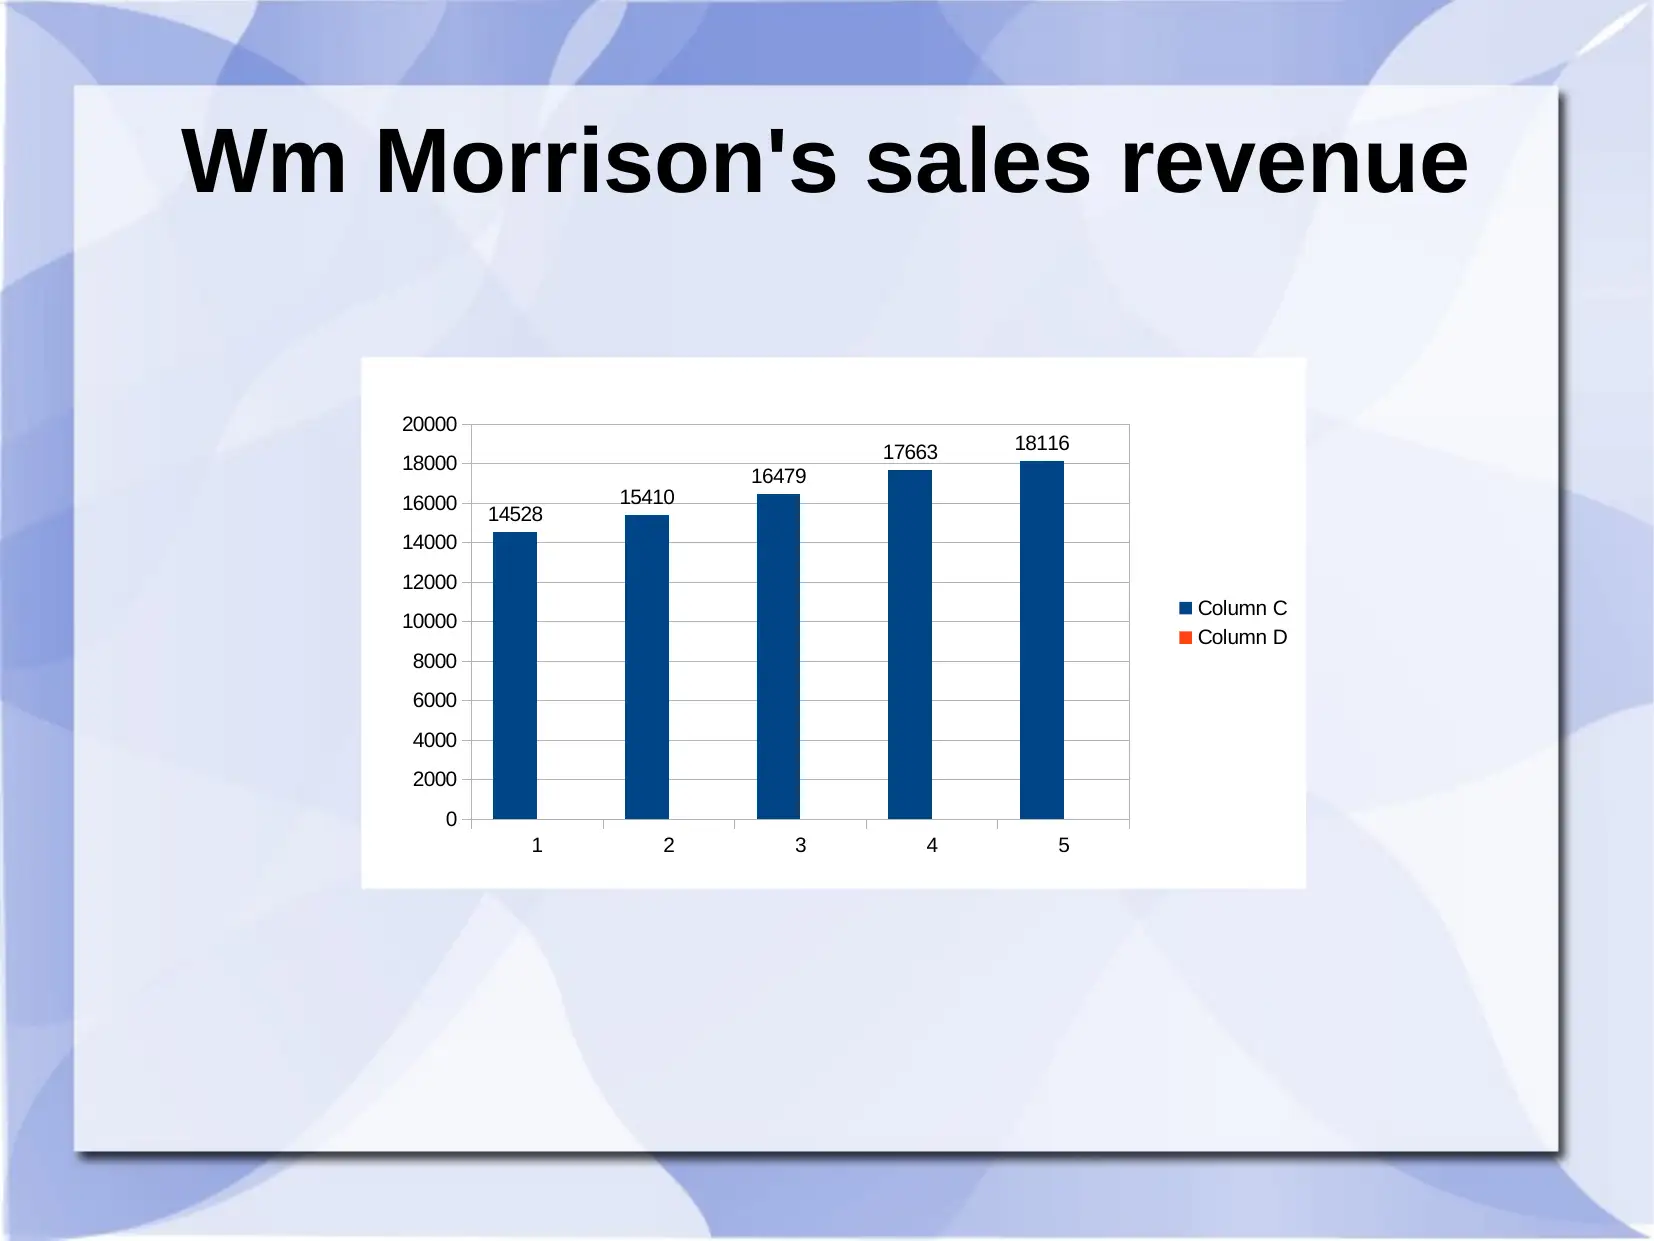
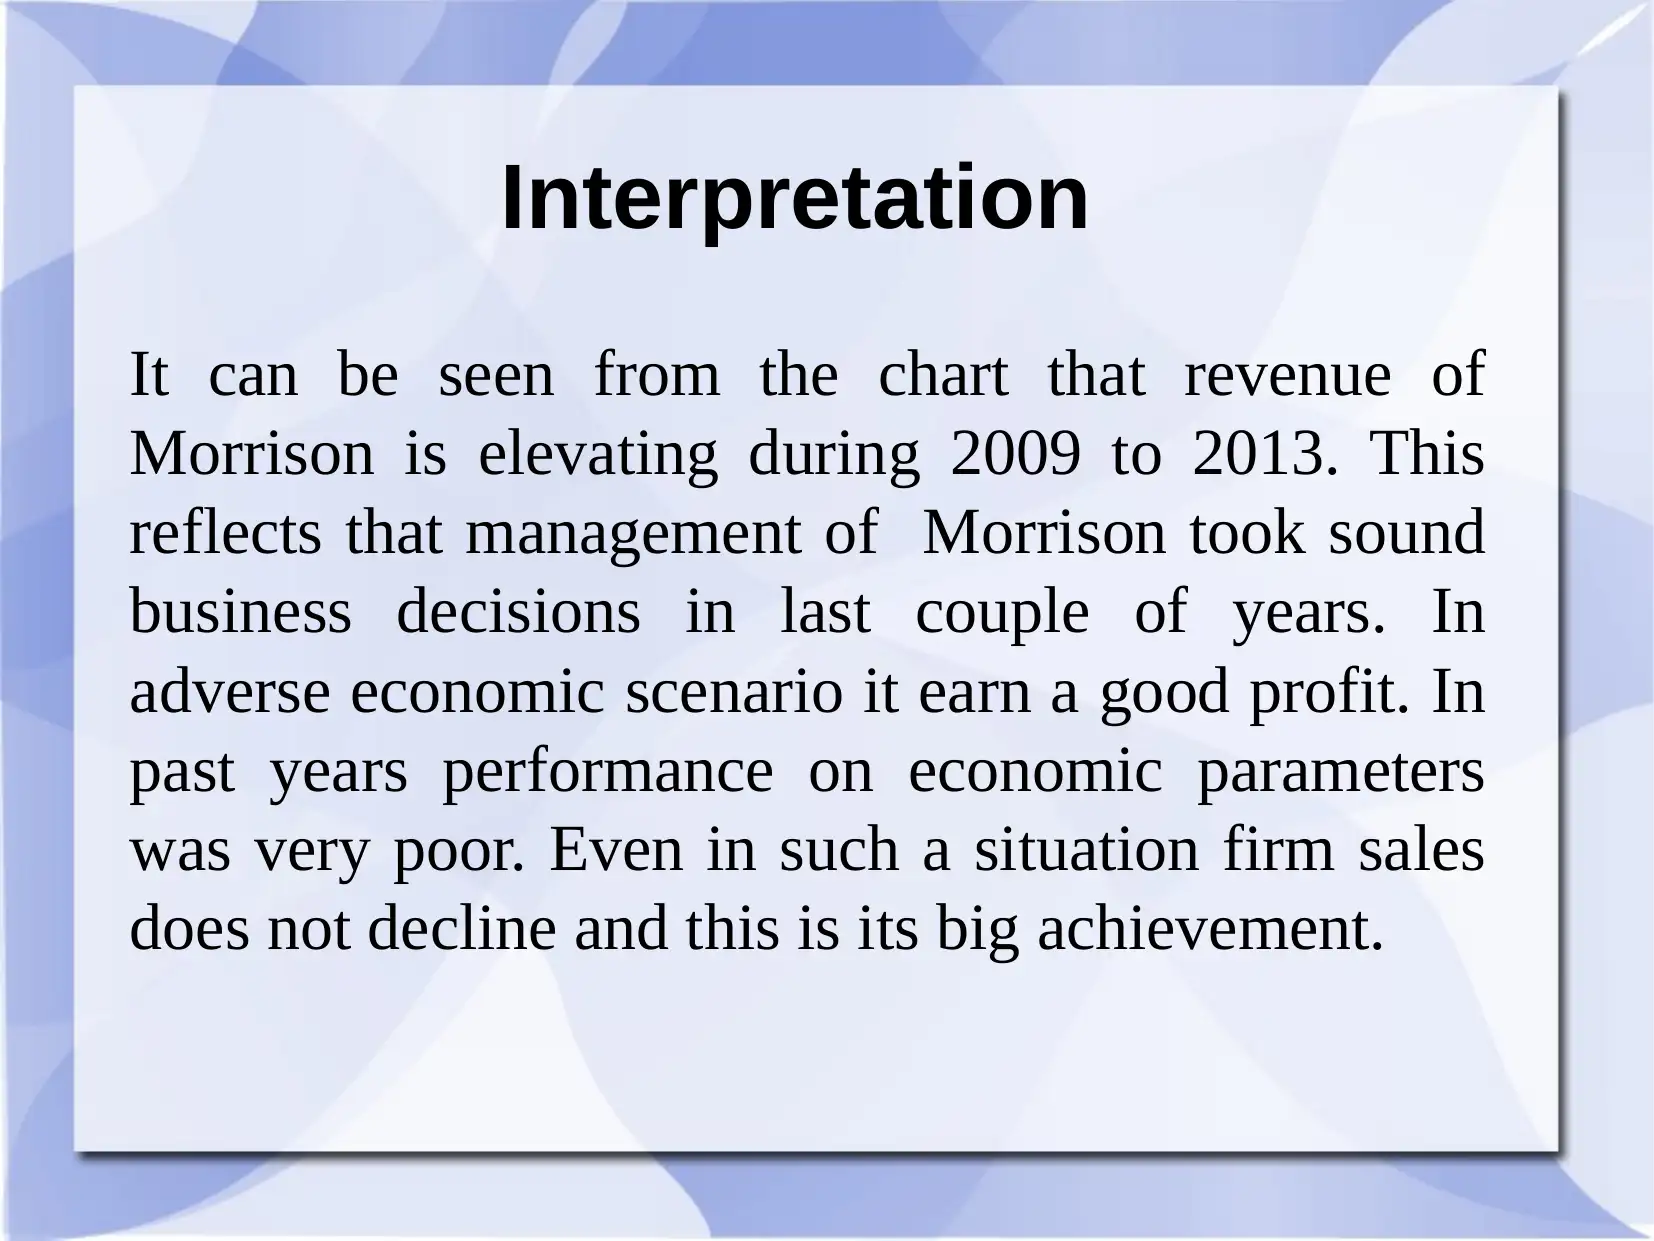
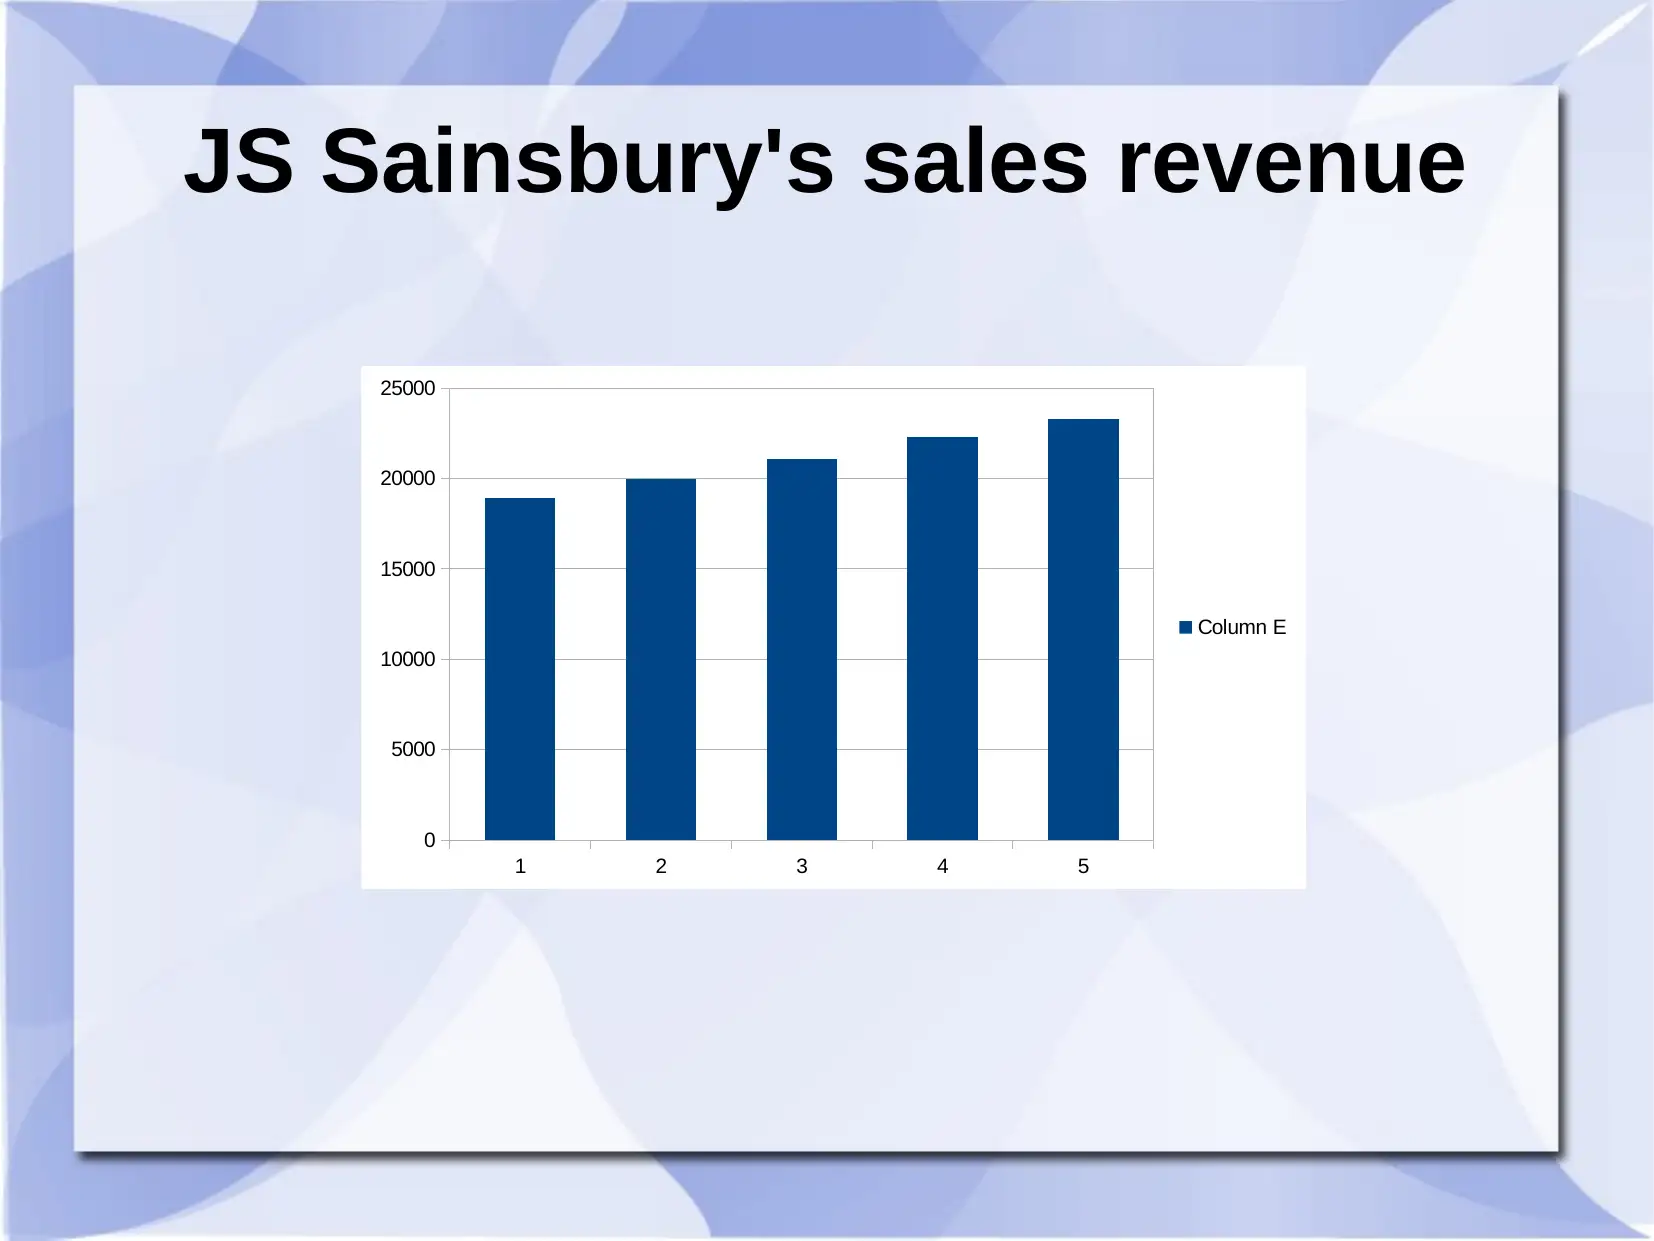
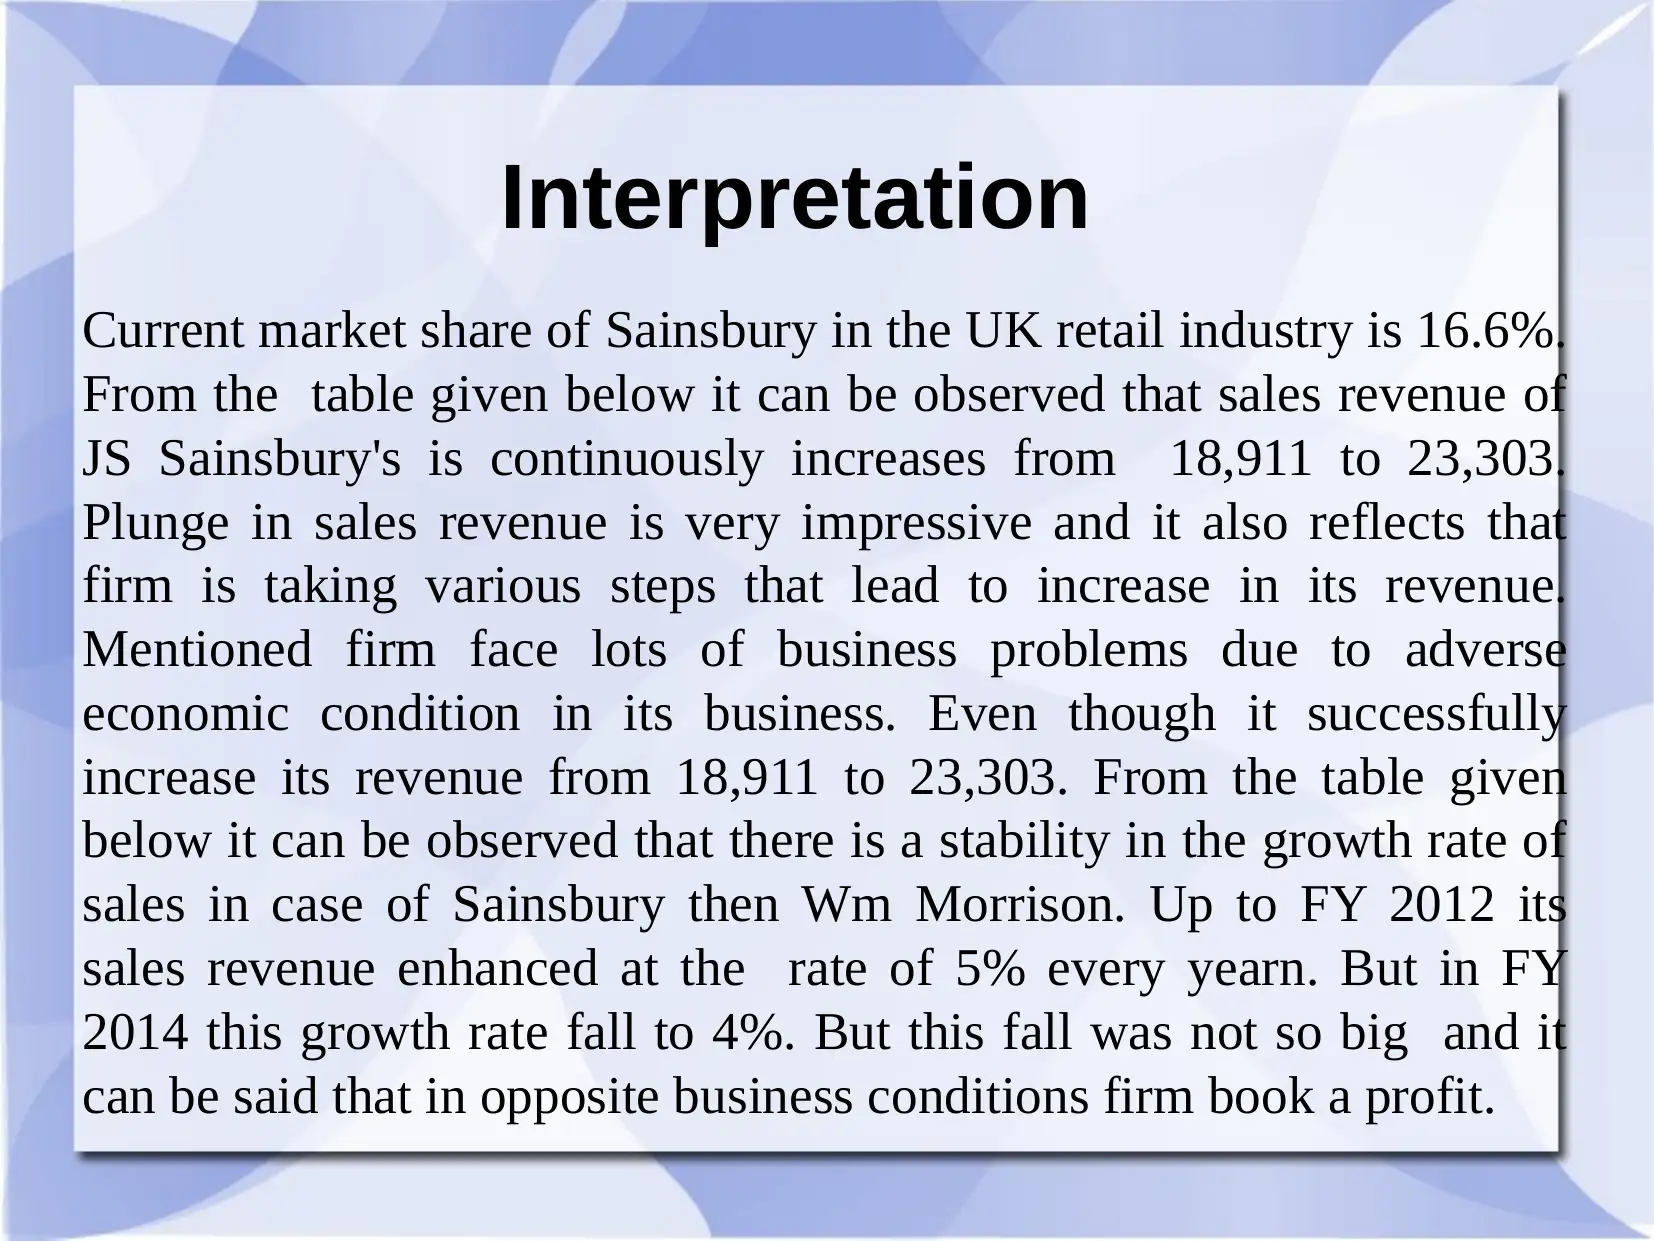
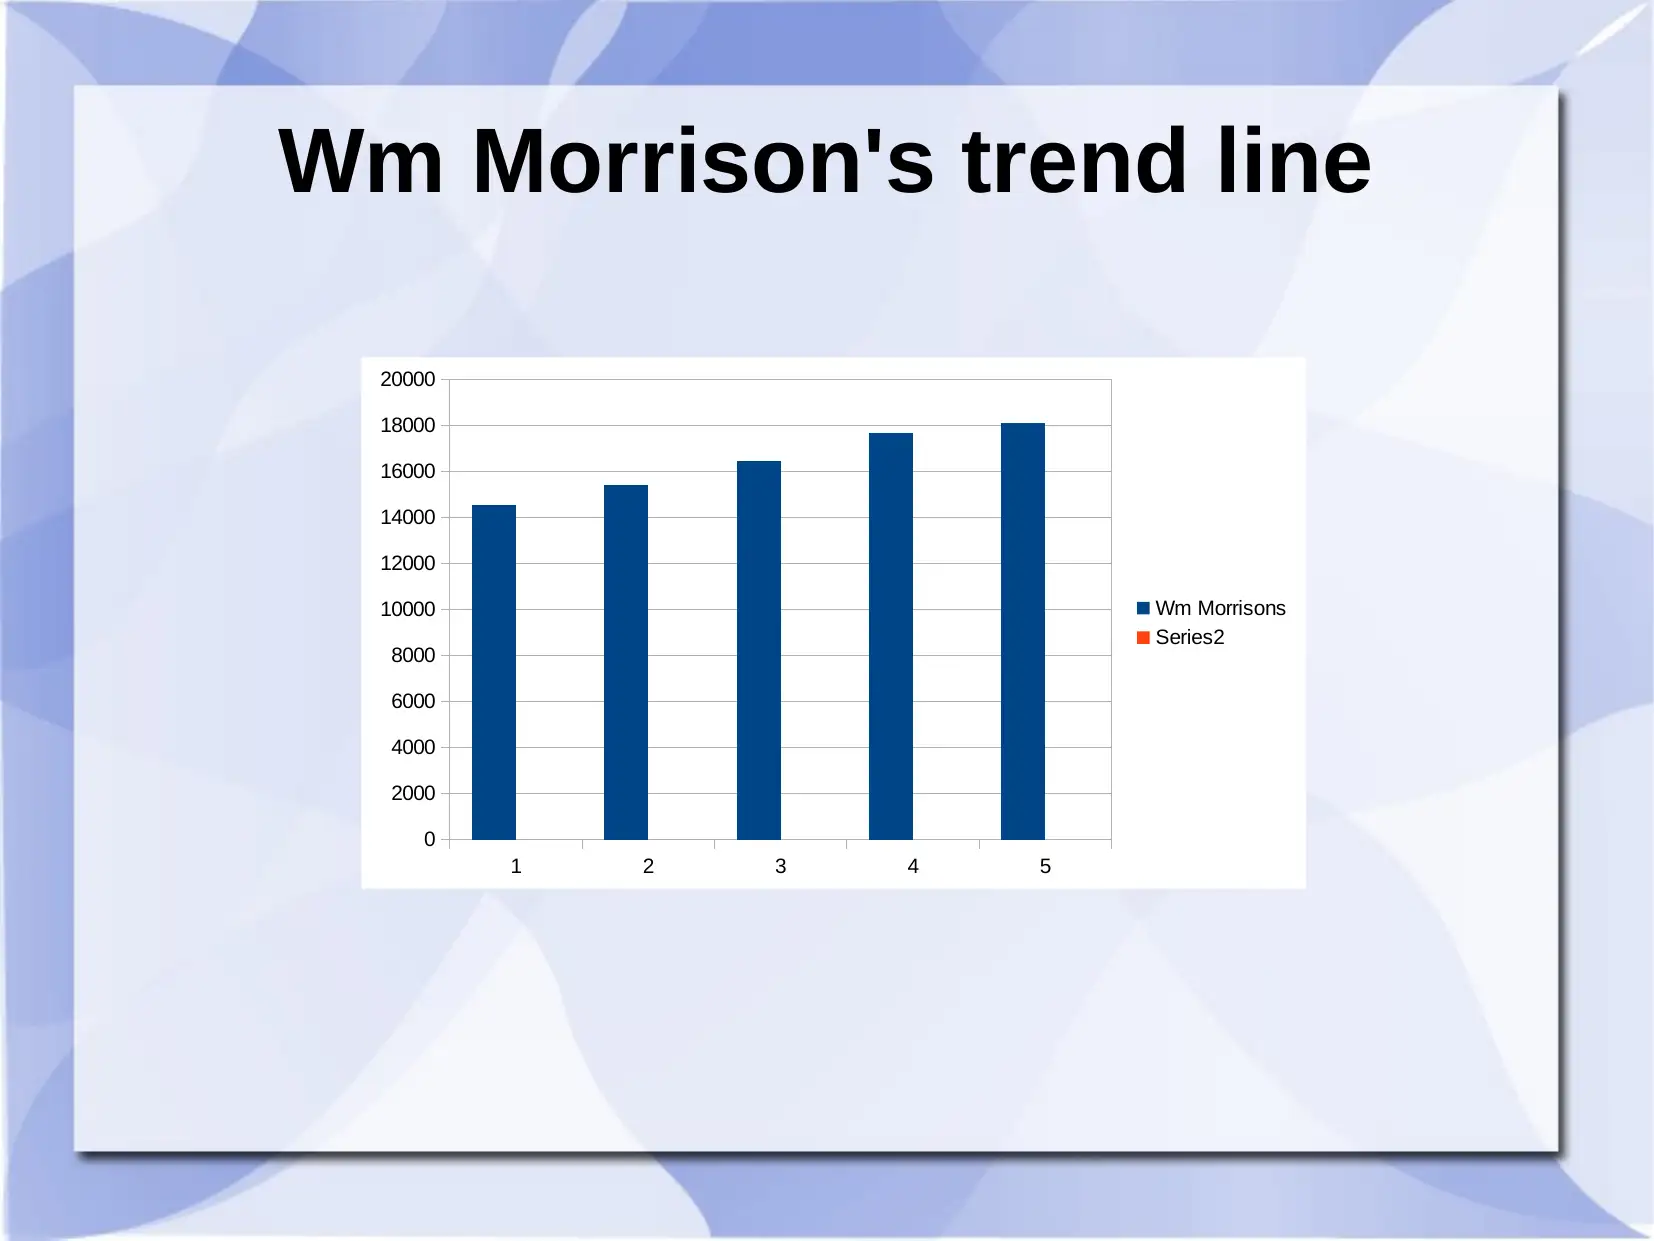
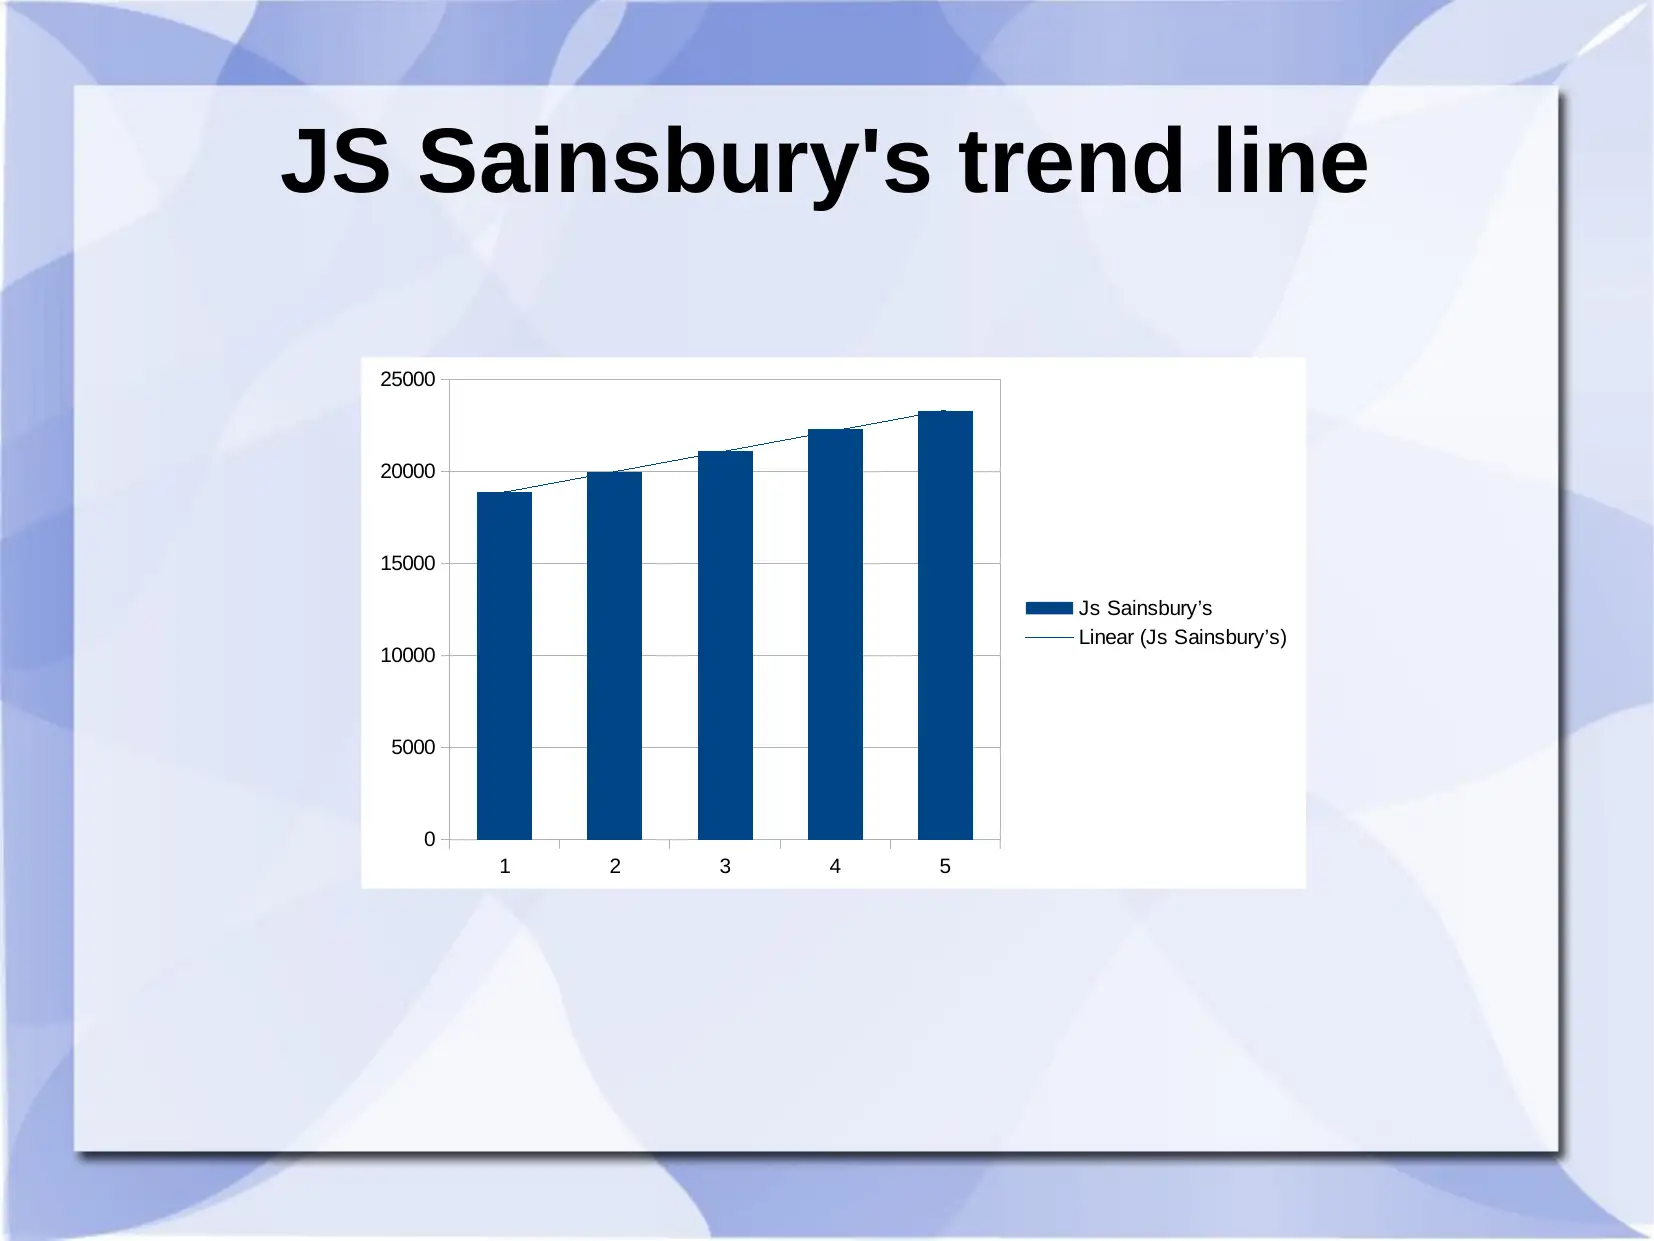
This report provides an analysis of the sales revenue trends of four major UK retailers: Wm Morrison, JS Sainsbury, Aldi, and Lidl. It examines their performance from 2009 to 2013, highlighting key insights into their business decisions and responses to economic conditions. The analysis includes interpretations of sales charts, trend lines, and Gantt charts, offering a comparative view of each company's growth and market position. The report also touches upon the application of the critical path method and PERT charts for project management. The analysis indicates that while all companies experienced growth, the rate and strategies varied. The report uses statistical interpretations to evaluate the sales performance of each company, providing a comprehensive overview of the UK retail landscape and the business strategies employed by these major players. The report aims to provide a comprehensive overview of the sales performance of the companies, including how they navigated economic challenges and employed business strategies.
tabler-icon-diamond-filled.svg

Contribute Materials

Your contribution can guide someone’s learning journey. Share your documents today.
Document Page
BUSINESS DECISION MAKING
tabler-icon-diamond-filled.svg

Secure Best Marks with AI Grader

Need help grading? Try our AI Grader for instant feedback on your assignments.
Document Page
Wm Morrison's sales revenue
1 2 3 4 5
0
2000
4000
6000
8000
10000
12000
14000
16000
18000
20000
14528 15410
16479
17663 18116
Column C
Column D
Document Page
Interpretation
It can be seen from the chart that revenue of
Morrison is elevating during 2009 to 2013. This
reflects that management of Morrison took sound
business decisions in last couple of years. In
adverse economic scenario it earn a good profit. In
past years performance on economic parameters
was very poor. Even in such a situation firm sales
does not decline and this is its big achievement.
Document Page
JS Sainsbury's sales revenue
1 2 3 4 5
0
5000
10000
15000
20000
25000
Column E
tabler-icon-diamond-filled.svg

Secure Best Marks with AI Grader

Need help grading? Try our AI Grader for instant feedback on your assignments.
Document Page
Interpretation
Current market share of Sainsbury in the UK retail industry is 16.6%.
From the table given below it can be observed that sales revenue of
JS Sainsbury's is continuously increases from 18,911 to 23,303.
Plunge in sales revenue is very impressive and it also reflects that
firm is taking various steps that lead to increase in its revenue.
Mentioned firm face lots of business problems due to adverse
economic condition in its business. Even though it successfully
increase its revenue from 18,911 to 23,303. From the table given
below it can be observed that there is a stability in the growth rate of
sales in case of Sainsbury then Wm Morrison. Up to FY 2012 its
sales revenue enhanced at the rate of 5% every yearn. But in FY
2014 this growth rate fall to 4%. But this fall was not so big and it
can be said that in opposite business conditions firm book a profit.
Document Page
Lidl sales revenue
1 2 3 4 5
0
50
100
150
200
250
Column F
Document Page
Interpretation
It can be seen from the chart that that Lidl sales revenue
increased continuously for the given year of data. During
the mentioned time period its sales revenue increased
from 164 to 212. If we compare company sales then it
can be seen that firm revenue is very low relative to
competitor firms but its sales growth rate is very high. In
the table it can be observed that growth rate of sales
revenue was just 2%. But this rate get increased in the FY
2011 and sales grow at 9.11% in this financial year.
tabler-icon-diamond-filled.svg

Paraphrase This Document

Need a fresh take? Get an instant paraphrase of this document with our AI Paraphraser
Document Page
ALdi sales revenue
1 2 3 4 5
0
1000
2000
3000
4000
5000
6000
Aldi
Document Page
Interpretation
In the graph it can be seen that sales revenue of
Aldi is increasing very quaickly from FY 2009-13.
During the FY 2009-2013 Aldi revenue increased
from 2004 to 5,200 and it can be said that sharp
traction is observed in sales revenue. This happen
when global economic crisis was spreading in the
domestic and international market. Hence, it can
be said that firm give a good performance.
Document Page
Wm Morrison's trend line
1 2 3 4 5
0
2000
4000
6000
8000
10000
12000
14000
16000
18000
20000
Wm Morrisons
Series2
tabler-icon-diamond-filled.svg

Secure Best Marks with AI Grader

Need help grading? Try our AI Grader for instant feedback on your assignments.
Document Page
Interpretation
From the chart it can be seen that firm sales will
increase continuously in upcoming years. But
currently entire world is entangled in the global
economic crisis and homeland of the Morrison's is
also affected to large extent by the recession. Any
negative change in the economy can affect the
profit of the firm. Hence, firm need to remain
cautious and it must formulate a suitable strategy
in order to counter threats and capitalize
opportunities.
Document Page
JS Sainsbury's trend line
1 2 3 4 5
0
5000
10000
15000
20000
25000
Js Sainsbury’s
Linear (Js Sainsbury’s)
Document Page
Interpretation
From the chart of Js Sainsbury it is clear that its
sales revenue will increase in upcoming years. But
turmoil in economy may prove this prediction
wrong. Along with this, current Eurozone crisis
may also create problems for an organization.
tabler-icon-diamond-filled.svg

Paraphrase This Document

Need a fresh take? Get an instant paraphrase of this document with our AI Paraphraser
Document Page
Lidl trend line
1 2 3 4 5
0
50
100
150
200
250
LidlLtd
Linear (LidlLtd)
Document Page
Interpretation
Trend line chart is showing that in upcoming years
sales of the firm will increase. For two years
increase in sales of Lidl was observed. In FY 2014
its growth rate confined to just 4%. On the basis
of performance in past years it is forecast that in
upcoming years sales will increase. For this firm
need to formulate a unique business strategy.
Document Page
Aldi trend line
1 2 3 4 5
0
1000
2000
3000
4000
5000
6000
Aldi
Linear (Aldi)
tabler-icon-diamond-filled.svg

Secure Best Marks with AI Grader

Need help grading? Try our AI Grader for instant feedback on your assignments.
Document Page
Interpretation
In the diagram it is seen that trend line of Aldi is
raising upward. This indicates that in upcoming years
sales of the firm will increase strongly. In past firm
sales increase from 30-40%. On that basis it is
predicted that sales will increase at fast pace in
upcoming years. However, firm can not entirely
believe on the trend line chart and it will need to take
strong action in order maintain its current performance.
Document Page
GANTT chart
Row 1 Row 2 Row 3 Row 4
0
2
4
6
8
10
12
Column 1
Column 2
Column 3
Document Page
Networtk diagram
tabler-icon-diamond-filled.svg

Paraphrase This Document

Need a fresh take? Get an instant paraphrase of this document with our AI Paraphraser
Document Page
Interpretation
Critical path method is a diagram that indicate the time
period within which each and every sub activity of the
project must be completed (PERT chart (Program
evaluation and review technique) definition. 2015).
Project manager needs to perform these activities in the
specific sequence. Path for this project is 1+5+8+9+10
and total time taken required to complete a project is
22 days. Hence, it can be said that this is a maximum
time in which project can be completed.
Document Page
References
Gravetter, F. and Wallnau, L., 2013. Essentials of statistics for the behavioral sciences.
Cengage Learning.
Krikidis, I., Devroye, N. and Thompson, J.S., 2010. Stability analysis for cognitive radio
with multi-access primary transmission. Wireless Communications. IEEE
Transactions. 9(1). pp.72-77.
Piwowarski, G., Krajewski, W.K. and Lelito, J., 2010. Optimization of casting
technology of the pressure die cast AZ91D Mg-based alloy. Metallurgy and
Foundry Engineering. 36. pp.105-111.
Document Page
Thank you
chevron_up_icon
1 out of 22
circle_padding
hide_on_mobile
zoom_out_icon
logo.png

Your All-in-One AI-Powered Toolkit for Academic Success.

Available 24*7 on WhatsApp / Email

[object Object]