Retail Grocery Customer Satisfaction Analysis Report - [University]

Verified

Added on  2022/08/19

|12
|642
|13
Report
AI Summary
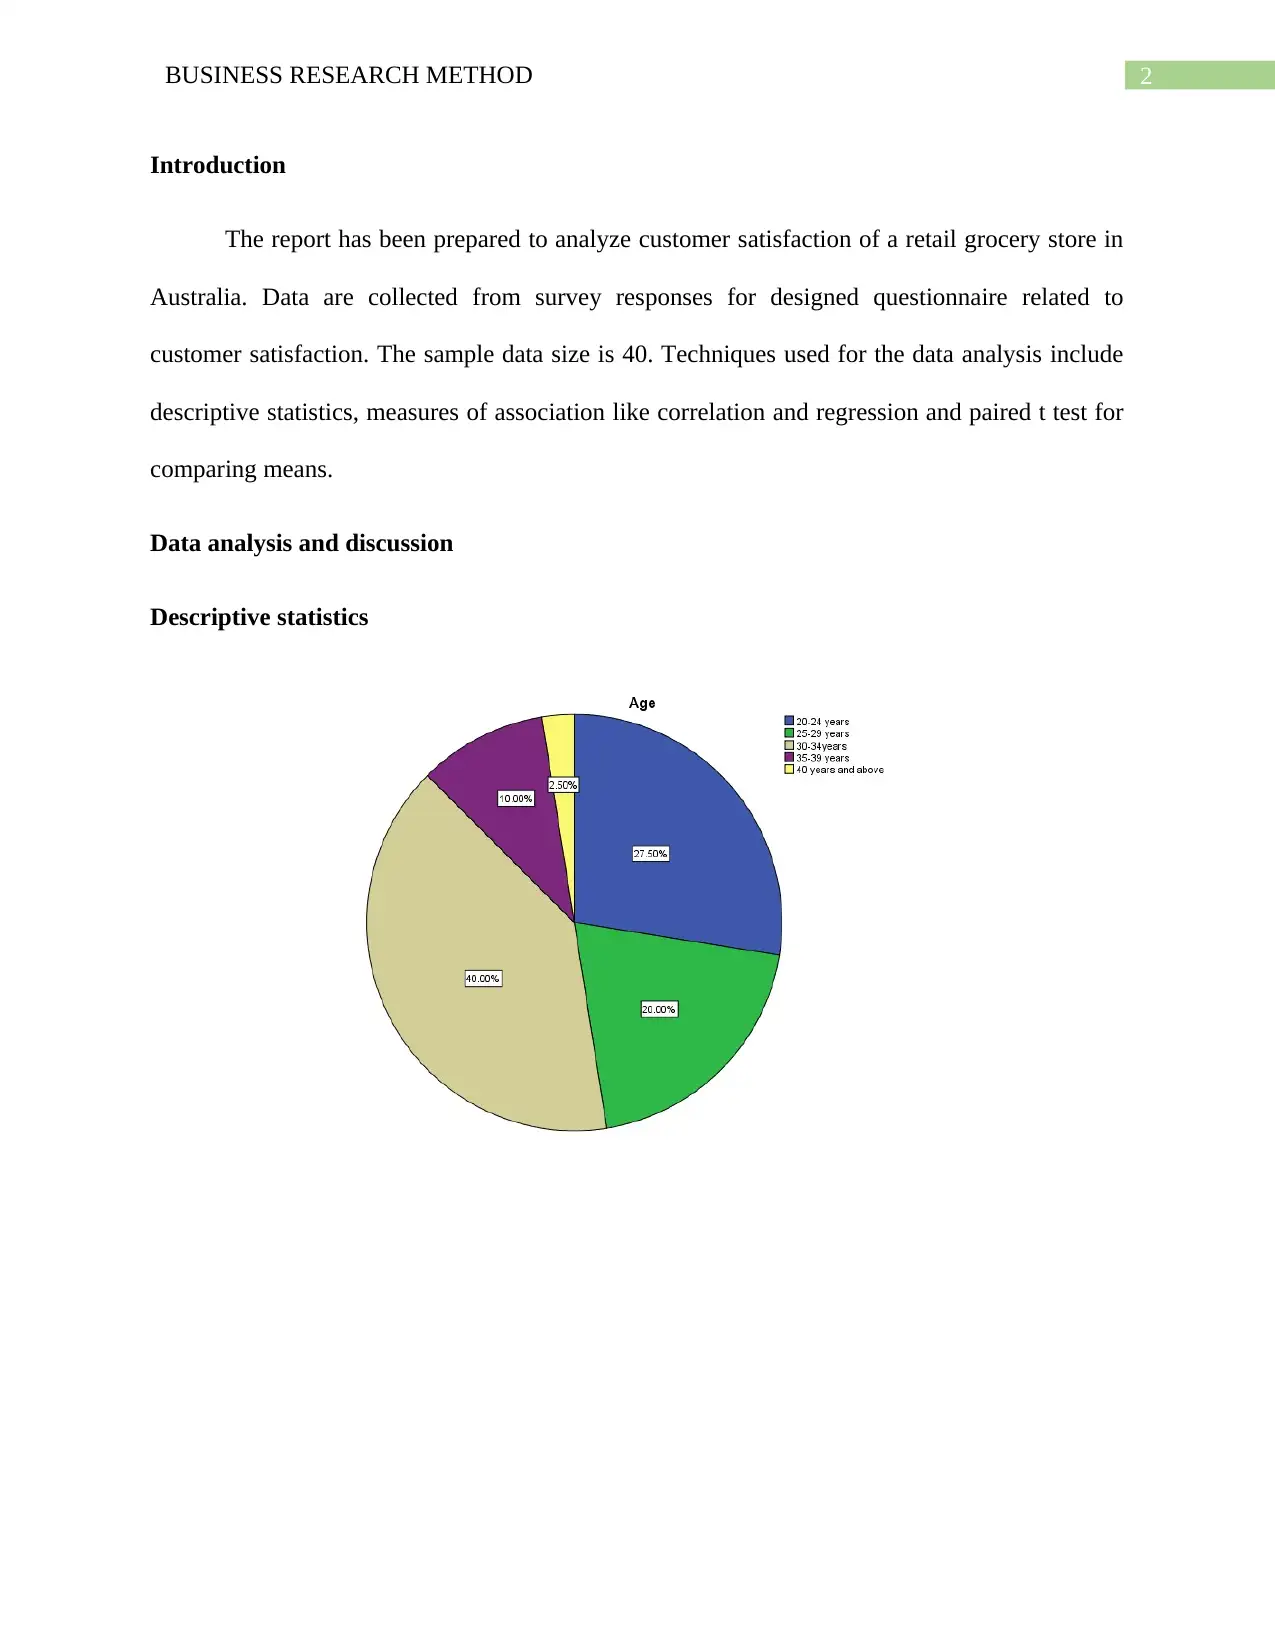
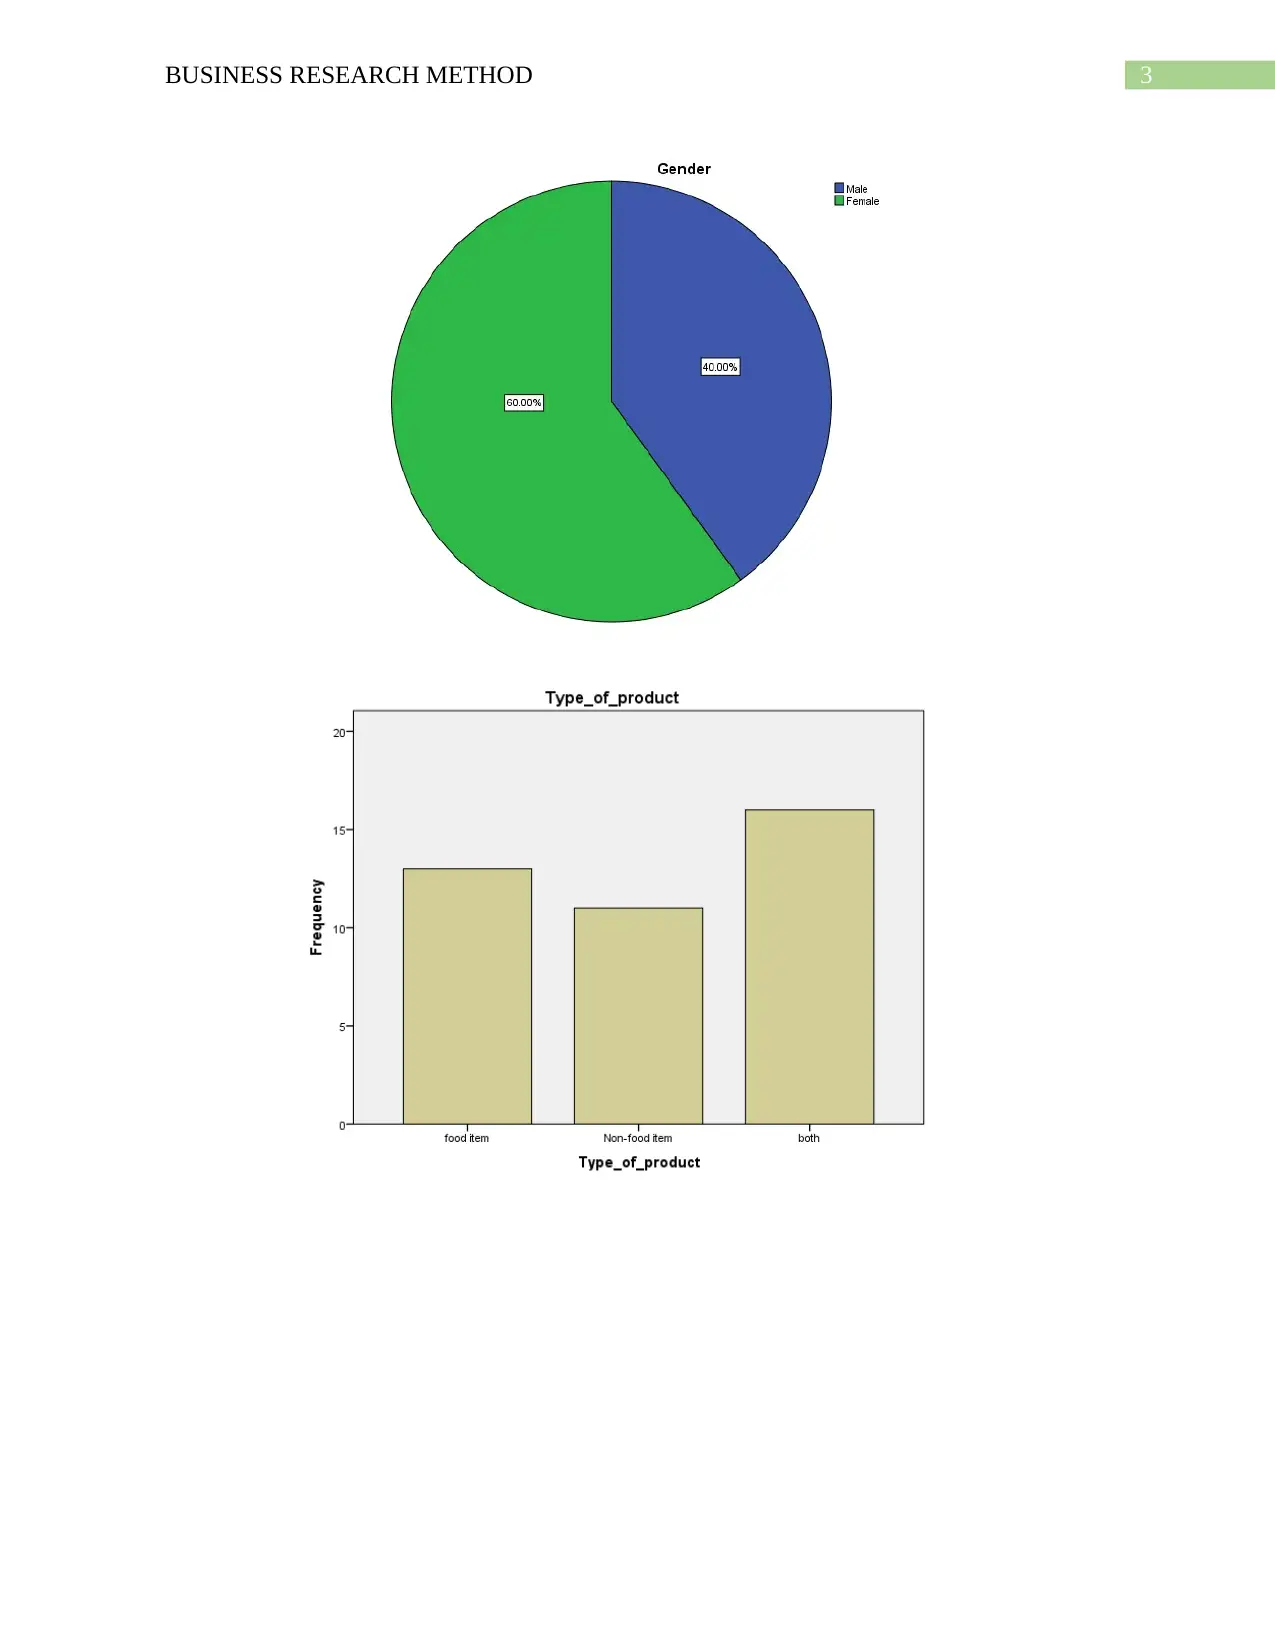
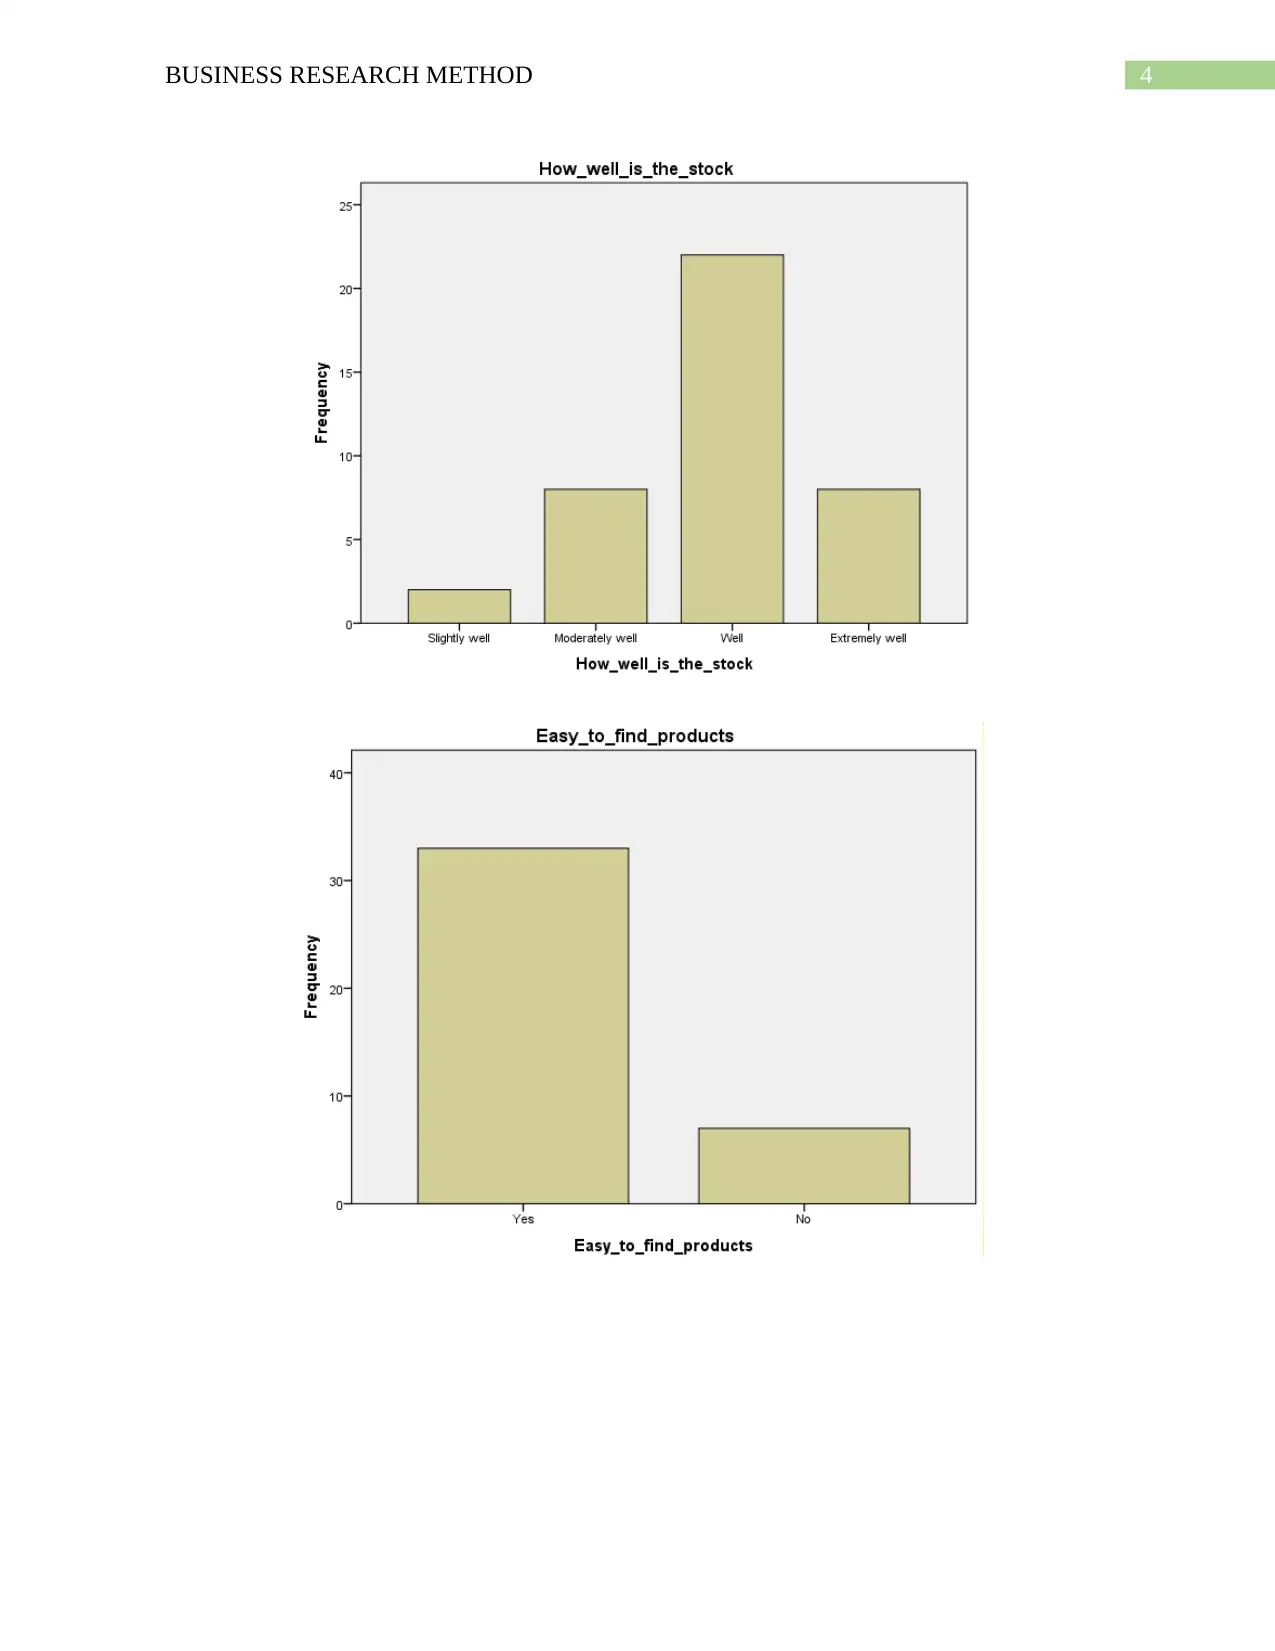
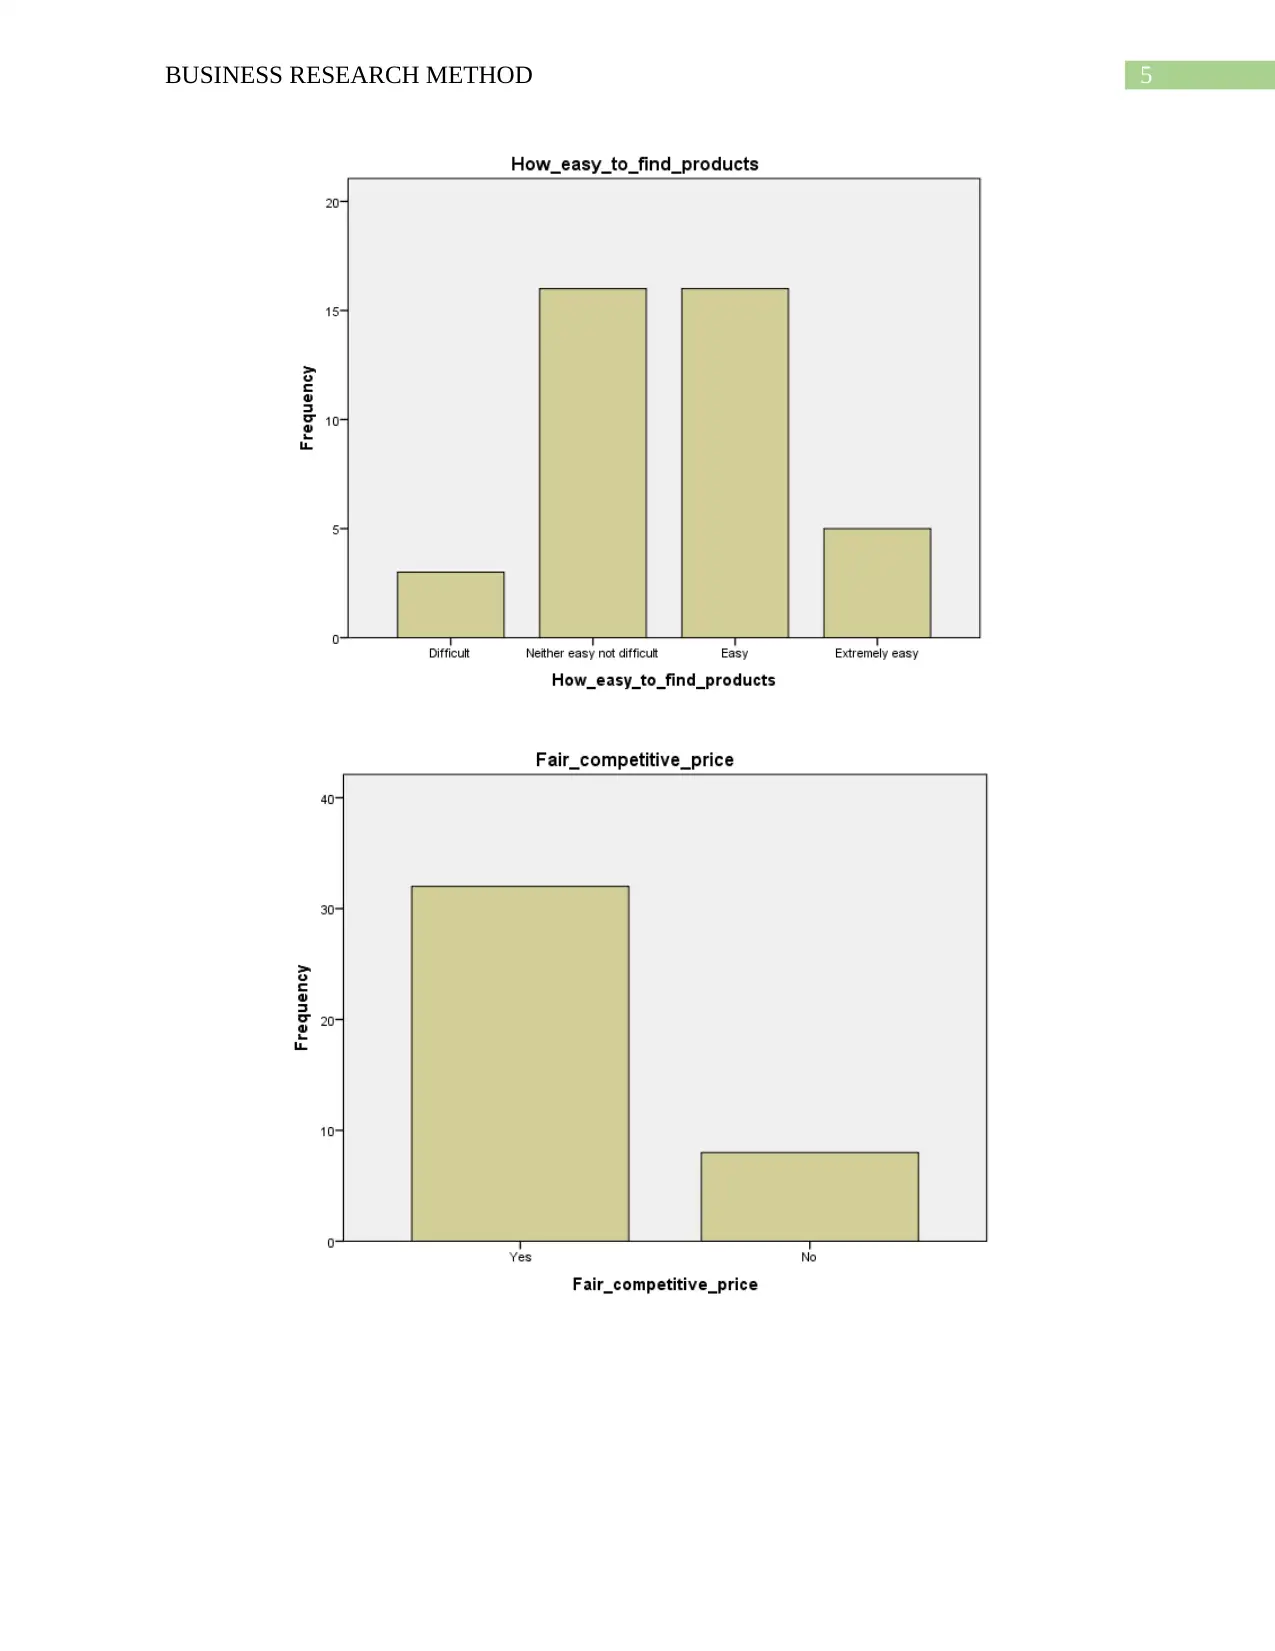
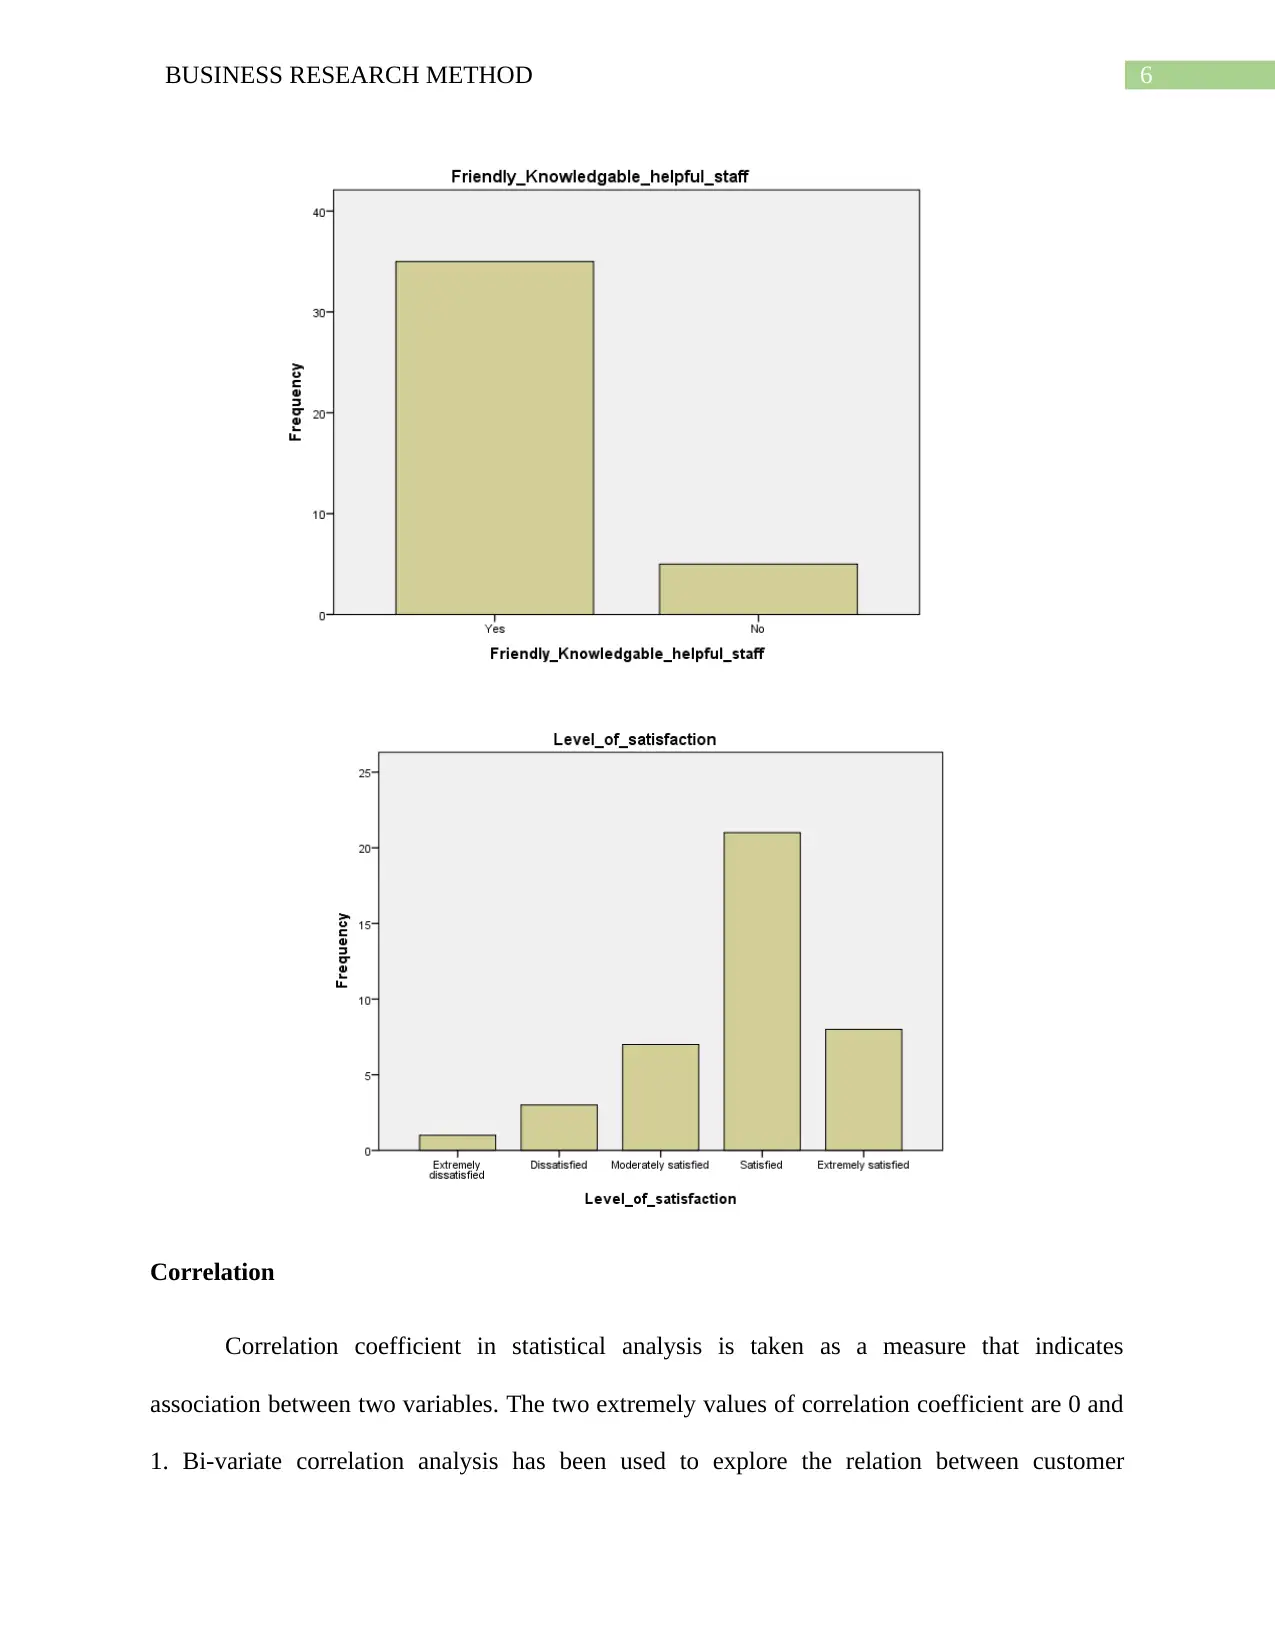
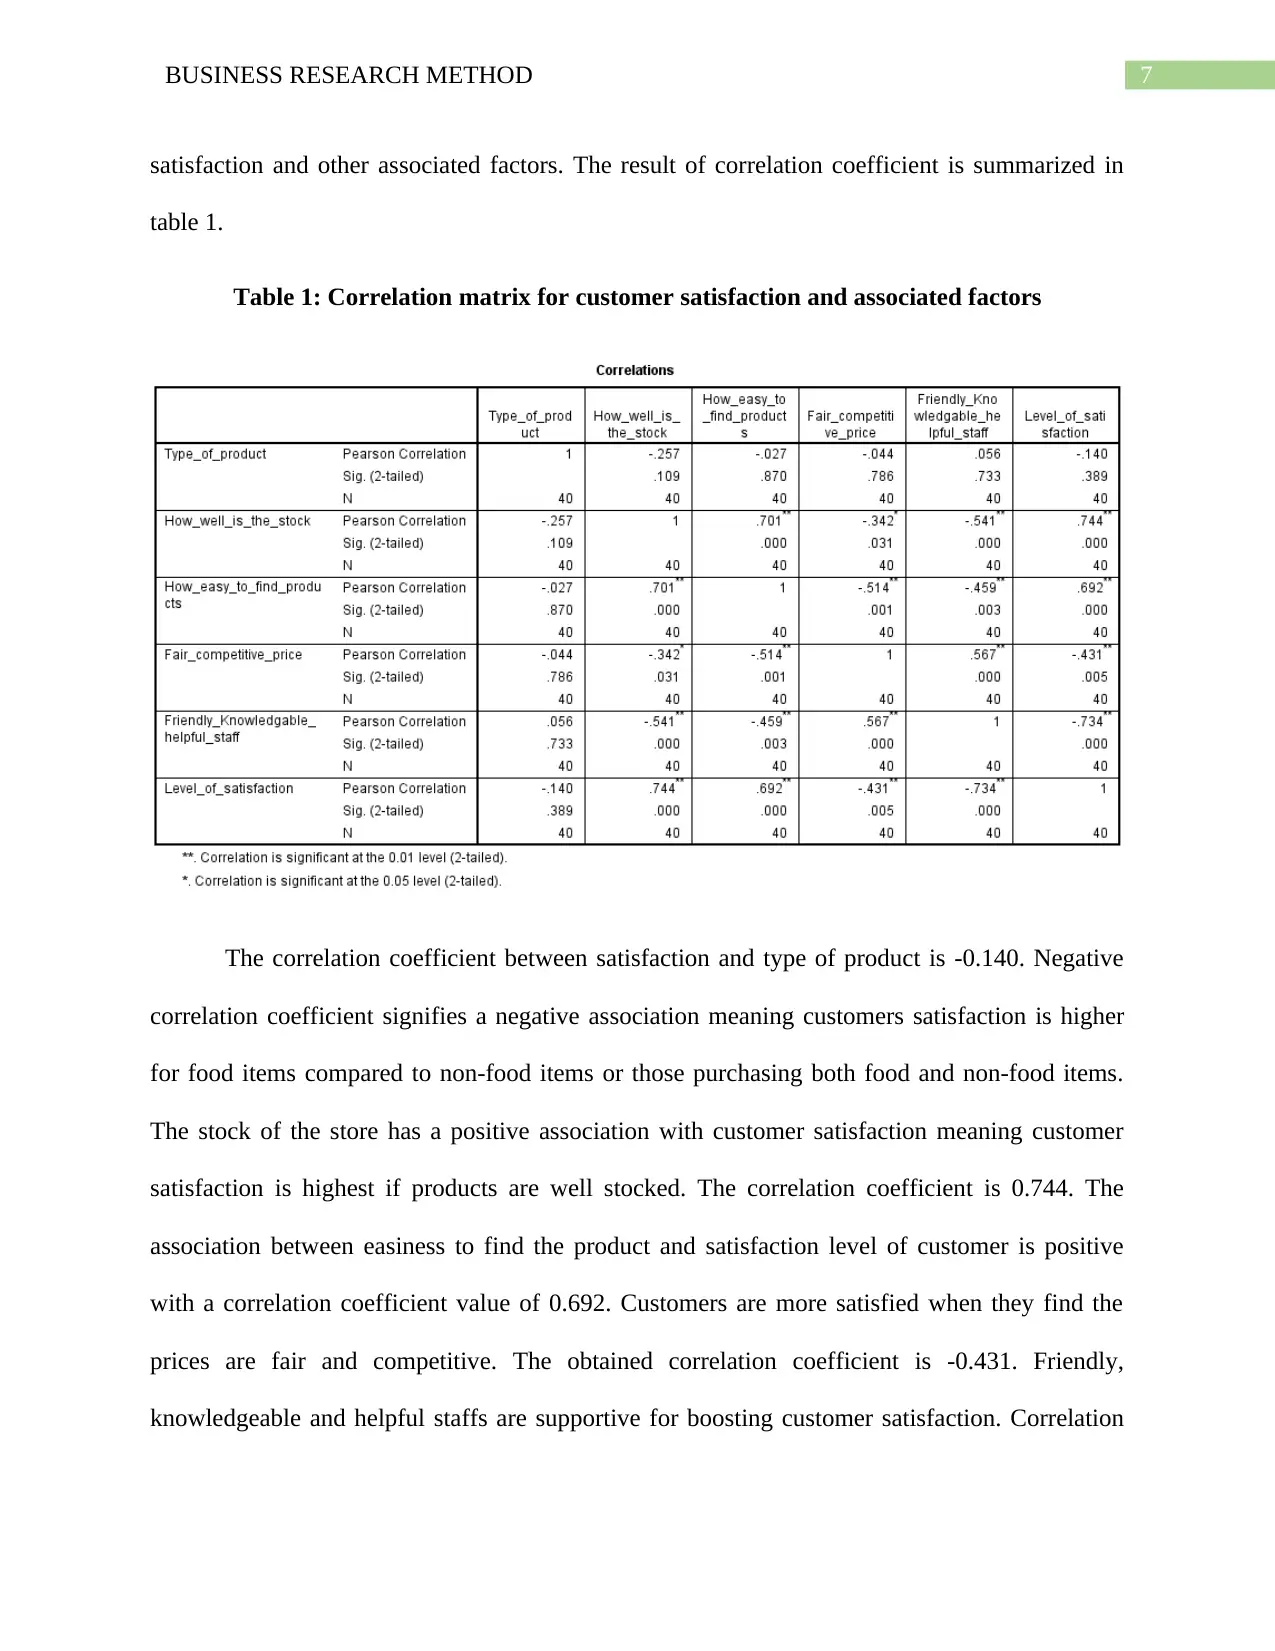
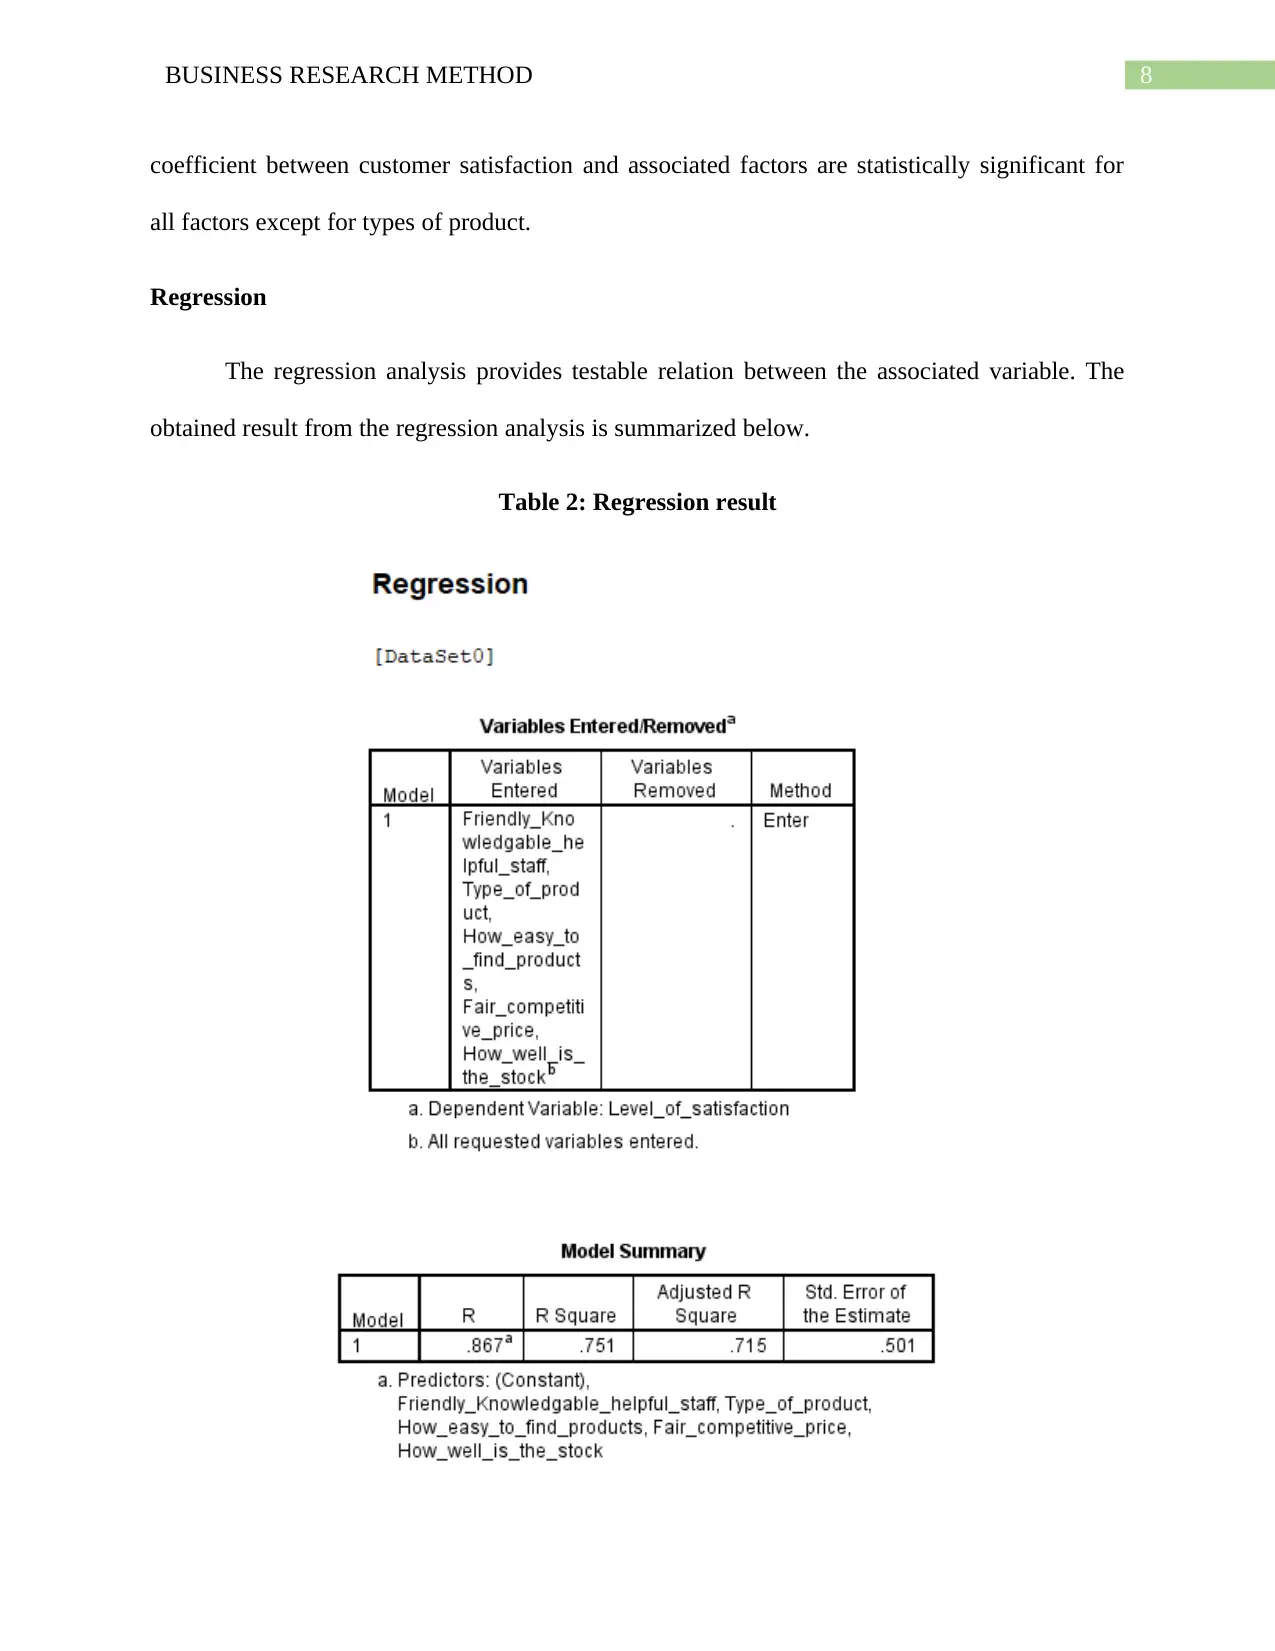
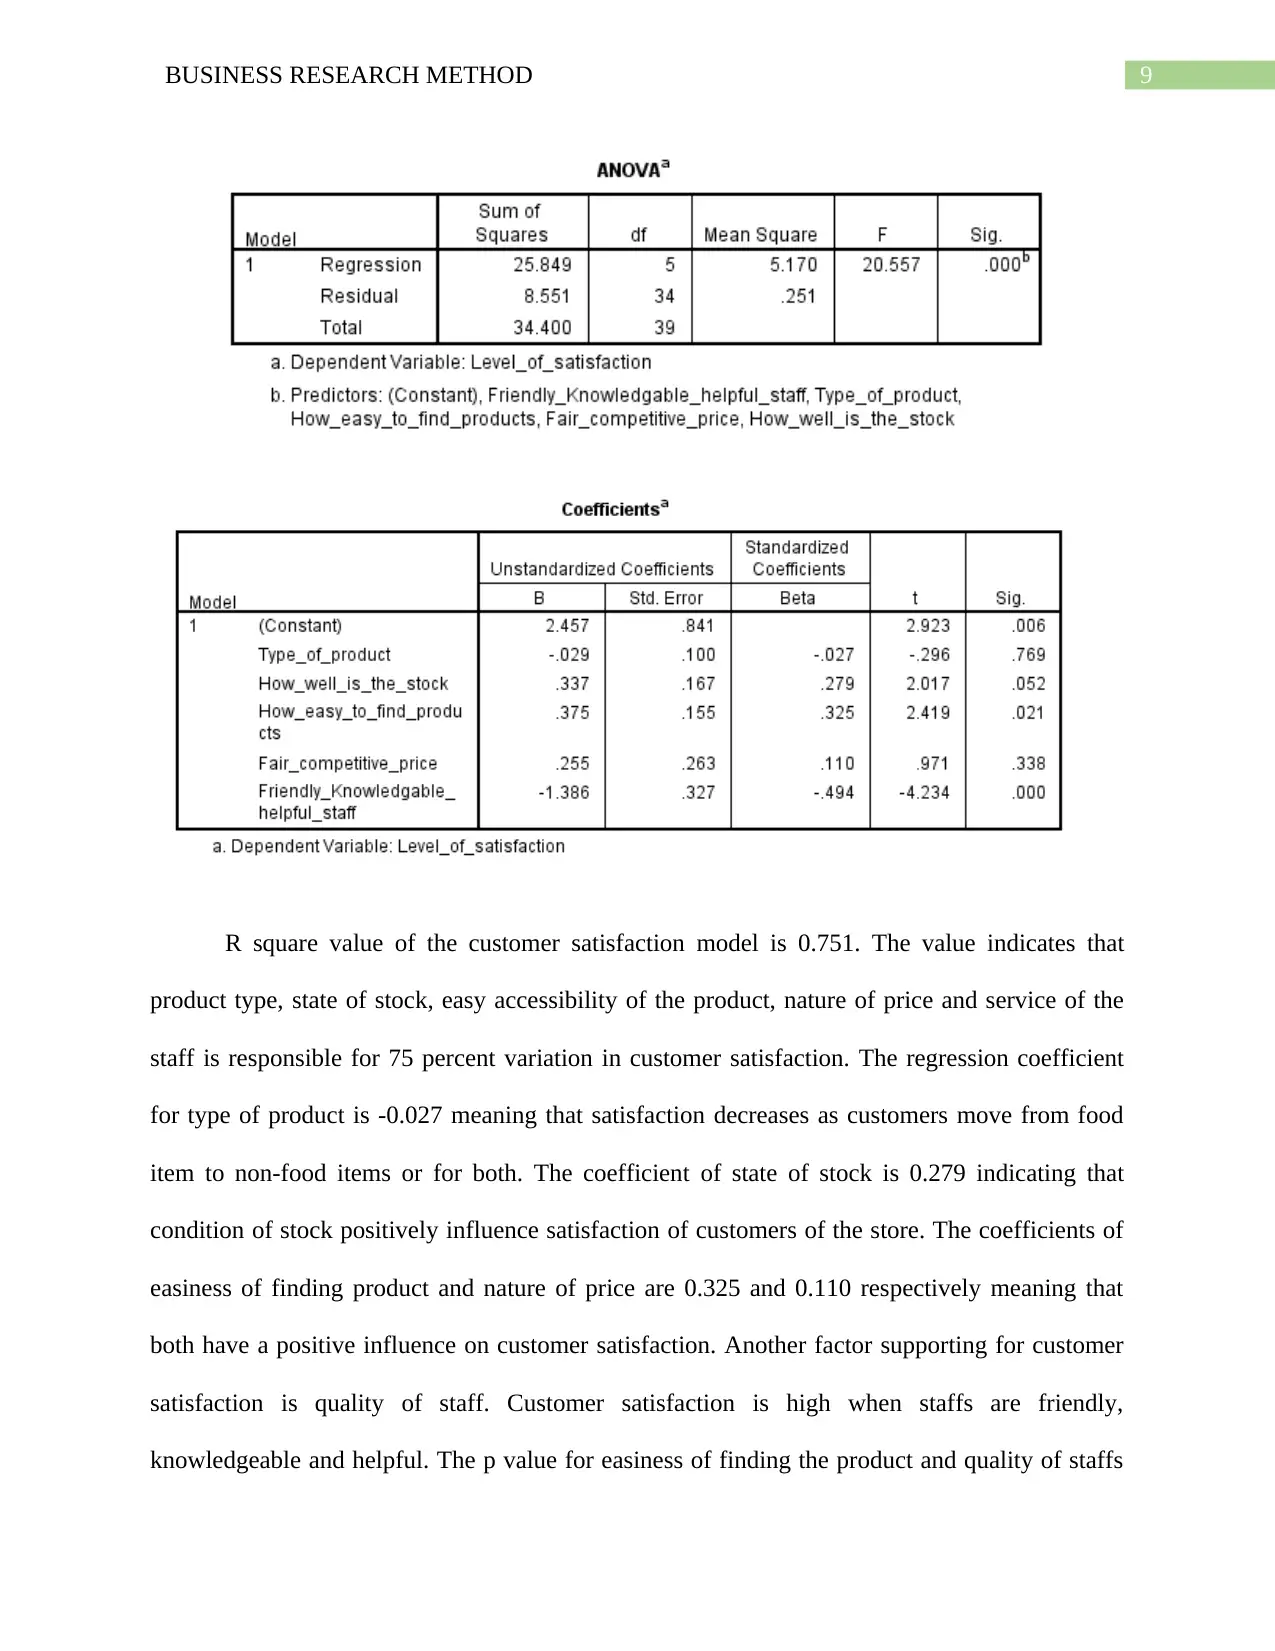
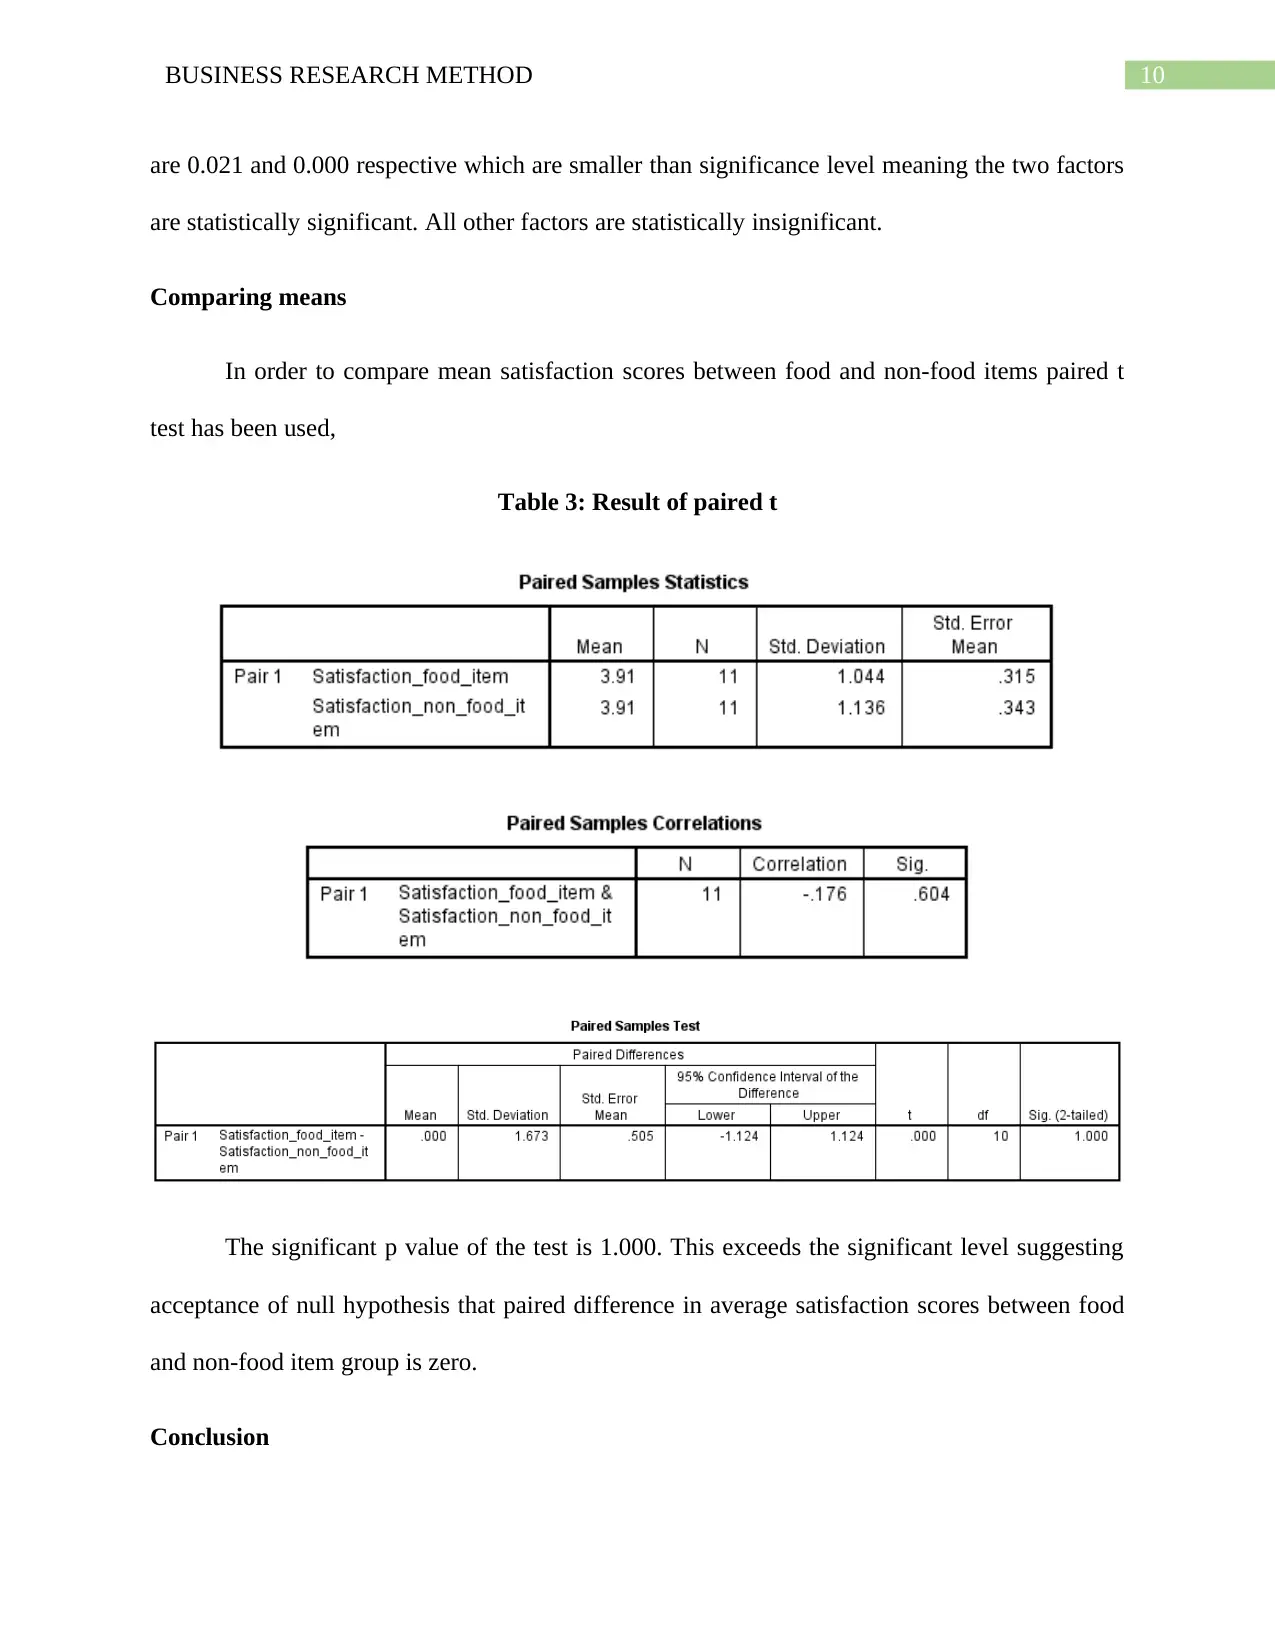
This report analyzes customer satisfaction in a retail grocery store using data from a survey of 40 customers. The analysis employs descriptive statistics, correlation analysis, regression analysis, and paired t-tests. The correlation analysis reveals a negative association between customer satisfaction and product type (food vs. non-food), with a positive correlation observed for factors such as stock levels, ease of finding products, and staff quality. Regression analysis indicates that 75% of the variation in customer satisfaction is explained by product type, stock condition, product accessibility, pricing, and staff service. The study finds that the ease of finding products and staff quality are statistically significant determinants of customer satisfaction. A paired t-test comparing satisfaction scores between food and non-food items reveals no significant difference. The report concludes that improving product accessibility and ensuring high-quality staff service are crucial for enhancing customer satisfaction in the retail grocery store.
Document Page
Running head: BUSINESS RESEARCH METHOD
Business Research Method
Name of the Student
Name of the University
Course ID
tabler-icon-diamond-filled.svg

Paraphrase This Document

Need a fresh take? Get an instant paraphrase of this document with our AI Paraphraser
Document Page
1BUSINESS RESEARCH METHOD
Table of Contents
Introduction......................................................................................................................................2
Data analysis and discussion...........................................................................................................2
Descriptive statistics....................................................................................................................2
Correlation...................................................................................................................................6
Regression....................................................................................................................................8
Comparing means......................................................................................................................10
Conclusion.....................................................................................................................................10
Document Page
2BUSINESS RESEARCH METHOD
Introduction
The report has been prepared to analyze customer satisfaction of a retail grocery store in
Australia. Data are collected from survey responses for designed questionnaire related to
customer satisfaction. The sample data size is 40. Techniques used for the data analysis include
descriptive statistics, measures of association like correlation and regression and paired t test for
comparing means.
Data analysis and discussion
Descriptive statistics
Document Page
3BUSINESS RESEARCH METHOD
tabler-icon-diamond-filled.svg

Paraphrase This Document

Need a fresh take? Get an instant paraphrase of this document with our AI Paraphraser
Document Page
4BUSINESS RESEARCH METHOD
Document Page
5BUSINESS RESEARCH METHOD
Document Page
6BUSINESS RESEARCH METHOD
Correlation
Correlation coefficient in statistical analysis is taken as a measure that indicates
association between two variables. The two extremely values of correlation coefficient are 0 and
1. Bi-variate correlation analysis has been used to explore the relation between customer
tabler-icon-diamond-filled.svg

Paraphrase This Document

Need a fresh take? Get an instant paraphrase of this document with our AI Paraphraser
Document Page
7BUSINESS RESEARCH METHOD
satisfaction and other associated factors. The result of correlation coefficient is summarized in
table 1.
Table 1: Correlation matrix for customer satisfaction and associated factors
The correlation coefficient between satisfaction and type of product is -0.140. Negative
correlation coefficient signifies a negative association meaning customers satisfaction is higher
for food items compared to non-food items or those purchasing both food and non-food items.
The stock of the store has a positive association with customer satisfaction meaning customer
satisfaction is highest if products are well stocked. The correlation coefficient is 0.744. The
association between easiness to find the product and satisfaction level of customer is positive
with a correlation coefficient value of 0.692. Customers are more satisfied when they find the
prices are fair and competitive. The obtained correlation coefficient is -0.431. Friendly,
knowledgeable and helpful staffs are supportive for boosting customer satisfaction. Correlation
Document Page
8BUSINESS RESEARCH METHOD
coefficient between customer satisfaction and associated factors are statistically significant for
all factors except for types of product.
Regression
The regression analysis provides testable relation between the associated variable. The
obtained result from the regression analysis is summarized below.
Table 2: Regression result
Document Page
9BUSINESS RESEARCH METHOD
R square value of the customer satisfaction model is 0.751. The value indicates that
product type, state of stock, easy accessibility of the product, nature of price and service of the
staff is responsible for 75 percent variation in customer satisfaction. The regression coefficient
for type of product is -0.027 meaning that satisfaction decreases as customers move from food
item to non-food items or for both. The coefficient of state of stock is 0.279 indicating that
condition of stock positively influence satisfaction of customers of the store. The coefficients of
easiness of finding product and nature of price are 0.325 and 0.110 respectively meaning that
both have a positive influence on customer satisfaction. Another factor supporting for customer
satisfaction is quality of staff. Customer satisfaction is high when staffs are friendly,
knowledgeable and helpful. The p value for easiness of finding the product and quality of staffs
tabler-icon-diamond-filled.svg

Paraphrase This Document

Need a fresh take? Get an instant paraphrase of this document with our AI Paraphraser
Document Page
10BUSINESS RESEARCH METHOD
are 0.021 and 0.000 respective which are smaller than significance level meaning the two factors
are statistically significant. All other factors are statistically insignificant.
Comparing means
In order to compare mean satisfaction scores between food and non-food items paired t
test has been used,
Table 3: Result of paired t
The significant p value of the test is 1.000. This exceeds the significant level suggesting
acceptance of null hypothesis that paired difference in average satisfaction scores between food
and non-food item group is zero.
Conclusion
Document Page
11BUSINESS RESEARCH METHOD
The analysis on customer satisfaction of the retail grocery store has found that easiness of
finding product and quality of staffs are the two significant determinants of customer
satisfaction.
chevron_up_icon
1 out of 12
circle_padding
hide_on_mobile
zoom_out_icon
[object Object]